
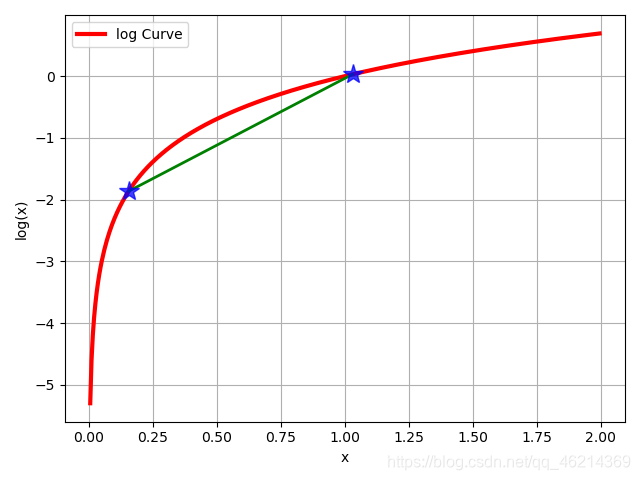
绘制log()函数图像,并在图上标注选定的两个点
绘制log()函数图像,并在图上标注选定的两个点
import math
import matplotlib.pyplot as plt

if __name__ == '__main__':
    x = [float(i)/200.0 for i in range(1,400)]
    y = [math.log(i) for i in x]
    plt.plot(x,y,'r-',linewidth=3, label= 'log Curve')
    a = [x[30],x[205]]
    b = [y[30],y[205]]
    plt.plot(a,b,'g-',linewidth=2)
    plt.plot(a,b,'b*',markersize=15,alpha=0.75)
    plt.legend(loc='upper left')
    plt.grid(True)
    plt.xlabel('x')
    plt.ylabel('log(x)')
    plt.show()
运行结果如下所示:

 浙公网安备 33010602011771号