ELK-day2-配置使用Filebeat
文章目录
配置使用Filebeat
轻量级日志收集组件,基本不消耗内存
主要工作:在每一台机器内收集日志,将日志同步到 > redis > logstash > Elasticsearch
所以每台机器都要装filebeat,选择对应所需组件进入下载,这里选择filebeat > 选择版本下载
1.下载安装
[root@es-01 ~]# wget https://artifacts.elastic.co/downloads/beats/filebeat/filebeat-7.12.1-x86_64.rpm
[root@es-01 ~]# yum localinstall -y filebeat-7.12.1-x86_64.rpm
2.修改配置模式
1)备份配置文件
[root@es-01 ~]# rpm -qc  filebeat | grep filebeat.yml
/etc/filebeat/filebeat.yml

# 查看除注释外的内容
[root@es-01 filebeat]# egrep -v '#' /etc/filebeat/filebeat.yml | egrep '[^\ ]'
filebeat.inputs:
- type: log
  enabled: false
  paths:
    - /var/log/*.log
- type: filestream
  enabled: false
  paths:
    - /var/log/*.log
filebeat.config.modules:
  path: ${path.config}/modules.d/*.yml
  reload.enabled: false
setup.template.settings:
  index.number_of_shards: 1
setup.kibana:
output.elasticsearch:
  hosts: ["localhost:9200"]
processors:
  - add_host_metadata:
      when.not.contains.tags: forwarded
  - add_cloud_metadata: ~
  - add_docker_metadata: ~
  - add_kubernetes_metadata: ~

 # 备份后再编辑
 [root@es-01 filebeat]# cp /etc/filebeat/filebeat.yml /etc/filebeat/filebeat.yml.bak
2)收集文件日志,输出到文件中
- 不同输入类型格式参考
- https://www.elastic.co/guide/en/beats/filebeat/current/configuring-output.html
- file格式:
output.file:		# filebeat输出
  path: "/tmp/filebeat"
  filename: filebeat.log
 [root@es-01 ~]# vim /etc/filebeat/filebeat.yml <<EOF
filebeat.inputs:   # filebeat输入
- type: log		   # 可随便定义
  paths:
    - /var/log/messages
    - /var/log/*.log
filebeat.config.modules:
  path: ${path.config}/modules.d/*.yml
  reload.enabled: false
setup.template.settings:
  index.number_of_shards: 1
setup.kibana:
output.file:		# filebeat输出
  path: "/tmp/filebeat"
  filename: filebeat.log
processors:
  - add_host_metadata:
      when.not.contains.tags: forwarded
  - add_cloud_metadata: ~
  - add_docker_metadata: ~
  - add_kubernetes_metadata: ~
[root@es-01 filebeat]# /usr/bin/filebeat -c /etc/filebeat/filebeat.yml
[root@es-01 filebeat]# systemctl restart filebeat.service
[root@es-01 ~]# tailf /tmp/filebeat/filebeat.log
5,\"5\":0.03,\"norm\":{\"1\":0.01,\"15\":0.025,\"5\":0.015}}}}}}","input":{"type":"log"},"ecs":01","type":"filebeat","version":"7.12.1"}}
	···
3)收集日志输出到redis
- https://www.elastic.co/guide/en/beats/filebeat/current/redis-output.html
- redis格式:
output.redis:
  hosts: ["localhost"]
  password: "my_password"
  key: "filebeat"
  db: 0
  timeout: 5
1> 配置
filebeat.inputs:
- type: log
  paths:
    - /var/log/messages
    - /var/log/*.log
filebeat.config.modules:
  path: ${path.config}/modules.d/*.yml
  reload.enabled: false
setup.template.settings:
  index.number_of_shards: 1
setup.kibana:
output.redis:
  hosts: ["192.168.12.72"]
  password: ""	# 对端redis的密码,若没有则为空
  key: "filebeat"
  db: 0		# 第0个数据库,redis默认有16个数据库
  timeout: 5
processors:
  - add_host_metadata:
      when.not.contains.tags: forwarded
  - add_cloud_metadata: ~
  - add_docker_metadata: ~
  - add_kubernetes_metadata: ~

# 添加此段,注意修改
output.redis:
  hosts: ["localhost"]
  password: "my_password"
  key: "filebeat"
  db: 0
  timeout: 5
2> 重启
[root@es-01 filebeat]# systemctl restart filebeat.service
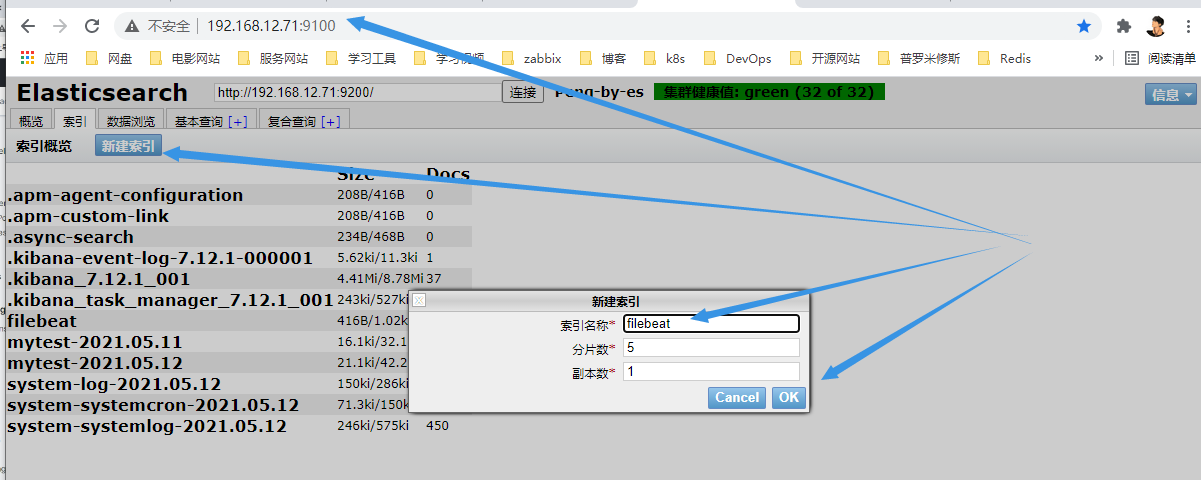
3> 对端查看
# 安装redis,并修改bind监听地址为0.0.0.0
# 启动redis
# 进入查看
[root@es-02 ~]# redis-cli
127.0.0.1:6379> KEYS *
1) "filebeat"
127.0.0.1:6379> lrange filebeat 0 -1
415) "{\"@timestamp\":\"2021-05-12T09:05:08.661Z\",\"@metadata\":{\\\"1\\\":0.03,\\\"15\\\":0.025,\\\"5\\\":0.025}}}}}}\"}"
	···
redis 参考文档
https://www.elastic.co/guide/en/logstash/current/plugins-inputs-redis.html

# 配置文件放在哪无所谓,运行时指定好路径即可~
[root@es-02 ~]# vim /etc/logstash/conf.d/redis-system.conf
input {
  redis {
    date_type => 'list'
    host => "192.168.12.72"
    key => "filebeat"
    port => 6379
  }
}

output {
    elasticsearch {
    hosts => ["172.16.1.72:9200"]
    index => "filebeat-systemlog-%{+YYYY.MM.dd}"
  }
}

# 运行logstash
[root@es-02 ~]# /usr/share/logstash/bin/logstash -f /etc/logstash/conf.d/redis-system.conf
Using bundled JDK: /usr/share/logstash/jdk
OpenJDK 64-Bit Server VM warning: Option UseConcMarkSweepGC was deprecated in version 9.0 and will likely be removed in a future release.
5.安装配置nginx
- 使用Nginx反向代理,配置域名访问kibana
# 安装Nginx
[root@es-01 ~]#  yum install -y nginx

# 配置nginx默认配置文件
[root@es-01 ~]# cat /etc/nginx/nginx.conf
# 删除尾行以下的所有配置
user nginx;
worker_processes auto;
error_log /var/log/nginx/error.log;
pid /run/nginx.pid;

# Load dynamic modules. See /usr/share/doc/nginx/README.dynamic.
include /usr/share/nginx/modules/*.conf;

events {
    worker_connections 1024;
}

http {
    log_format  main  '$remote_addr - $remote_user [$time_local] "$request" '
                      '$status $body_bytes_sent "$http_referer" '
                      '"$http_user_agent" "$http_x_forwarded_for"';

    access_log  /var/log/nginx/access.log  main;

    sendfile            on;
    tcp_nopush          on;
    tcp_nodelay         on;
    keepalive_timeout   65;
    types_hash_max_size 2048;

    include             /etc/nginx/mime.types;
    default_type        application/octet-stream;

    # Load modular configuration files from the /etc/nginx/conf.d directory.
    # See http://nginx.org/en/docs/ngx_core_module.html#include
    # for more information.
    include /etc/nginx/conf.d/*.conf;
}

# 配置kibana域名访问
[root@es-01 ~]# cat /etc/nginx/conf.d/kibana.conf
server {
    listen 80;
    server_name linux.kibana.com;

    location / {
	proxy_pass http://172.16.1.71:5601;
    }
}

# 启动Nginx
[root@es-01 ~]# systemctl start --now nginx

# 配置hosts解析
192.168.12.71 linux.kibana.com

# 访问测试
192.168.12.71:80
linux.kibana.com
4.ELK架构
# 安装filebeat
[root@es-02 ~]# wget https://artifacts.elastic.co/downloads/beats/filebeat/filebeat-7.12.1-x86_64.rpm
[root@es-02 ~]# yum install filebeat-7.12.1-x86_64.rpm
[root@es-02 ~]# vim /etc/filebeat/filebeat.yml
filebeat.inputs:
- type: log
  paths:
    - /var/log/messages
    - /var/log/*.log
output.redis:
  hosts: ["192.168.15.71"]
  password: ""
  key: "filebeat"
  db: 0
  timeout: 5
[root@es-02 ~]# systemctl start filebeat

# 安装redis
[root@es-02 ~]# yum install redis -y
[root@es-02 ~]# systemctl start redis

# 安装logstash
[root@es-02 ~]# wget https://artifacts.elastic.co/downloads/logstash/logstash-7.12.1-x86_64.rpm
[root@es-02 ~]# yum install logstash-7.12.1-x86_64.rpm -y
[root@es-01 ~]# cat redis-system.conf
input {
  redis {

	data_type => 'list'
	host => "192.168.15.71"
	key => "filebeat"
	port => 6379
  }
}

output {

	elasticsearch {

		hosts => ["172.16.1.70:9200"]
		index => "filebeat-systemlog-%{+YYYY.MM.dd}"

	}

}
[root@es-01 ~]# /usr/share/logstash/bin/logstash -f redis-system.conf

# elasticsearch
[root@es-01 ~]# grep -E '^[^#]' /etc/elasticsearch/elasticsearch.yml
cluster.name: chenyang-by-es
node.name: chenyang-node-01
path.data: /var/lib/elasticsearch
path.logs: /var/log/elasticsearch
bootstrap.memory_lock: true
network.host: 0.0.0.0
http.port: 9200
http.cors.enabled: true
http.cors.allow-origin: "*"
cluster.initial_master_nodes: ["172.16.1.70"]
discovery.zen.minimum_master_nodes: 2
discovery.zen.ping.unicast.hosts: ["172.16.1.70","172.16.1.71"]


# 安装kibana
[root@es-02 ~]# grep -E '^[^#]' /etc/kibana/kibana.yml
server.port: 5601
server.host: "172.16.1.71"
elasticsearch.hosts: ["http://172.16.1.70:9200"]

# 优化
[root@es-01 ~]# yum install nginx -y
[root@es-01 ~]# vim /etc/nginx/conf.d/kibana.conf
server {
	listen 80;
	server_name kibana.default.cluster.local.com;

	auth_basic "User Authentication";
    auth_basic_user_file /etc/nginx/auth;

	location / {
		proxy_pass http://172.16.1.71:5601;
	}

}
server {
	listen 80 default_server;
	server_name locahost;
	return 302 http://kibana.default.cluster.local.com;
}

 浙公网安备 33010602011771号