使用XHProf分析PHP性能瓶颈(一)
安装xhprof扩展
wget http://pecl.php.net/get/xhprof-0.9.4.tgz
tar zxf xhprof-0.9.4.tgz
cd xhprof-0.9.4/extension/
sudo phpize
./configure
sudo make
sudo make install
cd ../
配置php.ini
[xhprof]
extension=xhprof.so
xhprof.output_dir=/tmp
注:xhprof已经很久没有更新过了,截至目前还不支持php7,php7可以使用 https://github.com/phacility/xhprof.git 。
配置xhprof环境
需要把xhprof压缩包里的两个目录复制到指定目录(假设定义到 /work/xhprof/):
mkdir /work/xhprof/
cp -a xhprof_html/ /work/xhprof/
cp -a xhprof_lib/ /work/xhprof/
然后在项目框架的入口文件添加:
xhprof_enable(XHPROF_FLAGS_MEMORY | XHPROF_FLAGS_CPU);
register_shutdown_function(function() {
    $xhprof_data = xhprof_disable();
    if (function_exists('fastcgi_finish_request')){
        fastcgi_finish_request();
    }
    include_once "/work/xhprof/xhprof_lib/utils/xhprof_lib.php";
    include_once "/work/xhprof/xhprof_lib/utils/xhprof_runs.php";
    $xhprof_runs = new XHProfRuns_Default();
    $run_id = $xhprof_runs->save_run($xhprof_data, 'xhprof');
});
代码解析:
$xhprof_data中记录了程序运行过程中所有的函数调用时间及CPU内存消耗,具体记录哪些指标可以通过xhprof_enable的参数控制,目前支持的参数有:
HPROF_FLAGS_NO_BUILTINS跳过所有内置(内部)函数。XHPROF_FLAGS_CPU输出的性能数据中添加 CPU 数据。XHPROF_FLAGS_MEMORY输出的性能数据中添加内存数据。
之后的处理已经与xhprof扩展无关,大致是编写一个存储类XHProfRuns_Default,将$xhprof_data序列化并保存到某个目录,可以通过XHProfRuns_Default(__DIR__)将结果输出到当前目录,如果不指定则会读取php.ini配置文件中的xhprof.output_dir,仍然没有指定则会输出到/tmp。
xhprof_enable和xhprof_disable是成对出现的,一个是代码运行最前面,一个是最后面。中间是要分析的代码。
经过上面的配置后,我们后续请求项目的接口,xhprof就会分析请求过程中的CPU、内存、耗时等内容。日志保存在xhprof.output_dir目录。
配置web
配置好了,怎么查看日志呢?我们可以搭建一个简单的web server:
xhprof.test.com.conf
server {
    listen       80;
    server_name  xhprof.test.com;

	root /work/xhprof/xhprof_html;
	index  index.html index.php;


    location ~ \.php$ {
        fastcgi_pass   127.0.0.1:9000;
        fastcgi_index  index.php;
        fastcgi_param  SCRIPT_FILENAME  $document_root$fastcgi_script_name;
        include        fastcgi_params;
    }
}
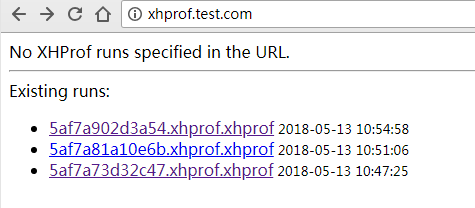
然后配置虚拟主机xhprof.test.com。重启nginx,打开 xhprof.test.com就可以看到效果了:
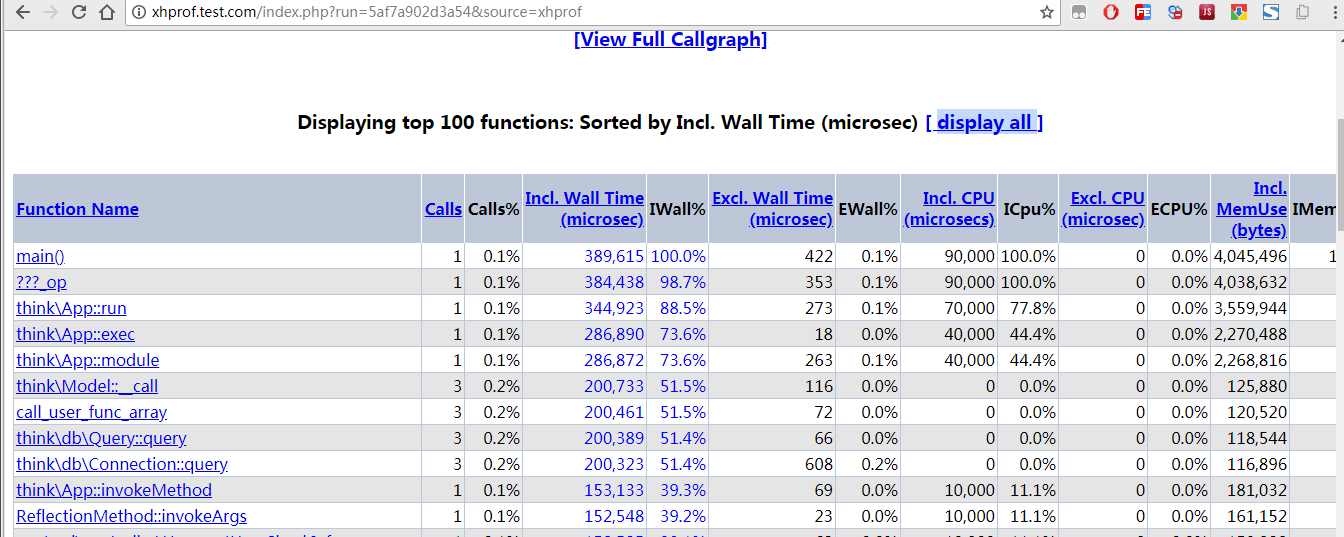
默认的UI里列出了:
- funciton name : 函数名
- calls: 调用次数
- Incl. Wall Time (microsec): 函数运行时间(包括子函数)
- IWall%:函数运行时间(包括子函数)占比
- Excl. Wall Time(microsec):函数运行时间(不包括子函数)
- EWall%:函数运行时间(不包括子函数)
在web中还可以看到 [View Full Callgraph] 链接,点击后可以绘制出一张可视化的性能分析图,如果点击后报错的话,可能是缺少依赖graphviz。graphviz是一个绘制图形的工具,可以更为直观的让你查看性能的瓶颈。如果需要可以安装:
yum install -y libpng
yum install -y graphviz
效果:

非侵入式引入xhprof
前面我们是通过在项目入口文件添加代码实现了分析的功能。更优雅的方式是新建一个额外的文件 xhprof.inc.php,保存在/work/xhprof/目录下:
xhprof_enable(XHPROF_FLAGS_MEMORY | XHPROF_FLAGS_CPU);
register_shutdown_function(function() {
    $xhprof_data = xhprof_disable();
    if (function_exists('fastcgi_finish_request')){
        fastcgi_finish_request();
    }
    include_once "/work/xhprof/xhprof_lib/utils/xhprof_lib.php";
    include_once "/work/xhprof/xhprof_lib/utils/xhprof_runs.php";
    $xhprof_runs = new XHProfRuns_Default();
    $run_id = $xhprof_runs->save_run($xhprof_data, 'xhprof');
});
利用PHP的自动加载功能,在执行代码前注入此文件,编辑php.ini:
auto_prepend_file = /work/xhprof/xhprof.inc.php
然后重启PHP服务。这样所有使用该php环境的都会生效。
或者写到指定项目的nginx配置里也行:
jifen.cc.conf
location ~ \.php$ {

        fastcgi_pass   127.0.0.1:9000;
        fastcgi_index  index.php;
        fastcgi_param  SCRIPT_FILENAME  $document_root$fastcgi_script_name;
	fastcgi_param PHP_VALUE "auto_prepend_file=/work/xhprof/xhprof.inc.php";
        include        fastcgi_params;
    }
然后重启nginx服务。这样仅该项目生效。
通过 auto_prepend_file 和 auto_append_file包含的文件在此模式下会被解析,但有些限制,例如函数必须在被调用之前定义。
修改采样频率
默认情况下,xhprof每次都会运行,线上环境如果这么设置,会对性能有影响。
xhprof.inc.php
<?php
$profiling = !(mt_rand()%9);
if($profiling) xhprof_enable(XHPROF_FLAGS_MEMORY | XHPROF_FLAGS_CPU);
register_shutdown_function(function() use($profiling) {
    if($profiling){
		$xhprof_data = xhprof_disable();
		if (function_exists('fastcgi_finish_request')){
			fastcgi_finish_request();
		}
		include_once "/work/xhprof/xhprof_lib/utils/xhprof_lib.php";
		include_once "/work/xhprof/xhprof_lib/utils/xhprof_runs.php";
		$xhprof_runs = new XHProfRuns_Default();
		$xhprof_runs->save_run($xhprof_data, 'xhprof');
	}
});
总结
本篇文章里,我们介绍了如何基于xhprof扩展来分析PHP性能,并记录到日志里,最后使用xhprof扩展自带的UI在web里展示出来。主要知识点:
- 安装xhprof扩展
- 在应用里注入xhprof
- 基于nginx展示分析结果
参考
1、Xhprof 的配置和使用方法 - 简书
https://www.jianshu.com/p/38e3ae81970c
2、使用XHProf查找PHP性能瓶颈 - 程序猿成长计划 - SegmentFault 思否
https://segmentfault.com/a/1190000003509917
3、PHP性能追踪及分析工具xhprof的安装与使用 - 马新才的技术博客 - SegmentFault 思否
https://segmentfault.com/a/1190000007288664
4、Tideways和xhgui打造PHP非侵入式监控平台 | 我是大熊
http://blog.it2048.cn/article-tideways-xhgui/
欢迎关注公众号"飞鸿影记(fhyblog)",探寻物件背后的逻辑,记录生活真实的影子。

作者:飞鸿影
出处:http://52fhy.cnblogs.com/
版权申明:没有标明转载或特殊申明均为作者原创。本文采用以下协议进行授权,自由转载 - 非商用 - 非衍生 - 保持署名 | Creative Commons BY-NC-ND 3.0,转载请注明作者及出处。


 浙公网安备 33010602011771号