

Box Plot in Python using Matplotlib
import matplotlib.pyplot as plt import numpy as np # Creating dataset np.random.seed(10) data_1 = np.random.normal(100, 10, 200) data_2 = np.random.normal(90, 20, 200) data_3 = np.random.normal(80, 30, 200) data_4 = np.random.normal(70, 40, 200) data = [data_1, data_2, data_3, data_4] fig = plt.figure(figsize =(10, 7)) # Creating axes instance ax = fig.add_axes([0, 0, 1, 1]) # Creating plot bp = ax.boxplot(data) # show plot plt.show() 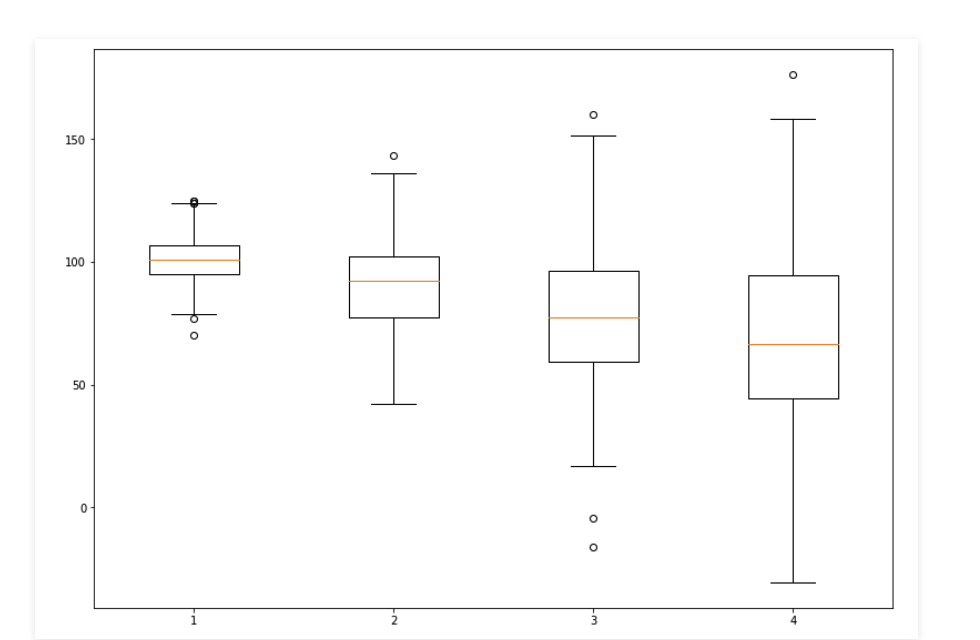
plt.savefig('Matplotlib_save_plot.png')

 浙公网安备 33010602011771号