
使用激光雷达数据构建地图(MATLAB Robotics System Toolbox)
地图有很多种表示方式,例如,用经纬度标识地方的世界地图,城市的地铁图,校园指引图。
- 尺度地图(Metric Map),每一个地点都可以用坐标来表示,比如北京在东经116°23′17'',北纬39°54′27'';
- 拓扑地图(Topological Map),每一个地点用一个点来表示,用边来连接相邻的点,即图论中的图(Graph),比如从地铁路线图中我们知道地铁红磡站与旺角东站和尖东站相连;
- 语义地图(Semantic Map),其中每一个地点和道路都会用标签的集合来表示,例如,有人问我中山大学教学楼E栋在哪里,我会说在图书馆正门右手边靠近图书馆的一侧。
在机器人领域,尺度地图常用于定位于地图构建(Mapping)、定位(Localization)和同时定位与地图构建(Simultaneous Localization And Mapping,SLAM),拓扑地图常用于路径规划(Path Planning),而语义地图常用于人机交互(Human Robot Interaction)。用机器人传感器数据绘制尺度地图的难点在于传感器数据有噪声,用激光传感器检测前方障碍物距离机器人多远,不可能检测到一个准确的数值。比如准确值是 米,有时会测出1.42米,有时甚至1.35米。另外,传感器数据是本地坐标系的,而机器人要构建的是一个全局的地图。最后,机器人会运动,运动也是有噪音的。总结起来就两个字,噪音。通俗来讲,“不准”。
栅格图
Occupancy grids are used to represent a robot workspace as a discrete grid. Information about the environment can be collected from sensors in real time or be loaded from prior knowledge. Laser range finders, bump sensors, cameras, and depth sensors are commonly used to find obstacles in your robot's environment.
- Binary Occupancy Grid
Occupancy grids are used in robotics algorithms such as path planning. They are also used in mapping applications, such as for finding collision-free paths, performing collision avoidance, and calculating localization. Each cell in the occupancy grid has a value representing the occupancy status of that cell. An occupied location is represented as true (1) and a free location is represented as false (0). This grid shows where obstacles are and whether a robot can move through that space. Use a binary occupancy grid if memory size is a factor in your application.
下面的MATLAB代码将自己画的图像转换为Binary Occupancy Grid:
% Import Image
image = imread('map.bmp')

% Convert to grayscale and then black and white image based on arbitrary threshold.
grayimage = rgb2gray(image);
bwimage = grayimage < 0.5;

% Use black and white image as matrix input for binary occupancy grid
% map = robotics.BinaryOccupancyGrid(p) creates a grid from the values in matrix p.
grid = robotics.BinaryOccupancyGrid(bwimage);
show(grid)

- Probability occupancy grid
A probability occupancy grid uses probability values to create a more detailed map representation. Each cell in the occupancy grid has a value representing the probability of the occupancy of that cell. Values close to 1 represent a high certainty that the cell contains an obstacle. Values close to 0 represent certainty that the cell is not occupied and obstacle free.
下面MATLAB代码创建了一幅概率栅格图:
% Create a 10m-by-10m empty map.
map = robotics.OccupancyGrid(10,10,10);

x = [1.2; 2.3; 3.4; 4.5; 5.6];
y = [5.0; 4.0; 3.0; 2.0; 1.0];
pvalues = [0.2 0.4 0.6 0.8 1];

% Update the occupancy of world locations with specific probability values.
updateOccupancy(map, [x y], pvalues)

show(map)

Insert Laser Scans Into Occupancy Grid
在栅格地图中插入激光扫描数据可以使用insertRay函数,该函数有多种使用方式,下面为常见的两种:
insertRay(inserts one or more lidar scan sensor observations in the occupancy grid,map,pose,scan,maxrange):map, using the inputlidarScanobject,scan, to get ray endpoints. The ray endpoints are considered free space if the input scan ranges are belowmaxrange. Cells observed as occupied are updated with an observation of 0.7. All other points along the ray are treated as obstacle free and updated with an observation of 0.4. Endpoints abovemaxrangeare not updated.NaNvalues are ignored. This behavior correlates to the inverse sensor model.
insertRay(specifies the range readings as vectors,map,pose,ranges,angles,maxrange):rangesandangles.
下面将激光雷达获取的距离和角度数据插入栅格地图中。首先我们创建一幅空地图,尺寸为10m×10m,分辨率为20格/m
map = robotics.OccupancyGrid(10,10,20);
假设机器人在[5,5,0]处采集到一帧激光数据,通过insertRay函数将扫描数据插入空地图中。注意调用函数时需要指定机器人的位姿态,最大扫描范围等信息
pose = [5,5,0]; % Position and orientation of robot, specified as an[x y theta]vector. The robot pose is an x and y position with angular orientation (in radians) measured from the x-axis.
ranges = 3*ones(100, 1); % Range values from scan data
angles = linspace(-pi/2, pi/2, 100); % Angle values from scan data. The vector must be the same length as the correspondingrangesvector.
maxrange = 20; % Maximum range of laser range sensor, specified as a scalar. Range values greater than or equal tomaxrangeare considered free along the whole length of the ray, up tomaxrange.
insertRay(map,pose,ranges,angles,maxrange); % Insert ray from laser scan observation
然后可以通过Show函数查看插入激光数据的地图,并可以查看机器人前方一点处的栅格状态
show(map)
getOccupancy(map,[8 5])    % Get occupancy of a location
ans =

    0.7000
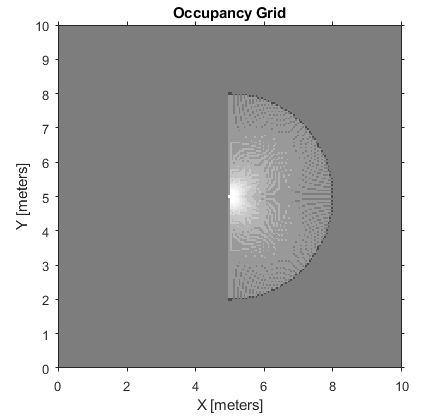
可以多次插入激光数据来更新地图(The additional reading increases the confidence in the reading)。下图为连续调用8次insertRay函数显示的地图变化,可以看出随着扫描次数增加,激光扫描扇形区域内的亮度越来越大,而边缘越来越暗(说明内部无障碍物,而边缘存在障碍的可能性越来越大):
地图上[8, 5]处栅格占据状态的概率值越来越大:0.7000 0.8448 0.9270 0.9673 0.9857 0.9938 0.9973 0.9989
Mapping With Known Poses
下面的例子假设某一时刻机器人的位置和姿态已知,使用激光雷达数据来创建外部环境的地图。
- Initialize the Robot Simulator
在MATALB中开启ROS master:
rosinit
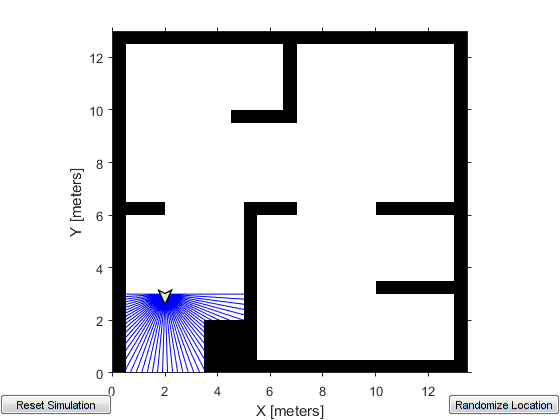
初始化仿真器并给机器人赋予一个初始位置和姿态。模拟的机器人是两轮差动机器人,并配有激光雷达可以对周围环境进行扫描测距。
sim = ExampleHelperRobotSimulator('simpleMap');
setRobotPose(sim, [2 3 -pi/2]);

% Enable ROS interface for the simulator. The simulator
% creates publishers and subscribers to send and receive data over ROS.
enableROSInterface(sim, true);

% Increase the laser sensor resolution in the simulator to
% facilitate map building.
sim.LaserSensor.NumReadings = 50;
- Setup ROS Interface
Create ROS publishers and subscribers to communicate with the simulator. 创建一个 rossubscriber
scanSub = rossubscriber('scan');
为了创建地图,机器人需要在图中进行遍历来搜集激光雷达数据。需要创建一个 rospublisher
[velPub, velMsg] = rospublisher('/mobile_base/commands/velocity'); % [pub,msg] = rospublisher(___) returns a message, msg, that you can send with the publisher, pub
仿真器会通过/tf话题发布机器人相对于map原点位置的消息( which is used as the source for the ground truth robot pose in this example)。坐标系变换中用到的机器人坐标系名字为robot_base,地图坐标系名字为map. 使用 rostf
tftree = rostf;

% Pause for a second for the transformation tree object to finish initialization.
pause(1);
- Create a Path Controller
机器人需要遍历周围环境搜集传感器数据来构建地图。设计一系列路径点让机器人能扫完整个地图( Assign a path with waypoints that cover the entire map)
path = [2, 3;3.25 6.25;2 11;6 7; 11 11;8 6; 10 5;7 3;11 1.5];
显示路径:
plot(path(:,1), path(:,2),'k--d');

有了路径点我们还需要机器人能沿着指定的路径运动,robotics.PurePursuit对象(creates a controller object used to make a differential drive robot follow a set of waypoints)就可以实现这一功能。
controller = robotics.PurePursuit('Waypoints', path);
controller.DesiredLinearVelocity = 0.4;
设置控制周期为10Hz
controlRate = robotics.Rate(10);
定义一个目标点以及目标半径,让机器人到达目标位置时能够停止:
goalRadius = 0.1;
robotCurrentLocation = path(1,:);
robotGoal = path(end,:);
distanceToGoal = norm(robotCurrentLocation - robotGoal);
- Define an Empty Map
用robotics.OccupancyGrid创建一幅14m×13m的空地图,分辨率为20 cells/m
map = robotics.OccupancyGrid(14,13,20);
显示地图:
figureHandle = figure('Name', 'Map');
axesHandle = axes('Parent', figureHandle);
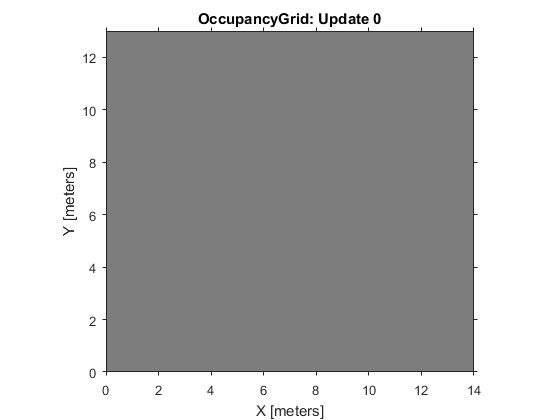
mapHandle = show(map, 'Parent', axesHandle);
title(axesHandle, 'OccupancyGrid: Update 0');
接下来的循环将在机器人运动过程中不断更新地图,主要有以下几个步骤:
- 首先通过scanSub订阅传感器消息接收激光雷达数据,然后使用
getTransformmapandrobot_baseframes at the time of the sensor reading. - 通过变换获取机器人的位置和姿态。机器人的姿态是绕Z轴的偏航角(Yaw),可以通过
quat2eul 函数将四元数转换为欧拉角来获取偏航角。 - 对激光雷达数据进行预处理:如果在最大测量范围内没有检测到任何障碍物,模拟器返回的激光数据将为NaN,程序中将NaN替换为最大测量距离。
- 通过
robotics.OccupancyGrid.insertRay - 计算机器人的线速度和角速度,通过controller来驱动机器人运动。
- 每运行50步显示一次新地图。
updateCounter = 1;
while( distanceToGoal > goalRadius )
    % Receive a new laser sensor reading
    scanMsg = receive(scanSub);

    % Get robot pose at the time of sensor reading
    pose = getTransform(tftree, 'map', 'robot_base', scanMsg.Header.Stamp, 'Timeout', 2);

    % Convert robot pose to 1x3 vector [x y yaw]
    position = [pose.Transform.Translation.X, pose.Transform.Translation.Y];
    orientation =  quat2eul([pose.Transform.Rotation.W, pose.Transform.Rotation.X, pose.Transform.Rotation.Y, pose.Transform.Rotation.Z], 'ZYX');
    robotPose = [position, orientation(1)];

    % Extract the laser scan
    scan = lidarScan(scanMsg);
    ranges = scan.Ranges;
    ranges(isnan(ranges)) = sim.LaserSensor.MaxRange;
    modScan = lidarScan(ranges, scan.Angles);

    % Insert the laser range observation in the map
    insertRay(map, robotPose, modScan, sim.LaserSensor.MaxRange);

    % Compute the linear and angular velocity of the robot and publish it to drive the robot.
    [v, w] = controller(robotPose);
    velMsg.Linear.X = v;
    velMsg.Angular.Z = w;
    send(velPub, velMsg);  % Send these messages via the ROS publisher with the send function.

    % Visualize the map after every 50th update.
    if ~mod(updateCounter,50)
        mapHandle.CData = occupancyMatrix(map);
        title(axesHandle, ['OccupancyGrid: Update ' num2str(updateCounter)]);
    end

    % Update the counter and distance to goal
    updateCounter = updateCounter + 1;
    distanceToGoal = norm(robotPose(1:2) - robotGoal);

    % Wait for control rate to ensure 10 Hz rate
    waitfor(controlRate);
end
地图更新过程如下图所示:
显示最终的地图:
show(map, 'Parent', axesHandle);
title(axesHandle, 'OccupancyGrid: Final Map');

Problems in Mapping
上面这个例子在建图时假设机器人的位置已知,但实际上在很多情况下我们无法准确获取机器人的位置。
定位(localization):机器人需要估计其相对于环境(由地图给定)中物体的位置
构图(mapping):机器人需要构建出其所探测的环境中物体的分布情况(此时机器人位置已知)
即时定位与地图构(SLAM):机器人利用带有噪声的传感器数据创建地图(感知未知环境,形成对局部环境的理解),同时还要利用已建立的环境地图确定自身位置。即机器人在自身位置不确定的条件下,在完全未知的环境中创建地图,同时利用地图进行自主定位,这是一个“鸡生蛋、蛋生鸡”的悖论问题。
在地图构建的过程中要考虑下面两个关键的问题(如何理解并使用传感器信息以及如何估计机器人的位置):
- Sensor interpretation
• How do we extract relevant information from raw sensor data?
• How do we represent and integrate this information over time?
- Robot locations have to be known
• How can we estimate them during mapping?
参考:
Insert ray from laser scan observation
Occupancy Grids—MATLAB Documentation

 浙公网安备 33010602011771号