

20192307 2019-2020-2 《Python程序设计》实验四报告
20192307 2019-2020-2 《Python程序设计》实验四报告
课程:《Python程序设计》
班级: 1923班
姓名: 常万里
学号: 20192307
实验教师:王志强
实验日期:2020年6月10日
必修/选修: 公选课
1.实验内容
- Python综合应用:爬虫、数据处理、可视化、机器学习、神经网络、游戏、网络安全等;
- 经过选择,我选择了编写爬虫程序,可视化展示和生成HTML文件,来进行程序编写。
2. 实验过程及结果
2.1 爬虫程序的确定与编写
本次数据通过爬虫技术爬取丁香园获得
首先导入需要运用到的库
"""
文件名:Python语言基础实践10
描  述:实验四
作  者:20192307
日  期:2020/06/01
"""
import json
import matplotlib.pyplot as plt
import requests
from matplotlib import ticker
from re import search, S
from json import loads, dump
from requests import get
import datetime
from pyecharts.charts import Map
from pyecharts import options as opts
先爬取 丁香园实时统计数据 ,保存到data目录下,以当前日期作为文件名,存JSON文件
url = 'https://view.inews.qq.com/g2/getOnsInfo?name=disease_other'
html = requests.get(url)
message = json.loads(html.text)
mes = json.loads(message['data'])
mes_dict = mes["dailyNewAddHistory"]
date = []
country = []
hubei = []
nothubei = []
n = 0
for d in mes_dict:
date.append(d['date'])
country.append(d['country'])
hubei.append(d['hubei'])
nothubei.append(d['notHubei'])
n = n + 1
if n > 40:
break
x = date
y1 = country
y2 = hubei
y3 = nothubei
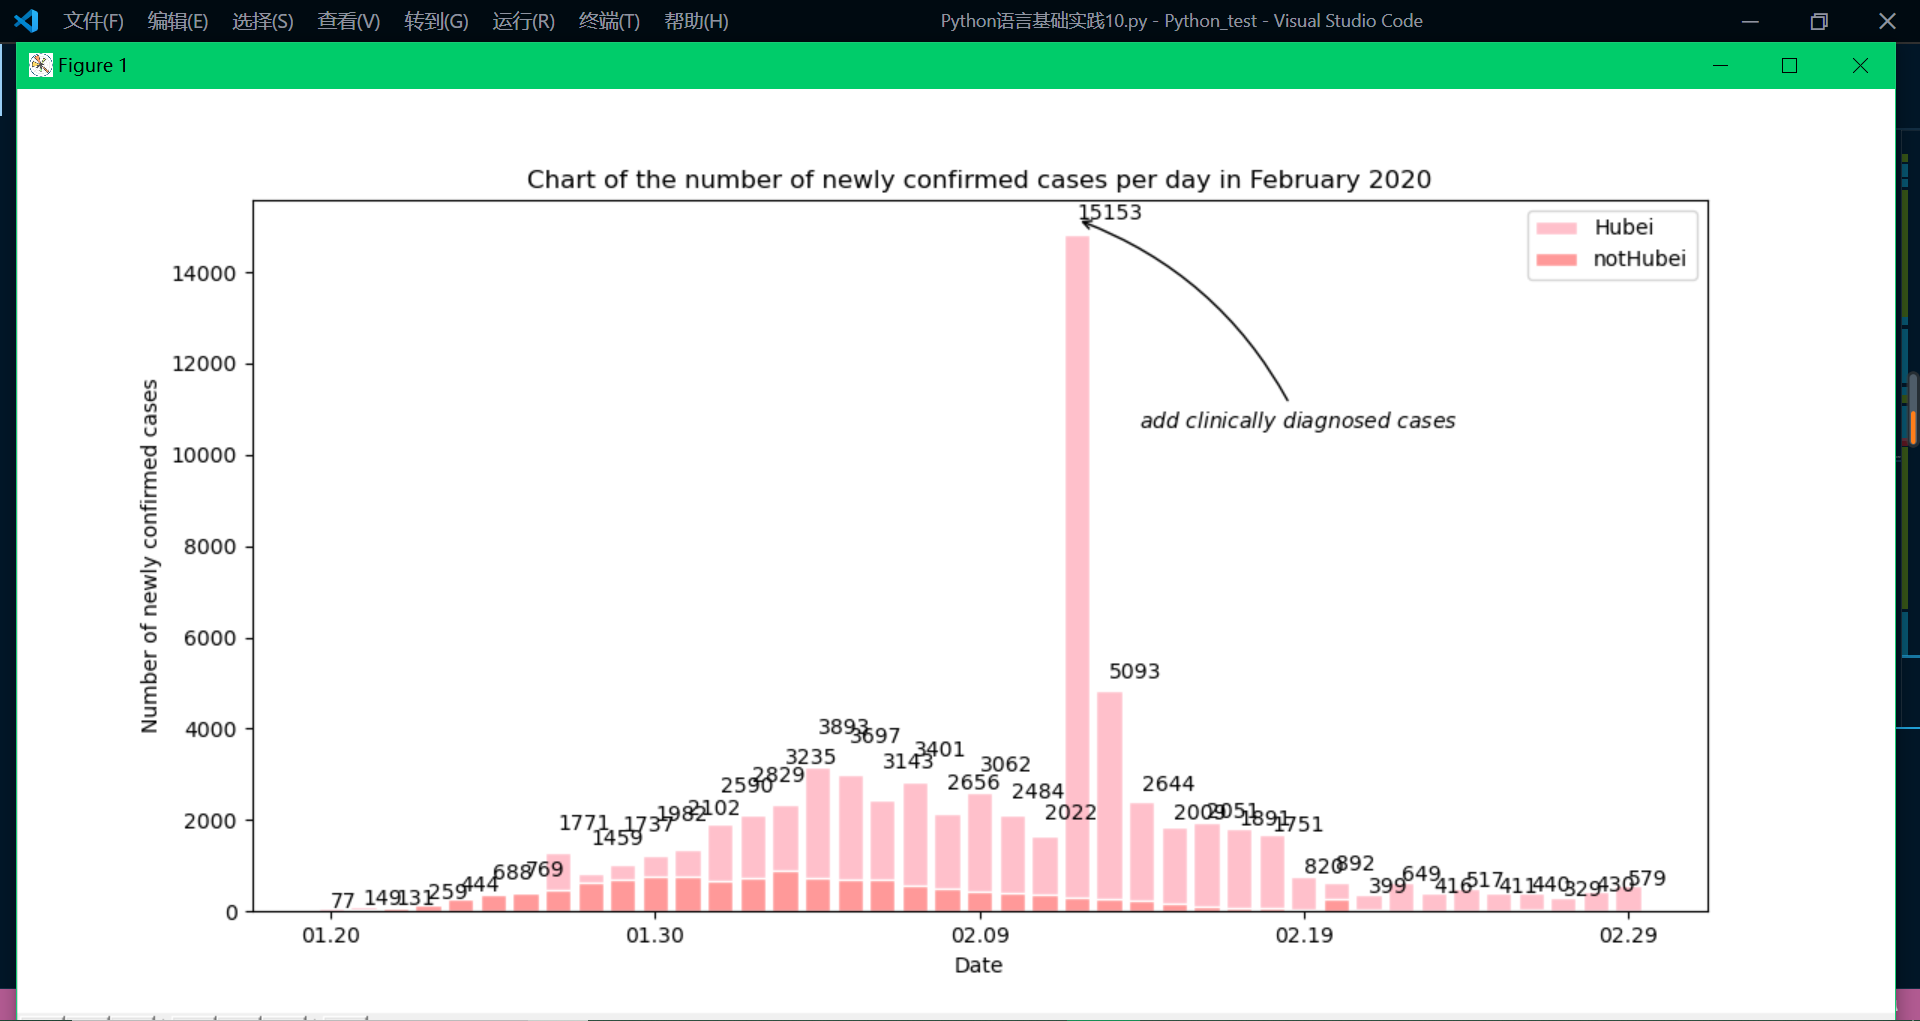
plt.figure(figsize=(20, 10))
plt.title(
"Chart of the number of newly confirmed cases per day in February 2020")
plt.xlabel('Date')
plt.ylabel('Number of newly confirmed cases')
plt.bar(x, y2, facecolor='pink', edgecolor='white', label='Hubei')
plt.bar(x, y3, facecolor='#ff9999', edgecolor='white', label='notHubei')
plt.gca().xaxis.set_major_locator(ticker.MultipleLocator(10))
plt.annotate(r"$add\ clinically\ diagnosed\ cases$",
xy=('02.12', 15153),
xycoords='data',
xytext=(+30, -100),
textcoords='offset points',
arrowprops=dict(arrowstyle="->", connectionstyle="arc3,rad=.2"))
for x, y in zip(x, y1):
plt.text(x, y + 1, y, ha='left')
plt.legend()
plt.show()
today = datetime.date.today().strftime('%Y%m%d')
def crawl_dxy_data():
response = get('https://ncov.dxy.cn/ncovh5/view/pneumonia')
# request.get()用于请求目标网站
print(response.status_code)
# 打印状态码
try:
url_text = response.content.decode()
url_content = search(r'window.getAreaStat = (.*?)}]}catch', url_text,
S)
texts = url_content.group() # 获取匹配正则表达式的整体结果
content = texts.replace('window.getAreaStat = ',
'').replace('}catch', '') # 去除多余的字符
json_data = loads(content)
with open(today + '.json', 'w', encoding='UTF-8') as f:
dump(json_data, f, ensure_ascii=False)
except (Exception):
print('<Response [%s]>' % response.status_code)
def crawl_statistics_data():
with open(today + '.json', 'r', encoding='UTF-8') as file:
json_array = loads(file.read())
statistics_data = {}
for province in json_array:
response = get(province['statisticsData'])
try:
statistics_data[province['provinceShortName']] = loads(
response.content.decode())['data']
except (Exception):
print('<Response [%s]> for url: [%s]' %
(response.status_code, province['statisticsData']))
with open("statistics_data.json", "w", encoding='UTF-8') as f:
dump(statistics_data, f, ensure_ascii=False)
然后是主程序
if __name__ == '__main__':
    crawl_dxy_data()
    crawl_statistics_data()
today = datetime.date.today().strftime('%Y%m%d')
datafile = today + '.json'
with open(datafile, 'r', encoding='UTF-8') as file:
    json_array = loads(file.read())
china_data = []
for province in json_array:
    china_data.append(
        (province['provinceShortName'], province['confirmedCount']))
china_data = sorted(china_data, key=lambda x: x[1], reverse=True)
# reverse=True,表示降序,反之升序
print(china_data)
pieces = [
    {
        'min': 10000,
        'color': '#540d0d'
    },
    {
        'max': 9999,
        'min': 1000,
        'color': '#9c1414'
    },
    {
        'max': 999,
        'min': 500,
        'color': '#d92727'
    },
    {
        'max': 499,
        'min': 100,
        'color': '#ed3232'
    },
    {
        'max': 99,
        'min': 10,
        'color': '#f27777'
    },
    {
        'max': 9,
        'min': 1,
        'color': '#f7adad'
    },
    {
        'max': 0,
        'color': '#f7e4e4'
    },
]
labels = [data[0] for data in china_data]
counts = [data[1] for data in china_data]
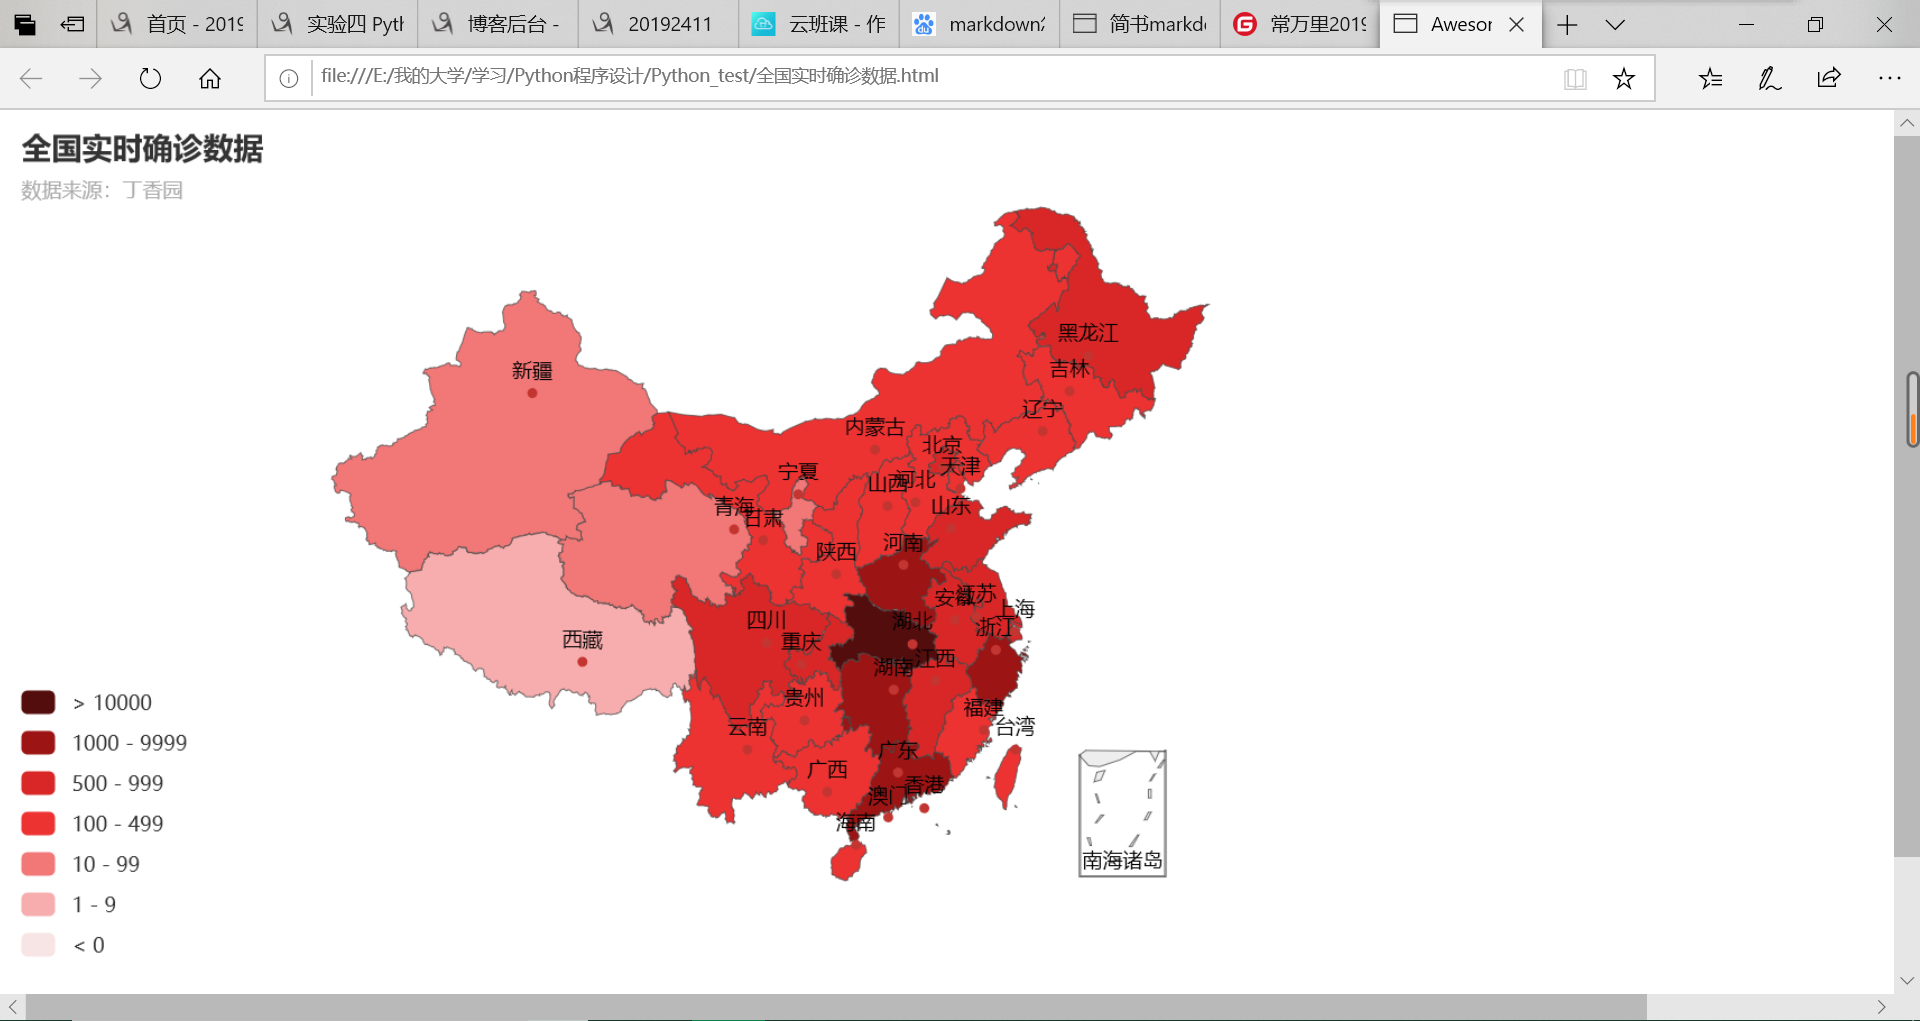
Echarts 是一个由百度开源的数据可视化工具,凭借着良好的交互性,精巧的图表设计,得到了众多开发者的认可。而 Python 是一门富有表达力的语言,很适合用于数据处理。
m = Map()
m.add("累计确诊", [list(z) for z in zip(labels, counts)], 'china')
# 系列配置项,可配置图元样式、文字样式、标签样式、点线样式等
m.set_series_opts(label_opts=opts.LabelOpts(font_size=12), is_show=False)
# 全局配置项,可配置标题、动画、坐标轴、图例等
m.set_global_opts(
    title_opts=opts.TitleOpts(title='全国实时确诊数据', subtitle='数据来源:丁香园'),
    legend_opts=opts.LegendOpts(is_show=False),
    visualmap_opts=opts.VisualMapOpts(
        pieces=pieces,
        is_piecewise=True,  # 是否为分段型
        is_show=True))  # 是否显示视觉映射配置
 # render()会生成本地 HTML 文件,默认会在当前目录生成 render.html 文件,也可以传入路径参数,如 m.render("mycharts.html")
 m.render(path='全国实时确诊数据.html')
2.2 运行结果的展示
运行结果截图为:
生成网站的展示:
提交代码,推送到码云仓库。
码云仓库地址为"https://gitee.com/python_programming/chang_wanli"
3. 实验过程中遇到的问题和解决过程
- 问题1:在第一次下载requests、pyecharts库的时候一直失败;
- 问题1解决方案:利用清华的镜像网站进行下载,下载速度会有极大提升,下载成功率也会有极大提高。
- 问题2:格式化代码时遇到问题;
- 问题2解决方案:在《Python编程:从入门到实践》一书中找到了相关课程,重新学习后,对于格式化代码以及数组,元组,序列,集合进行了重新编写。
- 问题3:正则表达式运用不成功;
- 问题3解决方案:在菜鸟教程上找到了正确的正则表达式运用格式。熟悉正则表达式格式后重新编写代码。
- 问题4:进行网站爬虫的时候不成功;
- 问题4解决方案:在菜鸟教程上找到了正确的网站爬虫运用格式。熟悉爬虫格式后重新编写代码。
4. 感悟与思考
在这次实验过程中,我遇到了许多问题,其中既有知识上的漏洞,也有不细心导致的马虎,这一切都补充,完善,丰富,扩展了我的python语言知识体系。在不断修复问题的过程中,我使用了很多方式去查询资料,例如:《Python编程:从入门到实践》,《[笨办法]学Python3(第三版)》,博客园平台,CDSN平台,码云平台,知乎app,等。在这个爬虫程序的编写中,我还进一步熟悉了vscode这个IDE平台的使用与运行方式,提高了自己自主学习的能力,为我接下来学习python语言程序设计打下了坚实的基础,并在不断探索的过程中逐步提升了自己。
参考资料
- 《Python编程:从入门到实践》
- 《[笨办法]学Python3(第三版)》
- 《Python基础教程(第3版)》
- 《Python核心编程(第3版)》

 浙公网安备 33010602011771号