python 基础画图
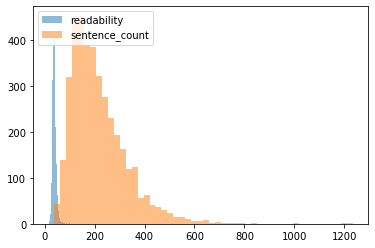
- 一、多个分布画在一张图上,alpha表示透明度
import numpy as np
import matplotlib.pyplot as plt
plt.hist(text_readability['readability'], bins=50, alpha = 0.5, label='readability')
plt.hist(text_readability['sentence_count'], bins=50, alpha = 0.5, label='sentence_count')
plt.legend(loc='upper left')
plt.show()
不重合
plt.hist([text_readability['word_count'], text_readability['sentence_count']], bins=50, label=['a', 'b'])
plt.legend(loc='upper left')
plt.show()
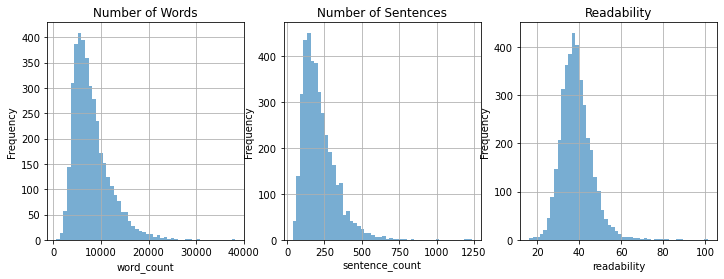
- 二、一张画布多个图
fig = plt.figure(figsize=(14,4))

plt.subplot(1,3,1)
text_readability['word_count'].hist(bins = 50, figsize = (12,4),alpha = 0.6,)
plt.title('Number of Words')
plt.ylabel('Frequency')
plt.xlabel('word_count')

plt.subplot(1,3,2)
text_readability['sentence_count'].hist(bins = 50,alpha = 0.6, figsize = (12,4))
plt.title('Number of Sentences')
plt.ylabel('Frequency')
plt.xlabel('sentence_count')

plt.subplot(1,3,3)
text_readability['readability'].hist(bins = 50, figsize = (12,4),alpha = 0.6,)
plt.title('Readability')
plt.ylabel('Frequency')
plt.xlabel('readability')

 浙公网安备 33010602011771号