大作业:电商销售商品数据可视化
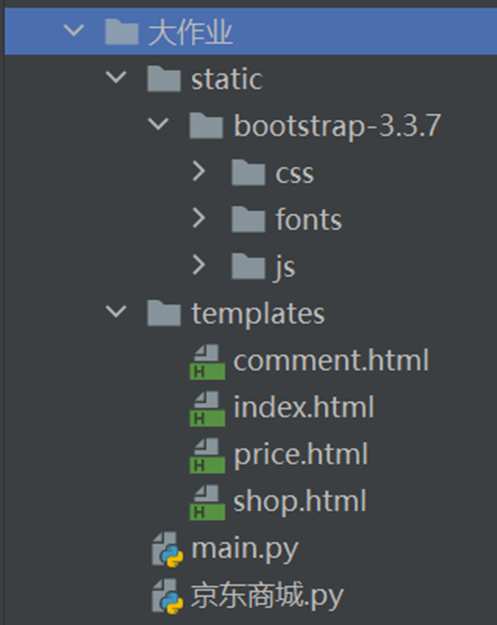
1. 目录结构
2. 京东商城.py
import requests
from lxml import html
import pymysql
import time
import random
# # 不显示警告信息
# from requests.packages.urllib3.exceptions import InsecureRequestWarning
# # 禁用安全请求警告
# requests.packages.urllib3.disable_warnings(InsecureRequestWarning)

kw = input('请输入一个关键词:')
name_list = []  # 商品名称列表
price_list = []  # 价格列表
shop_list = []  # 店铺列表
img_list = []  # 图片列表
# address_list = []
#         net_content = dict1.get('净含量')
#         pakage_form = dict1.get('包装形式')
#         flavor = dict1.get('口味')
s = 0
# 获取数据库连接
conn = pymysql.connect(host='localhost', port=3306, user='root', passwd='你的密码', db='shop', charset='utf8')
# 获取数据库游标
cur = conn.cursor()
for i in range(0, 10):
    print(f'开始爬取第{i + 1}页')
    page = i * 2 + 1
    if page == 1:
        s = 1
    elif page == 2:
        s = 56
    else:
        s += 60
    # 京东商品第一页
    url = f'https://search.jd.com/Search?keyword={kw}&page={page}&s={s}'
    headers = {
        'User-Agent': 'Mozilla/5.0 (Windows NT 10.0; Win64; x64) AppleWebKit/537.36 (KHTML, like Gecko) Chrome/106.0.0.0 Safari/537.36'
    }
    response = requests.get(url, headers=headers)
    time.sleep(5 + random.random() * 3)  # 设置访问网址间隔时间
    page_text = response.text
    # print(page_text)
    etree = html.etree
    tree = etree.HTML(page_text)
    # 获取所有的商品
    li_list = tree.xpath('//li[@class="gl-item"]')
    # print(li_list)
    # 遍历
    for li in li_list:
        # 取商品ID
        goods_id = li.xpath('./@data-sku')[0]
        # print(goods_id)
        # 取li中的第一层div
        first_div = li.xpath('./div[@class="gl-i-wrap"]')[0]
        # print(first_div)

        # 取商品名称
        name = first_div.xpath('./div[@class="p-name p-name-type-2"]/a/em/text()')[0]
        # print(name)
        # 去除前后空格和换行
        name = name.replace('""', '').replace('\n', '').strip()
        # print(name)
        # 取价格
        price = first_div.xpath('./div[@class="p-price"]/strong/i/text()')[0]
        # print(price)
        # 取店铺名称
        shop = first_div.xpath('./div[@class="p-shop"]/span/a/text()')
        # 如果没有店铺,设置为空
        if len(shop) != 0:
            shop = shop[0]
        else:
            shop = ''
        # print(shop)
        # 商品详情页获取图片地址
        img = 'https:' + first_div.xpath('./div[@class="p-img"]/a/img/@data-lazy-img')[0]
        # print(img)
        # 详情页地址
        detail_url = 'http:' + first_div.xpath('./div[@class="p-name p-name-type-2"]/a/@href')[0]
        # print(detail_url)
        page = requests.get(detail_url,headers=headers).text
        time.sleep(5 + random.random() * 3)  # 设置访问网址间隔时间
        # print(page)
        etree = html.etree
        tree = etree.HTML(page)
        li_list = tree.xpath('//ul[@class="parameter2 p-parameter-list"]/li/text()')
        # print(li_list)
        dict1 = {}
        for li in li_list:
            spt = li.split(':')
            if len(spt) == 2:
                dict1[spt[0]] = spt[1]
        # print(dict1)

        address = dict1.get('商品产地')
        if address is None:
            address = "无"
        net_content = dict1.get('净含量')
        if net_content is None:
            net_content = "无"
        pakage_form = dict1.get('包装形式')
        if pakage_form is None:
            pakage_form = "无"
        flavor = dict1.get('口味')
        if flavor is None:
            flavor = "无"
        # 把每个商品的名称,价格,店铺,图片存入列表中
        name_list.append(name)
        price_list.append(price)
        shop_list.append(shop)
        img_list.append(img)
        # 插入数据库
        try:
            # 定义SQL语句
            sql = "insert into goods(name,price,shop,photo,goods_id,address,net_content,pakage_form,flavor) values(%s,%s,%s,%s,%s,%s,%s,%s,%s)"
            # 设置sql语句values中参数的值
            val = (name, price, shop, img, goods_id,address,net_content,pakage_form,flavor)
            # 执行sql语句
            cur.execute(sql, val)
            # 提交
            conn.commit()
            print('插入成功')
        except Exception as e:
            print(e)
        # 爬取此商品评论汇总
        url = f'https://club.jd.com/comment/productPageComments.action?productId={goods_id}&score=0&sortType=5&page=0&pageSize=10&isShadowSku=0&rid=0&fold=1'
        page = requests.get(url, headers=headers).json()
        time.sleep(5 + random.random() * 3)  # 设置访问网址间隔时间
        # print(page)
        # 取汇总信息的JSON
        summary = page['productCommentSummary']
        # 取1-5星的评论人数
        score1Count = summary['score1Count']
        score2Count = summary['score2Count']
        score3Count = summary['score3Count']
        score4Count = summary['score4Count']
        score5Count = summary['score5Count']
        # print(score1Count, score2Count, score3Count, score4Count, score5Count)
        # 计算差评、中评、好评的人数
        poorCount = score1Count
        generalCount = score2Count + score3Count
        goodCount = score4Count + score5Count
        # 插入数据库
        try:
            # 定义SQL语句
            sql = "insert into comment_summary(goods_id,score1_count,score2_count,score3_count,score4_count,score5_count,poor_count,general_count,good_count) values(%s,%s,%s,%s,%s,%s,%s,%s,%s)"
            # 设置sql语句values中参数的值
            val = (goods_id, score1Count, score2Count, score3Count, score4Count, score5Count, poorCount, generalCount, goodCount)
            # 执行sql语句
            cur.execute(sql, val)
            # 提交
            conn.commit()
            print('插入成功')
        except Exception as e:
            print(e)

# 创建字典数据
dict = {}
dict['商品名称'] = name_list
dict['价格'] = price_list
dict['店铺'] = shop_list
dict['图片'] = img_list
# print(dict)
# 构造DataFrame
import pandas as pd

df = pd.DataFrame(dict)
# print(df)
df.to_excel(f'京东{kw}商品信息.xlsx', index=False)
print('保存成功')
获取数据库连接和sql语句中要根据自己的mysql的密码、表名来修改
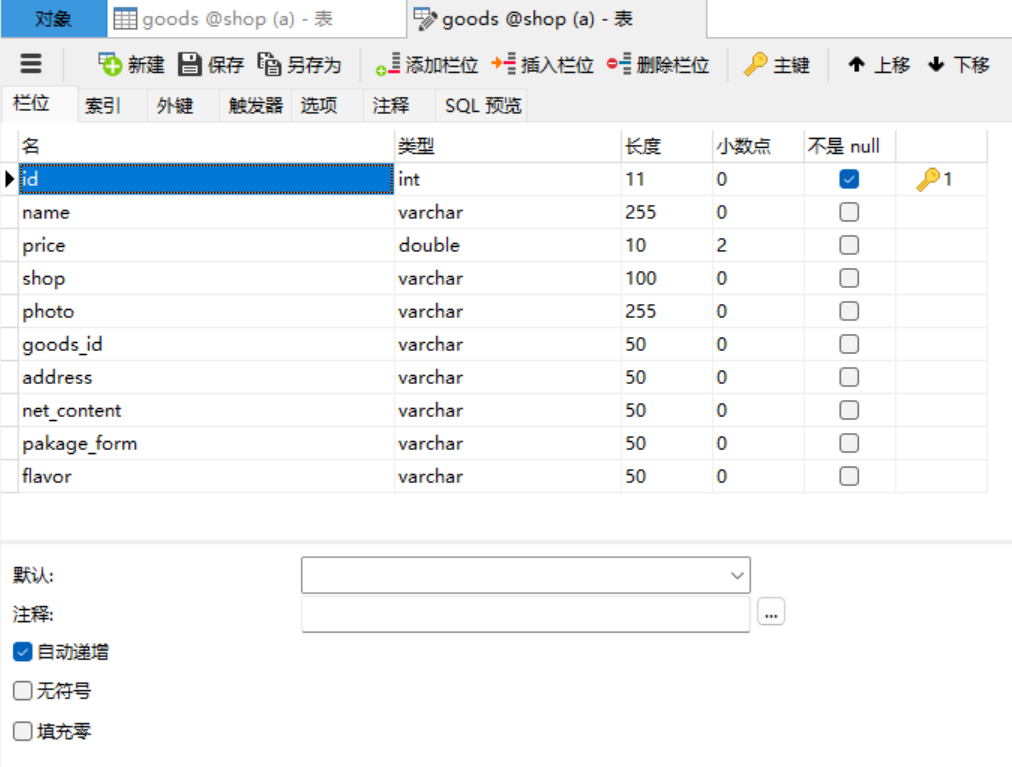
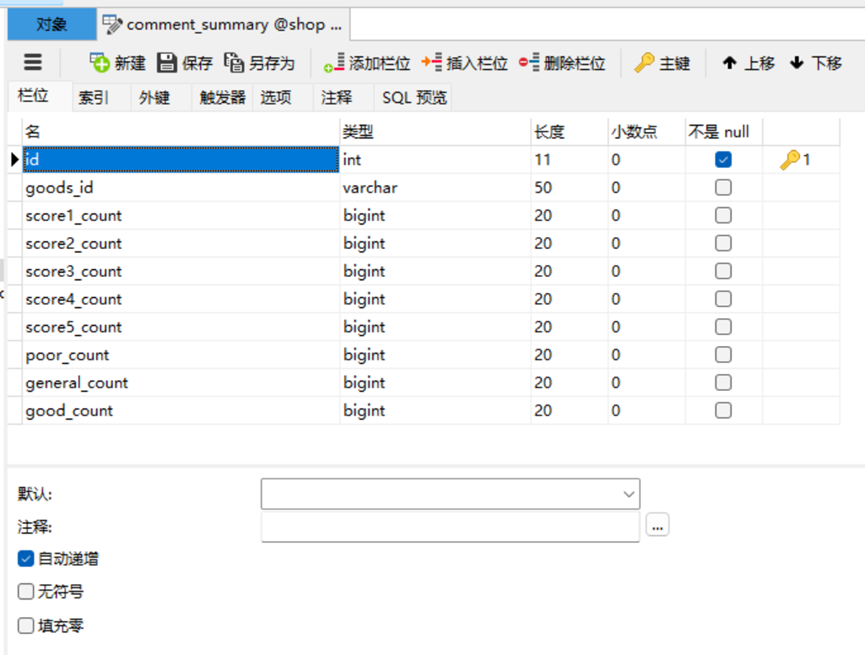
表结构如下:
goods表
comment_summary表
3. main.py
# 渲染模板render_template
from flask import Flask, render_template, request, Response
import pymysql

app = Flask(__name__)


# 首页
@app.route('/')
def index():
    # 取所有的商品信息
    # 存储的数据类型:每一条记录是一个字典,所有的记录存入列表
    list = []
    conn = pymysql.connect(host='localhost', port=3306, user='root', passwd='你的密码', db='shop', charset='utf8')
    sql = 'select id,name,price,shop,photo,goods_id,address,net_content,pakage_form,flavor from goods'
    cur = conn.cursor()
    # 执行SQL
    cur.execute(sql)
    # 取查询出的数据
    rs = cur.fetchall()
    # 遍历查询的数据
    for row in rs:
        # 定久字典,存放每一条记录
        dict = {}
        dict['id'] = row[0]
        dict['name'] = row[1]
        dict['price'] = row[2]
        dict['shop'] = row[3]
        dict['photo'] = row[4]
        dict['goodsId'] = row[5]
        dict['address'] = row[6]
        dict['net_content'] = row[7]
        dict['pakage_form'] = row[8]
        dict['flavor'] = row[9]
        # 把字典(每一条记录)存入列表
        list.append(dict)
    cur.close()
    conn.close()
    # print(list)
    return render_template("index.html", list=list)


# 统计商品价格前15的商品和价格
@app.route('/price')
def chart_price():
    conn = pymysql.connect(host='localhost', port=3306, user='root', passwd='你的密码', db='shop', charset='utf8')
    sql = 'select name,price from goods order by price desc limit 15'
    cur = conn.cursor()
    # 执行SQL
    cur.execute(sql)
    # 取查询出的数据
    rs = cur.fetchall()
    name = []  # 商品名称列表(x轴数据)
    price = []  # 价格列表(y轴的数据)
    for row in rs:
        name.append(row[0][:8])
        price.append(row[1])
    cur.close()
    conn.close()
    # print(list)
    return render_template("price.html", name=name, price=price)


# 统计在售商品最多的店铺前5名
@app.route("/shop")
def shop():
    conn = pymysql.connect(host='localhost', port=3306, user='root', passwd='你的密码', db='shop', charset='utf8')
    sql = 'select shop,count(*) num from goods group by shop order by num desc limit 5'
    cur = conn.cursor()
    # 执行SQL
    cur.execute(sql)
    # 取查询出的数据
    rs = cur.fetchall()
    name = []  # 店铺名称列表(x轴数据)
    num = []  # 价格列表(y轴的数据)
    for row in rs:
        name.append(row[0][:8])
        num.append(row[1])
    cur.close()
    conn.close()
    # print(list)
    return render_template("shop.html", name=name, num=num)


# 统计全部商品的评论
@app.route("/comment")
def comment():
    conn = pymysql.connect(host='localhost', port=3306, user='root', passwd='你的密码', db='shop', charset='utf8')
    sql = 'select sum(good_count),sum(general_count),sum(poor_count) from comment_summary'
    cur = conn.cursor()
    # 执行SQL
    cur.execute(sql)
    # 取查询出的数据
    rs = cur.fetchall()
    data = []
    for row in rs:
        dict = {}
        dict['name'] = '好评'
        dict['value'] = row[0]
        data.append(dict)

        dict = {}
        dict['name'] = '中评'
        dict['value'] = row[1]
        data.append(dict)

        dict = {}
        dict['name'] = '差评'
        dict['value'] = row[2]
        data.append(dict)

    cur.close()
    conn.close()
    # print(data)
    return render_template("comment.html", data=data)


if __name__ == '__main__':
    app.run(debug=True)
数据库密码passwd要根据自己的密码设置
4. index.html
<!DOCTYPE html> <html lang="en"> <head> <meta charset="UTF-8"> <title>Title</title> <!-- 新 Bootstrap 核心 CSS 文件 --> <link rel="stylesheet" href="{{ url_for('static', filename = 'bootstrap-3.3.7/css/bootstrap.css') }}"> <!-- background-color: #00cccc;--> <style> * { margin: 0; padding: 0; } nav { height: 80px; background-color: #ff00ff; color: #fff; } nav ul { list-style: none; } nav ul li { float: left; width: 300px; line-height: 80px; /** 行高和高一样,垂直居中*/ text-align: center; } nav ul li a { display: inline-block; /** 行内块,按块级元素显示(可以设置宽和高)*/ width: 100%; color: #000; text-decoration: none; } nav ul li a:hover { background-color: #b2ff66; color: #000; text-decoration: none; } nav ul li .active { background-color: #b2ff66; } .thumbnail { height: 300px; padding: 10px; } .title { font-size: 16px; font-weight: bold; } .price { color: #e01222; } </style> </head> <body> <nav> <ul> <li><a href="/" class="active">首页</a></li> <li><a href="/price">价格排行</a></li> <li><a href="/shop">店铺排行</a></li> <li><a href="/comment">商品评价</a></li> </ul> </nav> <div> <div class="row" style="text-align: center;margin:10px 0;"> {% for item in list %} <div class="col-md-3" style="margin: 5px 0;"> <img src="{{item.photo}}" width="220" height="220"> <div> <!-- 文字超出用省略号...鼠标悬停显示全部文字--> <p><h3 class="title" title='{{item.name}}'>{{item.name | truncate(15,true)}}</h3></p> <p>商品产地:{{item.address}}    净含量:{{item.net_content}}</p> <p>包装形式:{{item.pakage_form}}    口味:{{item.flavor}}</p> <p class="price">¥{{item.price}}</p> <p>{{item.shop}}</p> </div> </div> {% endfor %} </div> </div> </body> </html>
5. price.html
<!DOCTYPE html>
<html lang="en">
<head>
    <meta charset="UTF-8">
    <title>Title</title>
    <script src="https://cdn.bootcdn.net/ajax/libs/echarts/5.1.2/echarts.min.js"></script>
<!--     background-color: #00cccc;-->
    <style>
        * {
            margin: 0;
            padding: 0;
        }
        nav {
            height: 80px;
            background-color: #ff00ff;
            color: #fff;
        }

        nav ul {
            list-style: none;
        }

        nav ul li {
            float: left;
            width: 300px;
            line-height: 80px; /** 行高和高一样,垂直居中*/
            text-align: center;
        }

        nav ul li a {
            display: inline-block; /** 行内块,按块级元素显示(可以设置宽和高)*/
            width: 100%;
            color: #000;
            text-decoration: none;
        }

        nav ul li a:hover {
            background-color: #b2ff66;
            color: #000;
            text-decoration: none;
        }

        nav ul li .active {
            background-color: #b2ff66;
        }


    </style>
</head>
<body>
    <nav>
        <ul>
            <li><a href="/" >首页</a></li>
            <li><a href="/price" class="active">价格排行</a></li>
            <li><a href="/shop">店铺排行</a></li>
            <li><a href="/comment">商品评价</a></li>
        </ul>
    </nav>
     <!-- 为ECharts准备一个具备大小(宽度)的DOM -->
    <div id="main" style="width:1000px;height:600px;"></div>
</body>
<script type="text/javascript">
    //基于准备好的DOM,初始化echarts实例
    var myChart = echarts.init(document.getElementById("main"));
    //指定图表配置项和数据
    var option = {
        //标题
        title:{
            //text: '商品价格排行榜Top10',
            text: '商品价格排行榜Top15',
            left:'center',//距离左边的像素值
            borderColor:'red',
            borderWidth:5

        },
        //x轴
        xAxis:{
            name: '商品',
            data:{{ name|tojson }},
            axisLabel: {
                interval: 0,
                rotate: 40
            }
        },
        //y轴
        yAxis:{
            name: '价格'
        },
        //数据
        series:{
            name:'价格',
            label: {
                show: true,
                position: 'top'
            },
            type:'bar',//柱状图
            showBackground: true,
            data:{{ price|tojson }}
        },
    };
    myChart.setOption(option);

</script>
</html>
6. shop.html
<!DOCTYPE html>
<html lang="en">
<head>
    <meta charset="UTF-8">
    <title>Title</title>
    <script src="https://cdn.bootcdn.net/ajax/libs/echarts/5.1.2/echarts.min.js"></script>
<!--     background-color: #00cccc;-->
    <style>
        * {
            margin: 0;
            padding: 0;
        }
        nav {
            height: 80px;
            background-color: #ff00ff;
            color: #fff;
        }

        nav ul {
            list-style: none;
        }

        nav ul li {
            float: left;
            width: 300px;
            line-height: 80px; /** 行高和高一样,垂直居中*/
            text-align: center;
        }

        nav ul li a {
            display: inline-block; /** 行内块,按块级元素显示(可以设置宽和高)*/
            width: 100%;
            color: #000;
            text-decoration: none;
        }

        nav ul li a:hover {
            background-color: #b2ff66;
            color: #000;
            text-decoration: none;
        }

        nav ul li .active {
            background-color: #b2ff66;
        }

    </style>
</head>
<body>
    <nav>
        <ul>
            <li><a href="/" >首页</a></li>
            <li><a href="/price" >价格排行</a></li>
            <li><a href="/shop" class="active">店铺排行</a></li>
            <li><a href="/comment">商品评价</a></li>
        </ul>
    </nav>
     <!-- 为ECharts准备一个具备大小(宽度)的DOM -->
    <div id="main" style="width:1000px;height:600px;"></div>
</body>
<script type="text/javascript">
    //基于准备好的DOM,初始化echarts实例
    var myChart = echarts.init(document.getElementById("main"));
    //指定图表配置项和数据
    var option;
    option = {
      //标题
        title:{
            text: '店铺在售商品排行榜Top5',
            left:'center',//距离左边的像素值
            borderColor:'red',
            borderWidth:5
        },
      polar: {
        radius: [30, '80%']
      },
      radiusAxis: {
         name: '种类/种',
        max: {{ num[0]+5}}
      },
      angleAxis: {
        type: 'category',
        data: {{ name|tojson }},
        startAngle: 75
      },
      tooltip: {},
      series: {
        type: 'bar',
        data: {{ num|tojson }},
        coordinateSystem: 'polar',
        label: {
          show: true,
          position: 'middle',
          formatter: '{b}: {c}'
        }
      },
      animation: false
    };
    myChart.setOption(option);

</script>
</html>
7. commemt.html
<!DOCTYPE html>
<html lang="en">
<head>
    <meta charset="UTF-8">
    <title>Title</title>
    <script src="https://cdn.bootcdn.net/ajax/libs/echarts/5.1.2/echarts.min.js"></script>
<!--     background-color: #00cccc;-->
    <style>
        * {
            margin: 0;
            padding: 0;
        }
        nav {
            height: 80px;
            background-color: #ff00ff;
            color: #fff;
        }

        nav ul {
            list-style: none;
        }

        nav ul li {
            float: left;
            width: 300px;
            line-height: 80px; /** 行高和高一样,垂直居中*/
            text-align: center;
        }

        nav ul li a {
            display: inline-block; /** 行内块,按块级元素显示(可以设置宽和高)*/
            width: 100%;
            color: #000;
            text-decoration: none;
        }

        nav ul li a:hover {
            background-color: #b2ff66;
            color: #000;
            text-decoration: none;
        }

        nav ul li .active {
            background-color: #b2ff66;
        }

    </style>
</head>
<body>
    <nav>
        <ul>
            <li><a href="/" >首页</a></li>
            <li><a href="/price" >价格排行</a></li>
            <li><a href="/shop" >店铺排行</a></li>
            <li><a href="/comment" class="active">商品评价</a></li>
        </ul>
    </nav>
     <!-- 为ECharts准备一个具备大小(宽度)的DOM -->
    <div id="main" style="width:1000px;height:600px;"></div>
</body>
<script type="text/javascript">
    //基于准备好的DOM,初始化echarts实例
    var myChart = echarts.init(document.getElementById("main"));
    option = {
      title:{
        text: '商品评价',
        left:'center',//距离左边的像素值
        borderColor:'red',
        borderWidth:5
      },
      tooltip: {//提示框组件
        trigger: 'item', //item数据项图形触发,主要在散点图,饼图等无类目轴的图表中使用。
        axisPointer: {
            // 坐标轴指示器,坐标轴触发有效
            type: 'shadow' // 默认为直线,可选为:'line' | 'shadow'
        },
        formatter: '{b}:{c}条</br> 占比:{d}%' //{a}(系列名称),{b}(数据项名称),{c}(数值), {d}(百分比)
      },
      legend: {
        top: '5%',
        left: 'center'
      },
      itemStyle: {
        borderRadius: 30,
        borderColor: '#fff',
        borderWidth: 5
      },
      series: [
        {
          name: '评价数量',
          type: 'pie',
          radius: ['50%','70%'],
          data: {{data|tojson}},
          emphasis: {
            itemStyle: {
              shadowBlur: 10,
              shadowOffsetX: 0,
              shadowColor: 'rgba(0, 0, 0, 0.5)'
            }
          }
        }
      ]
    };
    myChart.setOption(option);

</script>
</html>

 浙公网安备 33010602011771号