作业三: 58同城二手房数据可视化
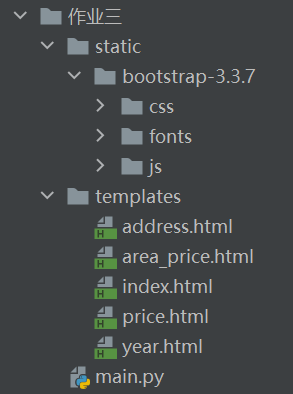
1. 目录结构
2. main.py
# 渲染模板render_template
from flask import Flask, render_template, request, Response
import pymysql

app = Flask(__name__)


# 首页
@app.route('/')
def index():
    # 取所有的二手房信息
    # 存储的数据类型:每一条记录是一个字典,所有的记录存入列表
    list = []
    conn = pymysql.connect(host='localhost', port=3306, user='root', passwd='你的密码', db='58city', charset='utf8')
    sql = 'select id,name,house_type,area,address,price,photo,year from second_hand_house'
    cur = conn.cursor()
    # 执行SQL
    cur.execute(sql)
    # 取查询出的数据
    rs = cur.fetchall()
    # 遍历查询的数据
    for row in rs:
        # 定义字典,存放每一条记录
        dict = {}
        dict['id'] = row[0]
        dict['name'] = row[1]
        dict['house_type'] = row[2]
        dict['area'] = row[3]
        dict['address'] = row[4]
        dict['price'] = row[5]
        dict['photo'] = row[6]
        dict['year'] = row[7]
        # 把字典(每一条记录)存入列表
        list.append(dict)
    cur.close()
    conn.close()
    # print(list)
    return render_template("index.html", list=list)


# 统计最贵二手房价格
@app.route('/price')
def chart_price():
    conn = pymysql.connect(host='localhost', port=3306, user='root', passwd='你的密码', db='58city', charset='utf8')
    sql = 'select name,price from second_hand_house order by price desc limit 20'
    cur = conn.cursor()
    # 执行SQL
    cur.execute(sql)
    # 取查询出的数据
    rs = cur.fetchall()
    name = []  # 二手房名称列表(x轴数据)
    price = []  # 价格列表(y轴的数据)
    for row in rs:
        name.append(row[0][:8])
        price.append(row[1])
    cur.close()
    conn.close()
    # print(list)
    return render_template("price.html", name=name, price=price)


# 二手房按建造年份统计
@app.route("/year")
def year():
    conn = pymysql.connect(host='localhost', port=3306, user='root', passwd='你的密码', db='58city', charset='utf8')
    sql = 'select year,count(*) num from second_hand_house where year!=0 group by year order by year'
    cur = conn.cursor()
    # 执行SQL
    cur.execute(sql)
    # 取查询出的数据
    rs = cur.fetchall()
    year = []  # 建造年份列表(x轴数据)
    num = []  # 数量列表(y轴的数据)
    last_year = rs[0][0]-1
    print(last_year)
    for row in rs:
        if row[0]==last_year+1:
            year.append(row[0])
            num.append(row[1])
            last_year = row[0]
        else :
            for i in range(last_year+1,row[0]):
                year.append(i)
                num.append(0)
            year.append(row[0])
            num.append(row[1])
            last_year = row[0]
    cur.close()
    conn.close()
    # print(list)
    return render_template("year.html", year=year, num=num)


# 统计二手房数量最多的地址
@app.route("/address")
def address():
    conn = pymysql.connect(host='localhost', port=3306, user='root', passwd='你的密码', db='58city', charset='utf8')
    sql = 'select address,count(*) num from second_hand_house group by address order by num desc limit 5'
    cur = conn.cursor()
    # 执行SQL
    cur.execute(sql)
    # 取查询出的数据
    rs = cur.fetchall()
    address = []  # 地址列表(x轴数据)
    num = []  # 数量列表(y轴的数据)
    for row in rs:
        address.append(row[0])
        num.append(row[1])
    cur.close()
    conn.close()
    # print(address)
    # print(num)
    return render_template("address.html", address=address, num=num)


@app.route("/area_price")
def area_price():
    conn = pymysql.connect(host='localhost', port=3306, user='root', passwd='你的密码', db='58city', charset='utf8')
    sql = 'select area,price from second_hand_house'
    cur = conn.cursor()
    # 执行SQL
    cur.execute(sql)
    # 取查询出的数据
    rs = cur.fetchall()
    data = []
    for row in rs:
        area__price = [row[0], row[1]]
        data.append(area__price)
    cur.close()
    conn.close()
    # print(area)
    # print(data)
    return render_template("area_price.html", data=data)


if __name__ == '__main__':
    app.run(debug=True)
数据库密码passwd要根据自己的密码设置
3. index.html
<!DOCTYPE html> <html lang="en"> <head> <meta charset="UTF-8"> <title>Title</title> <!-- 新 Bootstrap 核心 CSS 文件 --> <link rel="stylesheet" href="{{ url_for('static', filename = 'bootstrap-3.3.7/css/bootstrap.css') }}"> <style> * { margin: 0; padding: 0; } nav { height: 80px; background-color: #00cccc; color: #fff; } nav ul { list-style: none; } nav ul li { float: left; width: 200px; line-height: 80px; /** 行高和高一样,垂直居中*/ text-align: center; } nav ul li a { display: inline-block; /** 行内块,按块级元素显示(可以设置宽和高)*/ width: 100%; color: #000; text-decoration: none; } nav ul li a:hover { background-color: #b2ff66; color: #000; text-decoration: none; } nav ul li .active { background-color: #b2ff66; } .thumbnail { height: 300px; padding: 10px; } .title { font-size: 16px; font-weight: bold; } .price { color: #e01222; } </style> </head> <body> <nav> <ul> <li><a href="/" class="active">首页</a></li> <li><a href="/price" >价格排行</a></li> <li><a href="/year">建造年份统计</a></li> <li><a href="/address">地址统计</a></li> <li><a href="/area_price">面积与价格关系</a></li> </ul> </nav> <div> <div class="row" style="text-align: center;margin:10px 0;"> {% for item in list %} <div class="col-md-3" style="margin: 5px 0;"> <img src="{{item.photo}}" width="280" height="228"> <div> <!-- 文字超出用省略号...鼠标悬停显示全部文字--> <p><h3 class="title" title='{{item.name}}'>{{item.name | truncate(13,true)}}</h3></p> <p>{{item.house_type}}    {{item.year}}年建造</p> <!-- 文字超出用省略号...鼠标悬停显示全部文字--> <p title='{{item.address}}'>{{item.address | truncate(21,true)}}</p> <p class="price">¥{{item.price}}万    {{item.area}}㎡</p> </div> </div> {% endfor %} </div> </div> </body> </html>
4. price.html
<!DOCTYPE html>
<html lang="en">
<head>
    <meta charset="UTF-8">
    <title>Title</title>
    <script src="https://cdn.bootcdn.net/ajax/libs/echarts/5.1.2/echarts.min.js"></script>
     <style>
        * {
            margin: 0;
            padding: 0;
        }
        nav {
            height: 80px;
            background-color: #00cccc;
            color: #fff;
        }

        nav ul {
            list-style: none;
        }

        nav ul li {
            float: left;
            width: 200px;
            line-height: 80px; /** 行高和高一样,垂直居中*/
            text-align: center;
        }

        nav ul li a {
            display: inline-block; /** 行内块,按块级元素显示(可以设置宽和高)*/
            width: 100%;
            color: #000;
            text-decoration: none;
        }

        nav ul li a:hover {
            background-color: #b2ff66;
            color: #000;
            text-decoration: none;
        }

        nav ul li .active {
            background-color: #b2ff66;
        }

    </style>
</head>
<body>
    <nav>
        <ul>
            <li><a href="/" >首页</a></li>
            <li><a href="/price" class="active">价格排行</a></li>
            <li><a href="/year">建造年份统计</a></li>
            <li><a href="/address">地址统计</a></li>
            <li><a href="/area_price">面积与价格关系</a></li>
        </ul>
    </nav>
     <!-- 为ECharts准备一个具备大小(宽度)的DOM -->
    <div id="main" style="width:1000px;height:600px;"></div>
</body>
<script type="text/javascript">
    //基于准备好的DOM,初始化echarts实例
    var myChart = echarts.init(document.getElementById("main"));
    //指定图表配置项和数据
    var option = {
        //标题
        title:{
            text: '二手房价格排行榜Top20',
            left:400,//距离左边的像素值
            borderColor:'red',
            borderWidth:5

        },
        //x轴
        xAxis:{
            name: '二手房',
            data:{{ name|tojson }},
            //data:{{ name}},
            axisLabel: {
                interval: 0,
                rotate: 40
            }
        },
        //y轴
        yAxis:{
            name: '价格/万'
        },
        //数据
        series:{
            name:'价格',
            label: {
                show: true,
                position: 'top'
            },
            type:'bar',//柱状图
            showBackground: true,
            data:{{ price|tojson }}
            //data:{{ price}}
        },
    };
    myChart.setOption(option);

</script>
</html>
5. year.html
<!DOCTYPE html>
<html lang="en">
<head>
    <meta charset="UTF-8">
    <title>Title</title>
    <script src="https://cdn.bootcdn.net/ajax/libs/echarts/5.1.2/echarts.min.js"></script>
     <style>
        * {
            margin: 0;
            padding: 0;
        }
        nav {
            height: 80px;
            background-color: #00cccc;
            color: #fff;
        }

        nav ul {
            list-style: none;
        }

        nav ul li {
            float: left;
            width: 200px;
            line-height: 80px; /** 行高和高一样,垂直居中*/
            text-align: center;
        }

        nav ul li a {
            display: inline-block; /** 行内块,按块级元素显示(可以设置宽和高)*/
            width: 100%;
            color: #000;
            text-decoration: none;
        }

        nav ul li a:hover {
            background-color: #b2ff66;
            color: #000;
            text-decoration: none;
        }

        nav ul li .active {
            background-color: #b2ff66;
        }

    </style>
</head>
<body>
    <nav>
        <ul>
            <li><a href="/" >首页</a></li>
            <li><a href="/price" >价格排行</a></li>
            <li><a href="/year" class="active">建造年份排行</a></li>
            <li><a href="/address">地址统计</a></li>
            <li><a href="/area_price">面积与价格关系</a></li>
        </ul>
    </nav>
     <!-- 为ECharts准备一个具备大小(宽度)的DOM -->
    <div id="main" style="width:1000px;height:600px;"></div>
</body>
<script type="text/javascript">
    //基于准备好的DOM,初始化echarts实例
    var myChart = echarts.init(document.getElementById("main"));
    //指定图表配置项和数据
    var option;
     option = {
      title: {
        text: '二手房按建造年份统计平滑折线图',
        left: 400, //距离左边的像素值
        borderColor: 'red',
        borderWidth: 5
      },
      xAxis: {
        name:'建造时间/年',
        type: 'category',
        data: {{year|tojson}}
      },
      yAxis: {
        name:'数量/个',
        type: 'value'
      },
      tooltip: {//提示框组件
        trigger: 'item', //item数据项图形触发,主要在散点图,饼图等无类目轴的图表中使用。
        axisPointer: {
            // 坐标轴指示器,坐标轴触发有效
            type: 'shadow' // 默认为直线,可选为:'line' | 'shadow'
        },
        formatter: '坐标:({b},{c}) ' //{a}(系列名称),{b}(数据项名称),{c}(数值), {d}(百分比)
      },
      series: [
        {
          label: {
                show: true,
                position: 'top'
            },
          data: {{num|tojson}},
          type: 'line',
          smooth: true
        }
      ]
    };
    myChart.setOption(option);

</script>
</html>
6. address.html
<!DOCTYPE html>
<html lang="en">
<head>
    <meta charset="UTF-8">
    <title>Title</title>
    <script src="https://cdn.bootcdn.net/ajax/libs/echarts/5.1.2/echarts.min.js"></script>
     <style>
        * {
            margin: 0;
            padding: 0;
        }
        nav {
            height: 80px;
            background-color: #00cccc;
            color: #fff;
        }

        nav ul {
            list-style: none;
        }

        nav ul li {
            float: left;
            width: 200px;
            line-height: 80px; /** 行高和高一样,垂直居中*/
            text-align: center;
        }

        nav ul li a {
            display: inline-block; /** 行内块,按块级元素显示(可以设置宽和高)*/
            width: 100%;
            color: #000;
            text-decoration: none;
        }

        nav ul li a:hover {
            background-color: #b2ff66;
            color: #000;
            text-decoration: none;
        }

        nav ul li .active {
            background-color: #b2ff66;
        }

    </style>
</head>
<body>
    <nav>
        <ul>
            <li><a href="/" >首页</a></li>
            <li><a href="/price" >价格排行</a></li>
            <li><a href="/year" >建造年份统计</a></li>
            <li><a href="/address" class="active">地址统计</a></li>
            <li><a href="/area_price">面积与价格关系</a></li>
        </ul>
    </nav>
     <!-- 为ECharts准备一个具备大小(宽度)的DOM -->
    <div id="main" style="width:1000px;height:600px;"></div>
</body>
<script type="text/javascript">
    //基于准备好的DOM,初始化echarts实例
    var myChart = echarts.init(document.getElementById("main"));
    //指定图表配置项和数据

    var option;

    option = {
      title: [
        {
            text: '二手房数量最多的地址排行榜Top5',
            left:380,//距离左边的像素值
            borderColor:'red',
            borderWidth:5
        }
      ],
      polar: {
        radius: [30, '80%']
      },
      radiusAxis: {
         name: '数量/个',
        max: {{ num[0]+5}}
      },
      angleAxis: {
        type: 'category',
        data: {{ address|tojson }},
        startAngle: 75
      },
      tooltip: {},
      series: {
        type: 'bar',
        data: {{ num|tojson }},
        coordinateSystem: 'polar',
        label: {
          show: true,
          position: 'middle',
          formatter: '{b}: {c}'
        }
      },
      animation: false
    };

    myChart.setOption(option);

</script>
</html>
7. area_price.html
<!DOCTYPE html>
<html lang="en">
<head>
    <meta charset="UTF-8">
    <title>Title</title>
    <script src="https://cdn.bootcdn.net/ajax/libs/echarts/5.1.2/echarts.min.js"></script>
     <style>
        * {
            margin: 0;
            padding: 0;
        }
        nav {
            height: 80px;
            background-color: #00cccc;
            color: #fff;
        }

        nav ul {
            list-style: none;
        }

        nav ul li {
            float: left;
            width: 200px;
            line-height: 80px; /** 行高和高一样,垂直居中*/
            text-align: center;
        }

        nav ul li a {
            display: inline-block; /** 行内块,按块级元素显示(可以设置宽和高)*/
            width: 100%;
            color: #000;
            text-decoration: none;
        }

        nav ul li a:hover {
            background-color: #b2ff66;
            color: #000;
            text-decoration: none;
        }

        nav ul li .active {
            background-color: #b2ff66;
        }

    </style>
</head>
<body>
    <nav>
        <ul>
            <li><a href="/" >首页</a></li>
            <li><a href="/price" >价格排行</a></li>
            <li><a href="/year" >建造年份统计</a></li>
            <li><a href="/address">地址统计</a></li>
            <li><a href="/area_price" class="active">面积与价格关系</a></li>
        </ul>
    </nav>
     <!-- 为ECharts准备一个具备大小(宽度)的DOM -->
    <div id="main" style="width:1000px;height:600px;"></div>
</body>
<script type="text/javascript">
    //基于准备好的DOM,初始化echarts实例
    var myChart = echarts.init(document.getElementById("main"));
    var option;

    option = {
      title: {
        text: '二手房面积与价格关系散点图',
        left: 400, //距离左边的像素值
        borderColor: 'red',
        borderWidth: 5
      },
      xAxis: { name: '面积/㎡' },
      yAxis: {name: '价格/万'},
      tooltip: {//提示框组件
        trigger: 'item', //item数据项图形触发,主要在散点图,饼图等无类目轴的图表中使用。
        axisPointer: {
            // 坐标轴指示器,坐标轴触发有效
            type: 'shadow' // 默认为直线,可选为:'line' | 'shadow'
        },
        formatter: '坐标:({c}) ' //{a}(系列名称),{b}(数据项名称),{c}(数值), {d}(百分比)
      },
      series: [
        {
          symbolSize: 10,
          data: {{data}},
          type: 'scatter'
        }
      ]
    };

    option && myChart.setOption(option);

</script>
</html>

 浙公网安备 33010602011771号