
ELK(elasticsearch-7.17.4-windows-x86_64+logstash-7.17.4-windows-x86_64+kibana-7.17.4-windows-x86_64)具体使用案例
1、下载ELK(elasticsearch-7.17.4-windows-x86_64+logstash-7.17.4-windows-x86_64+kibana-7.17.4-windows-x86_64)
2、解压elasticsearch-7.17.4-windows-x86_64,config目录下修改elasticsearch.yml文件,修改elasticsearch.yml内容如下:
# ======================== Elasticsearch Configuration =========================
#
# NOTE: Elasticsearch comes with reasonable defaults for most settings.
#       Before you set out to tweak and tune the configuration, make sure you
#       understand what are you trying to accomplish and the consequences.
#
# The primary way of configuring a node is via this file. This template lists
# the most important settings you may want to configure for a production cluster.
#
# Please consult the documentation for further information on configuration options:
# https://www.elastic.co/guide/en/elasticsearch/reference/index.html
#
# ---------------------------------- Cluster -----------------------------------
#
# Use a descriptive name for your cluster:
#集群名称(按实际需要配置名称)
cluster.name: lj-application
#
# ------------------------------------ Node ------------------------------------
#
# Use a descriptive name for the node:
#节点名称
node.name: node-1
#
# Add custom attributes to the node:
#
#node.attr.rack: r1
#
# ----------------------------------- Paths ------------------------------------
#
# Path to directory where to store the data (separate multiple locations by comma):
#数据路径(按实际需要配置日志地址)
#path.data: /path/to/data
path.data: D:\Temp\ELK\elasticsearch-7.17.4-windows-x86_64\elasticsearch-7.17.4\data
#
# Path to log files:
#
#path.logs: /path/to/logs
path.logs: D:\Temp\ELK\elasticsearch-7.17.4-windows-x86_64\elasticsearch-7.17.4\logs
#
# ----------------------------------- Memory -----------------------------------
#
# Lock the memory on startup:
#
#bootstrap.memory_lock: true
#
# Make sure that the heap size is set to about half the memory available
# on the system and that the owner of the process is allowed to use this
# limit.
#
# Elasticsearch performs poorly when the system is swapping the memory.
#
# ---------------------------------- Network -----------------------------------
#
# By default Elasticsearch is only accessible on localhost. Set a different
# address here to expose this node on the network:
#
#network.host: 192.168.0.1
#地址(通常使用内网进行配置)
network.host: 0.0.0.0
#
# By default Elasticsearch listens for HTTP traffic on the first free port it
# finds starting at 9200. Set a specific HTTP port here:
#
#http.port: 9200
#端口号
http.port: 9200
#默认对外端口,ES 进行集群间通信与数据传输的端口,请确保这两个端口没有被占用
transport.port: 9300
#
# For more information, consult the network module documentation.
#
# --------------------------------- Discovery ----------------------------------
#
# Pass an initial list of hosts to perform discovery when this node is started:
# The default list of hosts is ["127.0.0.1", "[::1]"]
#
#discovery.seed_hosts: ["host1", "host2"]
#节点地址
discovery.seed_hosts: ["127.0.0.1", "[::1]"]
#
# Bootstrap the cluster using an initial set of master-eligible nodes:
#
#cluster.initial_master_nodes: ["node-1", "node-2"]
#集群master
cluster.initial_master_nodes: ["node-1"]
#
# For more information, consult the discovery and cluster formation module documentation.
#
# ---------------------------------- Various -----------------------------------
#
# Require explicit names when deleting indices:
#
#action.destructive_requires_name: true
#
# ---------------------------------- Security ----------------------------------
#
#                                 *** WARNING ***
#
# Elasticsearch security features are not enabled by default.
# These features are free, but require configuration changes to enable them.
# This means that users don’t have to provide credentials and can get full access
# to the cluster. Network connections are also not encrypted.
#
# To protect your data, we strongly encourage you to enable the Elasticsearch security features.
# Refer to the following documentation for instructions.
#
# https://www.elastic.co/guide/en/elasticsearch/reference/7.16/configuring-stack-security.html
#跨域(这两项配置手动添加一下)
http.cors.enabled: true
http.cors.allow-origin: "*"
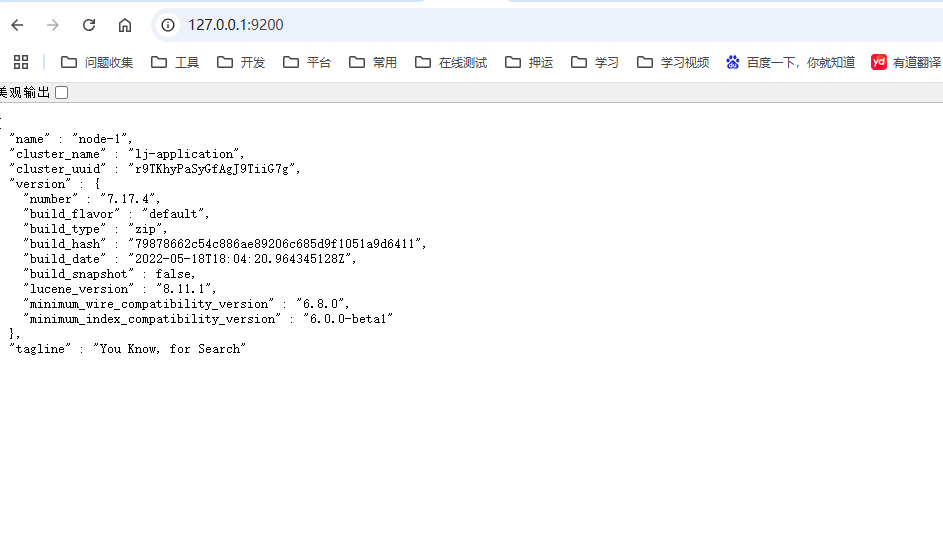
启动 bin目录下,elasticsearch.bat即可,运行成功如下:
3、解压logstash-7.17.4-windows-x86_64,config目录下修改logstash.yml文件,修改logstash.yml内容如下,加载其他配置文件,可以配置来自filebeat文件,mysql数据库,packetbeat网络,windowlogbeat事件日志,auditbeat审计数据,指标数据metricbeat等beats
# Settings file in YAML
#
# Settings can be specified either in hierarchical form, e.g.:
#
#   pipeline:
#     batch:
#       size: 125
#       delay: 5
#
# Or as flat keys:
#
#   pipeline.batch.size: 125
#   pipeline.batch.delay: 5
#
# ------------  Node identity ------------
#
# Use a descriptive name for the node:
#
# node.name: test
#
# If omitted the node name will default to the machine's host name
#
# ------------ Data path ------------------
#
# Which directory should be used by logstash and its plugins
# for any persistent needs. Defaults to LOGSTASH_HOME/data
#
# path.data:
#
# ------------ Pipeline Settings --------------
#
# The ID of the pipeline.
#
# pipeline.id: main
#
# Set the number of workers that will, in parallel, execute the filters+outputs
# stage of the pipeline.
#
# This defaults to the number of the host's CPU cores.
#
# pipeline.workers: 2
#
# How many events to retrieve from inputs before sending to filters+workers
#
# pipeline.batch.size: 125
#
# How long to wait in milliseconds while polling for the next event
# before dispatching an undersized batch to filters+outputs
#
# pipeline.batch.delay: 50
#
# Force Logstash to exit during shutdown even if there are still inflight
# events in memory. By default, logstash will refuse to quit until all
# received events have been pushed to the outputs.
#
# WARNING: enabling this can lead to data loss during shutdown
#
# pipeline.unsafe_shutdown: false
#
# Set the pipeline event ordering. Options are "auto" (the default), "true" or "false".
# "auto" will  automatically enable ordering if the 'pipeline.workers' setting
# is also set to '1'.
# "true" will enforce ordering on the pipeline and prevent logstash from starting
# if there are multiple workers.
# "false" will disable any extra processing necessary for preserving ordering.
#
# pipeline.ordered: auto
#
# Sets the pipeline's default value for `ecs_compatibility`, a setting that is
# available to plugins that implement an ECS Compatibility mode for use with
# the Elastic Common Schema.
# Possible values are:
# - disabled (default)
# - v1
# - v8
# The default value will be `v8` in Logstash 8, making ECS on-by-default. To ensure a
# migrated pipeline continues to operate as it did before your upgrade, opt-OUT
# of ECS for the individual pipeline in its `pipelines.yml` definition. Setting
# it here will set the default for _all_ pipelines, including new ones.
#
# pipeline.ecs_compatibility: disabled
#
# ------------ Pipeline Configuration Settings --------------
#
# Where to fetch the pipeline configuration for the main pipeline
#
# path.config:
#
# Pipeline configuration string for the main pipeline
#
# config.string:
#
# At startup, test if the configuration is valid and exit (dry run)
#
# config.test_and_exit: false
#
# Periodically check if the configuration has changed and reload the pipeline
# This can also be triggered manually through the SIGHUP signal
#
# config.reload.automatic: false
#
# How often to check if the pipeline configuration has changed (in seconds)
# Note that the unit value (s) is required. Values without a qualifier (e.g. 60)
# are treated as nanoseconds.
# Setting the interval this way is not recommended and might change in later versions.
#
# config.reload.interval: 3s
#
# Show fully compiled configuration as debug log message
# NOTE: --log.level must be 'debug'
#
# config.debug: false
#
# When enabled, process escaped characters such as \n and \" in strings in the
# pipeline configuration files.
#
# config.support_escapes: false
#
# ------------ API Settings -------------
# Define settings related to the HTTP API here.
#
# The HTTP API is enabled by default. It can be disabled, but features that rely
# on it will not work as intended.
#
# api.enabled: true
#
# By default, the HTTP API is not secured and is therefore bound to only the
# host's loopback interface, ensuring that it is not accessible to the rest of
# the network.
# When secured with SSL and Basic Auth, the API is bound to _all_ interfaces
# unless configured otherwise.
#
# api.http.host: 127.0.0.1
#
# The HTTP API web server will listen on an available port from the given range.
# Values can be specified as a single port (e.g., `9600`), or an inclusive range
# of ports (e.g., `9600-9700`).
#
# api.http.port: 9600-9700
#
# The HTTP API includes a customizable "environment" value in its response,
# which can be configured here.
#
# api.environment: "production"
#
# The HTTP API can be secured with SSL (TLS). To do so, you will need to provide
# the path to a password-protected keystore in p12 or jks format, along with credentials.
#
# api.ssl.enabled: false
# api.ssl.keystore.path: /path/to/keystore.jks
# api.ssl.keystore.password: "y0uRp4$$w0rD"
#
# The HTTP API can be configured to require authentication. Acceptable values are
#  - `none`:  no auth is required (default)
#  - `basic`: clients must authenticate with HTTP Basic auth, as configured
#             with `api.auth.basic.*` options below
# api.auth.type: none
#
# When configured with `api.auth.type` `basic`, you must provide the credentials
# that requests will be validated against. Usage of Environment or Keystore
# variable replacements is encouraged (such as the value `"${HTTP_PASS}"`, which
# resolves to the value stored in the keystore's `HTTP_PASS` variable if present
# or the same variable from the environment)
#
# api.auth.basic.username: "logstash-user"
# api.auth.basic.password: "s3cUreP4$$w0rD"
#
# ------------ Module Settings ---------------
# Define modules here.  Modules definitions must be defined as an array.
# The simple way to see this is to prepend each `name` with a `-`, and keep
# all associated variables under the `name` they are associated with, and
# above the next, like this:
#
# modules:
#   - name: MODULE_NAME
#     var.PLUGINTYPE1.PLUGINNAME1.KEY1: VALUE
#     var.PLUGINTYPE1.PLUGINNAME1.KEY2: VALUE
#     var.PLUGINTYPE2.PLUGINNAME1.KEY1: VALUE
#     var.PLUGINTYPE3.PLUGINNAME3.KEY1: VALUE
#
# Module variable names must be in the format of
#
# var.PLUGIN_TYPE.PLUGIN_NAME.KEY
#
# modules:
#
# ------------ Cloud Settings ---------------
# Define Elastic Cloud settings here.
# Format of cloud.id is a base64 value e.g. dXMtZWFzdC0xLmF3cy5mb3VuZC5pbyRub3RhcmVhbCRpZGVudGlmaWVy
# and it may have an label prefix e.g. staging:dXMtZ...
# This will overwrite 'var.elasticsearch.hosts' and 'var.kibana.host'
# cloud.id: <identifier>
#
# Format of cloud.auth is: <user>:<pass>
# This is optional
# If supplied this will overwrite 'var.elasticsearch.username' and 'var.elasticsearch.password'
# If supplied this will overwrite 'var.kibana.username' and 'var.kibana.password'
# cloud.auth: elastic:<password>
#
# ------------ Queuing Settings --------------
#
# Internal queuing model, "memory" for legacy in-memory based queuing and
# "persisted" for disk-based acked queueing. Defaults is memory
#
# queue.type: memory
#
# If using queue.type: persisted, the directory path where the data files will be stored.
# Default is path.data/queue
#
# path.queue:
#
# If using queue.type: persisted, the page data files size. The queue data consists of
# append-only data files separated into pages. Default is 64mb
#
# queue.page_capacity: 64mb
#
# If using queue.type: persisted, the maximum number of unread events in the queue.
# Default is 0 (unlimited)
#
# queue.max_events: 0
#
# If using queue.type: persisted, the total capacity of the queue in number of bytes.
# If you would like more unacked events to be buffered in Logstash, you can increase the
# capacity using this setting. Please make sure your disk drive has capacity greater than
# the size specified here. If both max_bytes and max_events are specified, Logstash will pick
# whichever criteria is reached first
# Default is 1024mb or 1gb
#
# queue.max_bytes: 1024mb
#
# If using queue.type: persisted, the maximum number of acked events before forcing a checkpoint
# Default is 1024, 0 for unlimited
#
# queue.checkpoint.acks: 1024
#
# If using queue.type: persisted, the maximum number of written events before forcing a checkpoint
# Default is 1024, 0 for unlimited
#
# queue.checkpoint.writes: 1024
#
# If using queue.type: persisted, the interval in milliseconds when a checkpoint is forced on the head page
# Default is 1000, 0 for no periodic checkpoint.
#
# queue.checkpoint.interval: 1000
#
# ------------ Dead-Letter Queue Settings --------------
# Flag to turn on dead-letter queue.
#
# dead_letter_queue.enable: false

# If using dead_letter_queue.enable: true, the maximum size of each dead letter queue. Entries
# will be dropped if they would increase the size of the dead letter queue beyond this setting.
# Default is 1024mb
# dead_letter_queue.max_bytes: 1024mb

# If using dead_letter_queue.enable: true, the interval in milliseconds where if no further events eligible for the DLQ
# have been created, a dead letter queue file will be written. A low value here will mean that more, smaller, queue files
# may be written, while a larger value will introduce more latency between items being "written" to the dead letter queue, and
# being available to be read by the dead_letter_queue input when items are are written infrequently.
# Default is 5000.
#
# dead_letter_queue.flush_interval: 5000

# If using dead_letter_queue.enable: true, the directory path where the data files will be stored.
# Default is path.data/dead_letter_queue
#
# path.dead_letter_queue:
#
# ------------ Debugging Settings --------------
#
# Options for log.level:
#   * fatal
#   * error
#   * warn
#   * info (default)
#   * debug
#   * trace
#
# log.level: info
# path.logs:
#
# ------------ Other Settings --------------
#
# Where to find custom plugins
# path.plugins: []
#
# Flag to output log lines of each pipeline in its separate log file. Each log filename contains the pipeline.name
# Default is false
# pipeline.separate_logs: false
#
# ------------ X-Pack Settings (not applicable for OSS build)--------------
#
# X-Pack Monitoring
# https://www.elastic.co/guide/en/logstash/current/monitoring-logstash.html
#xpack.monitoring.enabled: false
#xpack.monitoring.elasticsearch.username: logstash_system
#xpack.monitoring.elasticsearch.password: password
#xpack.monitoring.elasticsearch.proxy: ["http://proxy:port"]
#xpack.monitoring.elasticsearch.hosts: ["https://es1:9200", "https://es2:9200"]
# an alternative to hosts + username/password settings is to use cloud_id/cloud_auth
#xpack.monitoring.elasticsearch.cloud_id: monitoring_cluster_id:xxxxxxxxxx
#xpack.monitoring.elasticsearch.cloud_auth: logstash_system:password
# another authentication alternative is to use an Elasticsearch API key
#xpack.monitoring.elasticsearch.api_key: "id:api_key"
#xpack.monitoring.elasticsearch.ssl.certificate_authority: [ "/path/to/ca.crt" ]
#xpack.monitoring.elasticsearch.ssl.truststore.path: path/to/file
#xpack.monitoring.elasticsearch.ssl.truststore.password: password
#xpack.monitoring.elasticsearch.ssl.keystore.path: /path/to/file
#xpack.monitoring.elasticsearch.ssl.keystore.password: password
#xpack.monitoring.elasticsearch.ssl.verification_mode: certificate
#xpack.monitoring.elasticsearch.sniffing: false
#xpack.monitoring.collection.interval: 10s
#xpack.monitoring.collection.pipeline.details.enabled: true
#
# X-Pack Management
# https://www.elastic.co/guide/en/logstash/current/logstash-centralized-pipeline-management.html
#xpack.management.enabled: false
#xpack.management.pipeline.id: ["main", "apache_logs"]
#xpack.management.elasticsearch.username: logstash_admin_user
#xpack.management.elasticsearch.password: password
#xpack.management.elasticsearch.proxy: ["http://proxy:port"]
#xpack.management.elasticsearch.hosts: ["https://es1:9200", "https://es2:9200"]
# an alternative to hosts + username/password settings is to use cloud_id/cloud_auth
#xpack.management.elasticsearch.cloud_id: management_cluster_id:xxxxxxxxxx
#xpack.management.elasticsearch.cloud_auth: logstash_admin_user:password
# another authentication alternative is to use an Elasticsearch API key
#xpack.management.elasticsearch.api_key: "id:api_key"
#xpack.management.elasticsearch.ssl.certificate_authority: [ "/path/to/ca.crt" ]
#xpack.management.elasticsearch.ssl.truststore.path: /path/to/file
#xpack.management.elasticsearch.ssl.truststore.password: password
#xpack.management.elasticsearch.ssl.keystore.path: /path/to/file
#xpack.management.elasticsearch.ssl.keystore.password: password
#xpack.management.elasticsearch.ssl.verification_mode: certificate
#xpack.management.elasticsearch.sniffing: false
#xpack.management.logstash.poll_interval: 5s

# X-Pack GeoIP plugin
# https://www.elastic.co/guide/en/logstash/current/plugins-filters-geoip.html#plugins-filters-geoip-manage_update
#xpack.geoip.download.endpoint: "https://geoip.elastic.co/v1/database"


#http.host: "0.0.0.0"
xpack.monitoring.enabled: true
#ES地址
xpack.monitoring.elasticsearch.hosts: [ "http://127.0.0.1:9200" ]
#path.config: /usr/share/logstash/conf.d/*.conf
#path.logs: /var/log/logstash/logs
config:
  reload:
    automatic: true
    interval: 3s
xpack:
  management.enabled: false
  monitoring.enabled: false
新建或者修改pipelines.yml内容如下:
# List of pipelines to be loaded by Logstash
#
# This document must be a list of dictionaries/hashes, where the keys/values are pipeline settings.
# Default values for omitted settings are read from the `logstash.yml` file.
# When declaring multiple pipelines, each MUST have its own `pipeline.id`.
#
# Example of two pipelines:
#
# - pipeline.id: test
#   pipeline.workers: 1
#   pipeline.batch.size: 1
#   config.string: "input { generator {} } filter { sleep { time => 1 } } output { stdout { codec => dots } }"
# - pipeline.id: another_test
#   queue.type: persisted
#   path.config: "/tmp/logstash/*.config"
#
# Available options:
#
#   # name of the pipeline
#   pipeline.id: mylogs
#
#   # The configuration string to be used by this pipeline
#   config.string: "input { generator {} } filter { sleep { time => 1 } } output { stdout { codec => dots } }"
#
#   # The path from where to read the configuration text
#   path.config: "/etc/conf.d/logstash/myconfig.cfg"
#
#   # How many worker threads execute the Filters+Outputs stage of the pipeline
#   pipeline.workers: 1 (actually defaults to number of CPUs)
#
#   # How many events to retrieve from inputs before sending to filters+workers
#   pipeline.batch.size: 125
#
#   # How long to wait in milliseconds while polling for the next event
#   # before dispatching an undersized batch to filters+outputs
#   pipeline.batch.delay: 50
#
#   # Internal queuing model, "memory" for legacy in-memory based queuing and
#   # "persisted" for disk-based acked queueing. Defaults is memory
#   queue.type: memory
#
#   # If using queue.type: persisted, the page data files size. The queue data consists of
#   # append-only data files separated into pages. Default is 64mb
#   queue.page_capacity: 64mb
#
#   # If using queue.type: persisted, the maximum number of unread events in the queue.
#   # Default is 0 (unlimited)
#   queue.max_events: 0
#
#   # If using queue.type: persisted, the total capacity of the queue in number of bytes.
#   # Default is 1024mb or 1gb
#   queue.max_bytes: 1024mb
#
#   # If using queue.type: persisted, the maximum number of acked events before forcing a checkpoint
#   # Default is 1024, 0 for unlimited
#   queue.checkpoint.acks: 1024
#
#   # If using queue.type: persisted, the maximum number of written events before forcing a checkpoint
#   # Default is 1024, 0 for unlimited
#   queue.checkpoint.writes: 1024
#
#   # If using queue.type: persisted, the interval in milliseconds when a checkpoint is forced on the head page
#   # Default is 1000, 0 for no periodic checkpoint.
#   queue.checkpoint.interval: 1000
#
#   # Enable Dead Letter Queueing for this pipeline.
#   dead_letter_queue.enable: false
#
#   If using dead_letter_queue.enable: true, the maximum size of dead letter queue for this pipeline. Entries
#   will be dropped if they would increase the size of the dead letter queue beyond this setting.
#   Default is 1024mb
#   dead_letter_queue.max_bytes: 1024mb
#
#   If using dead_letter_queue.enable: true, the interval in milliseconds where if no further events eligible for the DLQ
#   have been created, a dead letter queue file will be written. A low value here will mean that more, smaller, queue files
#   may be written, while a larger value will introduce more latency between items being "written" to the dead letter queue, and
#   being available to be read by the dead_letter_queue input when items are are written infrequently.
#   Default is 5000.
#
#   dead_letter_queue.flush_interval: 5000

#
#   If using dead_letter_queue.enable: true, the directory path where the data files will be stored.
#   Default is path.data/dead_letter_queue
#
#   path.dead_letter_queue:

# 加载其他配置文件,可以配置来自filebeat文件,mysql数据库,packetbeat网络,windowlogbeat事件日志,auditbeat审计数据,指标数据metricbeat等beats
- pipeline.id: log_from_file.conf
  path.config: "D:\Temp\ELK\logstash-7.17.4-windows-x86_64\logstash-7.17.4\config\log_from_file.conf"
#- pipeline.id: mysql
#path.config: "D:\Temp\ELK\logstash-7.17.4-windows-x86_64\logstash-7.17.4\config\mysql.conf"
新建或者修改log_from_file.conf内容如下:
input {
  file {
    path => "D:\Temp\ELK\logstash-7.17.4-windows-x86_64\logstash-7.17.4\config\log.20240406.txt"
    start_position => "beginning"
    #或者"end"取决于你想从哪里开始读取
    #sincedb_path => "/dev/null"
    sincedb_path => ""
    #使用 /dev/null 来避免记录文件读取位置
    #codec => "plain"
    #如果文件不是文本格式,可以指定 codec,例如 "json" 或 "multiline"
  }

   #beats {
                # 监听5044端口
                #port => "5044"
                # 关闭ssl验证
                #ssl => false
                # 指定输入格式为json
                #codec => json
        #}
}

filter {
  #在这里添加任何过滤器逻辑,例如 grok, mutate 等
  #grok{
        #match => { "message" => "%{TIMESTAMP_ISO8601:timestamp}  %{LOGLEVEL:loglevel} %{NUMBER:pid} --- \[%{DATA:thread}\] %{JAVACLASS:package}  : %{GREEDYDATA:message}"}
    #}


  #使用mutate过滤器的gsub功能去除message字段中的\r
  #mutate {
    #gsub => [
        #第一个数组元素是字段名,第二个元素是正则表达式,第三个元素是替换后的文本
        #这里我们将message字段里的\r替换为空字符串
        #"message", "\r", "",
        # 如果你也想去除\n,可以添加另一个替换规则
        #"message", "\n", ""
    #]
#}
}

output {
  elasticsearch {
    hosts => ["localhost:9200"]
    #index => "your_index_name"
    index => "elk"
  }
  #stdout { codec => rubydebug } # 用于调试,查看发送到 Elasticsearch 的数据结构
}
新建或者修改mysql.conf内容如下,并且下载并放入mysql-connector-j-8.0.31.jar,这个主要是用于数据库数据源---暂时未用 。
input {
        stdin {}
        jdbc {
                type => "jdbc"
                 # 数据库连接地址
                jdbc_connection_string => "jdbc:mysql://ip:port/db_log?useSSL=false&useUnicode=true&&characterEncoding=UTF-8&serverTimezone=GMT%2B8&allowMultiQueries=true"
                 # 数据库连接账号密码;
                jdbc_user => "XXX"
                jdbc_password => "XXX"
                 # MySQL依赖包路径;
                jdbc_driver_library => "/usr/share/logstash/pipeline/mysql-connector-j-8.0.31.jar"
                 # mysql 驱动
                jdbc_driver_class => "com.mysql.cj.jdbc.Driver"
                 # 数据库重连尝试次数
                connection_retry_attempts => "3"
                 # 判断数据库连接是否可用,默认false不开启
                jdbc_validate_connection => "true"
                 # 数据库连接可用校验超时时间,默认3600S
                jdbc_validation_timeout => "3600"
                 # 开启分页查询(默认false不开启);
                jdbc_paging_enabled => "true"
                 # 单次分页查询条数(默认100000,若字段较多且更新频率较高,建议调低此值);
                jdbc_page_size => "500"
                 # statement为查询数据sql,如果sql较复杂,建议配通过statement_filepath配置sql文件的存放路径;
                 # sql_last_value为内置的变量,存放上次查询结果中最后一条数据tracking_column的值,此处即为create_time;
                 # statement_filepath => "mysql/jdbc.sql"
                statement => "select * from db_log.log_info WHERE create_time>= :sql_last_value order by create_time asc"
                 # 是否将字段名转换为小写,默认true(如果有数据序列化、反序列化需求,建议改为false);
                lowercase_column_names => true
                 # 日志等级: fatal,error,warn,info,debug,默认info;
                sql_log_level => warn
                 # 是否记录上次执行结果,true表示会将上次执行结果的tracking_column字段的值保存到last_run_metadata_path指定的文件中;
                record_last_run => true
                 # 需要记录查询结果某字段的值时,此字段为true,否则默认tracking_column为timestamp的值;
                use_column_value => true
                 # 需要记录的字段,用于增量同步,需是数据库字段
                tracking_column => "create_time"
                 # 需要记录的字段的类型 Value can be any of: numeric,timestamp,Default value is "numeric"
                tracking_column_type => timestamp
                 # record_last_run上次数据存放位置;
                last_run_metadata_path => "mysql/last_id.txt"
                 # 是否清除last_run_metadata_path的记录,需要增量同步时此字段必须为false;
                clean_run => false
                 #
                 # 同步频率(分 时 天 月 年),默认每分钟同步一次;
                schedule => "* * * * *"
        }
}

output {
  #ES地址
  elasticsearch {
  hosts => "http://ip:port"
  #索引名称
  index => "mysql_log"
  document_id => "%{id}"
  }
  stdout {
 #日志输出
        codec => json_lines
  }
}
启动运行,在D:\Temp\ELK\logstash-7.17.4-windows-x86_64\logstash-7.17.4\bin目录下输入cmd
输入:logstash.bat -f D:\Temp\ELK\logstash-7.17.4-windows-x86_64\logstash-7.17.4\config\log_from_file.conf
成功结果如下:

4、解压kibana-7.17.4-windows-x86_64,config目录下修改kibana.yml文件,修改kibana.yml内容如下:
# Kibana is served by a back end server. This setting specifies the port to use.
#服务端口(按实际需求)
server.port: 5601
#服务主机(这里是服务器内网地址)
server.host: "127.0.0.1"
#服务名(按实际需求)
server.name: "lj-Kibana"
#elasticsearch地址
elasticsearch.hosts: ["http://127.0.0.1:9200"]
#设置简体中文
i18n.locale: "zh-CN"

#server.port: 5601

# Specifies the address to which the Kibana server will bind. IP addresses and host names are both valid values.
# The default is 'localhost', which usually means remote machines will not be able to connect.
# To allow connections from remote users, set this parameter to a non-loopback address.
#server.host: "localhost"

# Enables you to specify a path to mount Kibana at if you are running behind a proxy.
# Use the `server.rewriteBasePath` setting to tell Kibana if it should remove the basePath
# from requests it receives, and to prevent a deprecation warning at startup.
# This setting cannot end in a slash.
#server.basePath: ""

# Specifies whether Kibana should rewrite requests that are prefixed with
# `server.basePath` or require that they are rewritten by your reverse proxy.
# This setting was effectively always `false` before Kibana 6.3 and will
# default to `true` starting in Kibana 7.0.
#server.rewriteBasePath: false

# Specifies the public URL at which Kibana is available for end users. If
# `server.basePath` is configured this URL should end with the same basePath.
#server.publicBaseUrl: ""

# The maximum payload size in bytes for incoming server requests.
#server.maxPayload: 1048576

# The Kibana server's name.  This is used for display purposes.
#server.name: "your-hostname"

# The URLs of the Elasticsearch instances to use for all your queries.
#elasticsearch.hosts: ["http://localhost:9200"]

# Kibana uses an index in Elasticsearch to store saved searches, visualizations and
# dashboards. Kibana creates a new index if the index doesn't already exist.
#kibana.index: ".kibana"

# The default application to load.
#kibana.defaultAppId: "home"

# If your Elasticsearch is protected with basic authentication, these settings provide
# the username and password that the Kibana server uses to perform maintenance on the Kibana
# index at startup. Your Kibana users still need to authenticate with Elasticsearch, which
# is proxied through the Kibana server.
#elasticsearch.username: "kibana_system"
#elasticsearch.password: "pass"

# Kibana can also authenticate to Elasticsearch via "service account tokens".
# If may use this token instead of a username/password.
# elasticsearch.serviceAccountToken: "my_token"

# Enables SSL and paths to the PEM-format SSL certificate and SSL key files, respectively.
# These settings enable SSL for outgoing requests from the Kibana server to the browser.
#server.ssl.enabled: false
#server.ssl.certificate: /path/to/your/server.crt
#server.ssl.key: /path/to/your/server.key

# Optional settings that provide the paths to the PEM-format SSL certificate and key files.
# These files are used to verify the identity of Kibana to Elasticsearch and are required when
# xpack.security.http.ssl.client_authentication in Elasticsearch is set to required.
#elasticsearch.ssl.certificate: /path/to/your/client.crt
#elasticsearch.ssl.key: /path/to/your/client.key

# Optional setting that enables you to specify a path to the PEM file for the certificate
# authority for your Elasticsearch instance.
#elasticsearch.ssl.certificateAuthorities: [ "/path/to/your/CA.pem" ]

# To disregard the validity of SSL certificates, change this setting's value to 'none'.
#elasticsearch.ssl.verificationMode: full

# Time in milliseconds to wait for Elasticsearch to respond to pings. Defaults to the value of
# the elasticsearch.requestTimeout setting.
#elasticsearch.pingTimeout: 1500

# Time in milliseconds to wait for responses from the back end or Elasticsearch. This value
# must be a positive integer.
#elasticsearch.requestTimeout: 30000

# List of Kibana client-side headers to send to Elasticsearch. To send *no* client-side
# headers, set this value to [] (an empty list).
#elasticsearch.requestHeadersWhitelist: [ authorization ]

# Header names and values that are sent to Elasticsearch. Any custom headers cannot be overwritten
# by client-side headers, regardless of the elasticsearch.requestHeadersWhitelist configuration.
#elasticsearch.customHeaders: {}

# Time in milliseconds for Elasticsearch to wait for responses from shards. Set to 0 to disable.
#elasticsearch.shardTimeout: 30000

# Logs queries sent to Elasticsearch. Requires logging.verbose set to true.
#elasticsearch.logQueries: false

# Specifies the path where Kibana creates the process ID file.
#pid.file: /run/kibana/kibana.pid

# Enables you to specify a file where Kibana stores log output.
#logging.dest: stdout

# Set the value of this setting to true to suppress all logging output.
#logging.silent: false

# Set the value of this setting to true to suppress all logging output other than error messages.
#logging.quiet: false

# Set the value of this setting to true to log all events, including system usage information
# and all requests.
#logging.verbose: false

# Set the interval in milliseconds to sample system and process performance
# metrics. Minimum is 100ms. Defaults to 5000.
#ops.interval: 5000

# Specifies locale to be used for all localizable strings, dates and number formats.
# Supported languages are the following: English - en , by default , Chinese - zh-CN .
#i18n.locale: "en"
运行:
D:\Temp\ELK\kibana-7.17.4-windows-x86_64\bin目录下点击kibana.bat即可,
成功如下:

在浏览器输入:http://127.0.0.1:5601/app/home#/,弹出界面如下,即成功

以上即使elk的全部配置以及启动运行,后面再具体说明如何使用elk。
参考链接:https://blog.csdn.net/qq_43526338/article/details/131201798
https://blog.csdn.net/wuliyouMaozhi/article/details/131719603
https://blog.csdn.net/weixin_41823946/article/details/141105227

 浙公网安备 33010602011771号