Qt绘制线型图与样条图
线型图和样条图
本文参考自 Qt 官方帮助文档,主要介绍线型图、样条图以及它们的动态情况。
1. 折线图
1.1 介绍
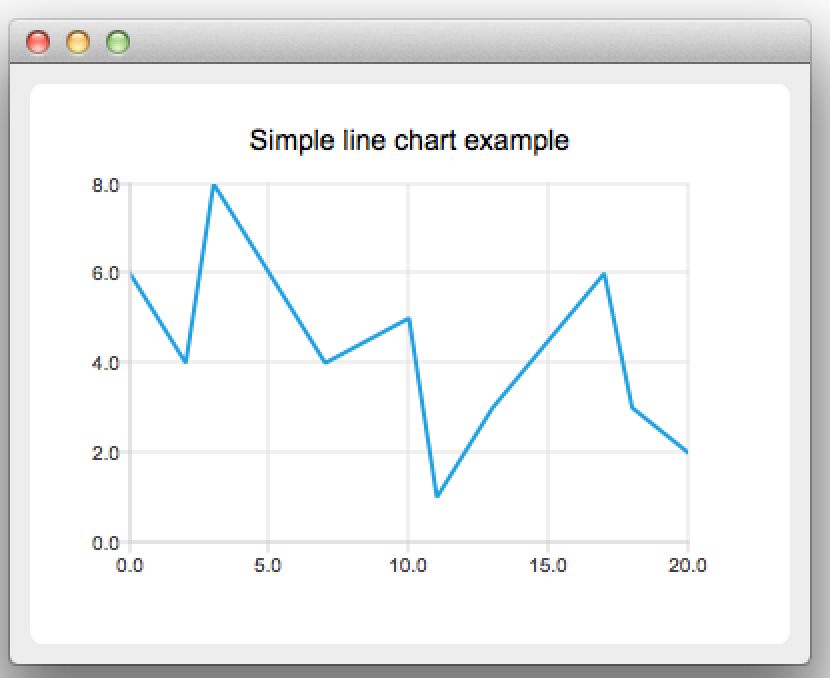
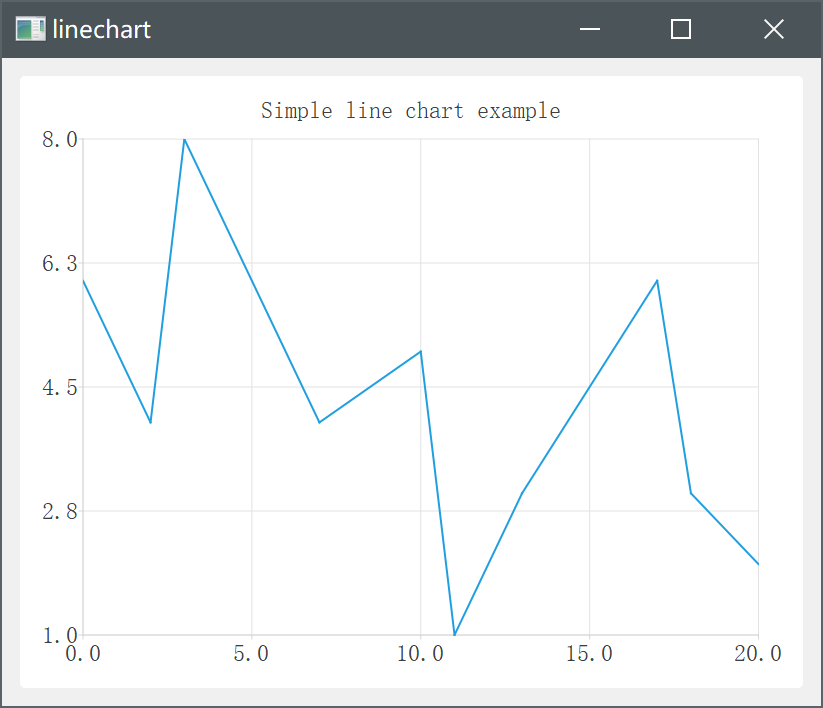
折线图(Line Chart)表示由直线连接的一系列数据点。使用类型为 QLineSeries 类或 LineSeries QML类型。
折线图的基本结构包括:
- 横轴(X轴): 通常表示时间或类别。
- 纵轴(Y轴): 表示变量的值。可以是数值,也可以是百分比或其他度量。
- 数据点: 在图表上表示具体的数据值的点。
- 折线: 将数据点连接起来的线,形成变化趋势。
1.2 示例
本示例是使用 Qt 帮助文档的示例
/* 创建 QLineSeries 实例 */
QLineSeries *series = new QLineSeries();

/* 添加数据点到 series */
// 方式一:使用 append 接口
series->append(0, 6);
series->append(2, 4);
series->append(3, 8);
series->append(7, 4);
series->append(10, 5);
// 方式二:采用 << 操作符
*series << QPointF(11, 1) << QPointF(13, 3) << QPointF(17, 6) << QPointF(18,3) << QPointF(20, 2);


/* 创建一个 QChart 实例,以能够在图标上显示数据 */
QChart *chart = new QChart();
chart->legend()->hide();    // 隐藏了图表的图例,这样图表将不显示数据序列标识
chart->addSeries(series);   // 添加数据序列到图表中
chart->createDefaultAxes(); // 创建默认的坐标轴
chart->setTitle("Simple line chart example");   // 设置标题

/* 用 QChart 作为参数创建一个 QChartView 对象。这样就不需要再创建 QGraphicsView 场景了。 */
QChartView *chartView = new QChartView(chart);
chartView->setRendeHint(QPainter::Antialiasing);    // 设置抗锯齿

/* 显示图表 */
QMainWindow window;
window.setCentralWidget(chartView);
window.resize(400, 300);
window.show();
运行效果如下:
1.3 使用场景
折线图的适用场景:
- 显示趋势和波动: 显示随时间变化的数据趋势,例如股票价格、气温变化等。
- 比较多个数据系列: 折线图可以同时展示多个数据系列的趋势对比,帮助用户直观地看出不同数据之间的关系。。
2. 样条图
2.1 介绍
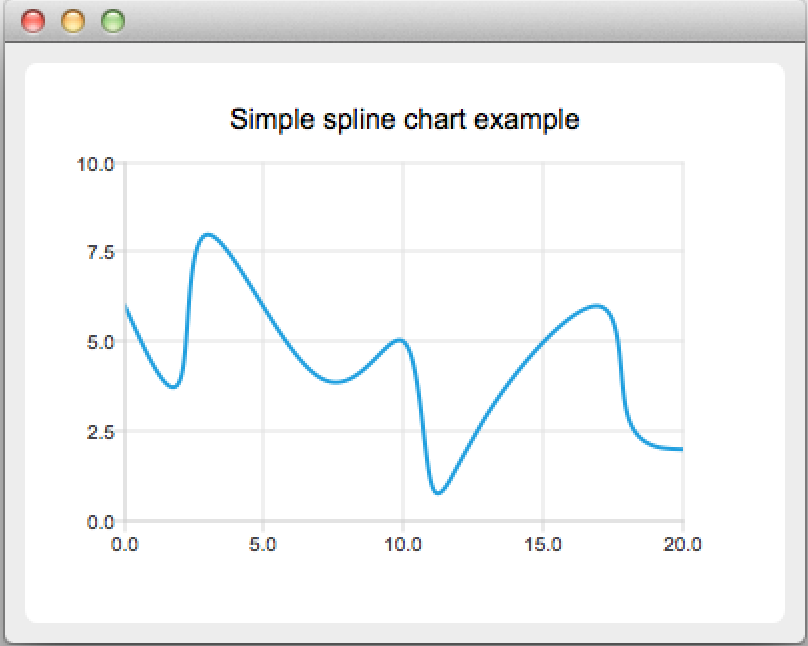
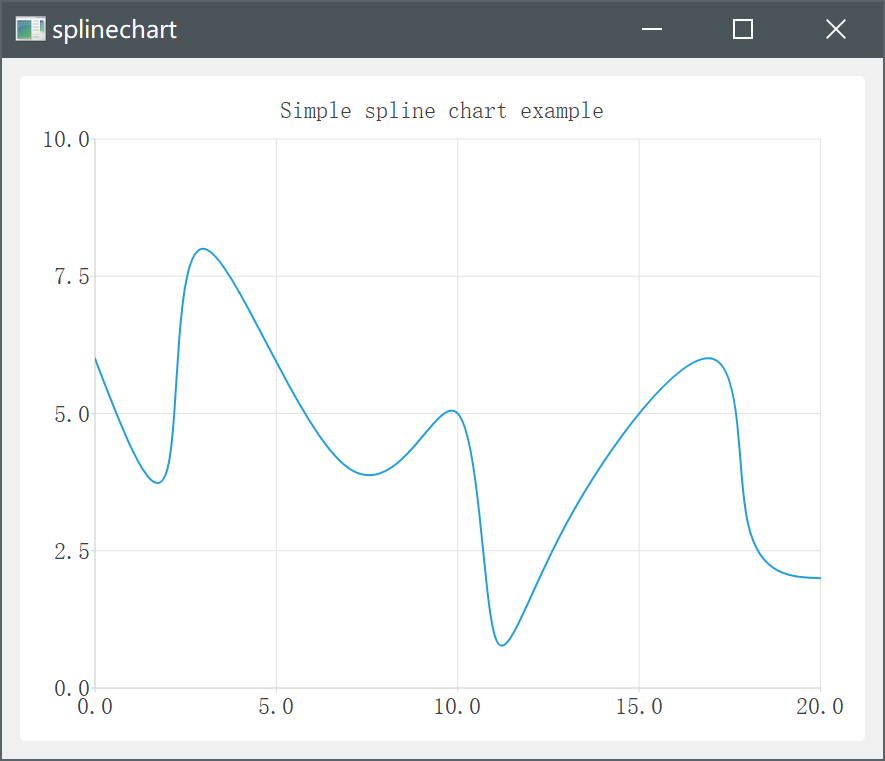
在样条图中,数据点通过样条连接。样条是使用 QPainterPath 绘制的。
样条图是通过使用继承 QLineSeries 的 QSplineSeries 类(或继承 LineSeries 的 SplineSeries 类型)来实现的。
2.2 示例
/* 要创建样条图,需要将数据放入 QSplineseries 中。QSplineSeries 会自动计算绘制样条所需的样条段控制点 */
QSpineSeries *series = new QSplineSeries();
series->setname("spline");  // 为该数据序列设置名称为 spline


/* 为数据序列添加数据点 */
series->append(0, 6);
series->append(2, 4);
series->append(3, 8);
series->append(7, 4);
series->append(10, 5);
*series << QPointF(11, 1) << QPointF(13, 3) << QPointF(17, 6) << QPointF(18, 3) << QPointF(20, 2);


/* 创建 QChart 对象并将数据序列添加到其中 */
QChart *chart = new QChart();
chart->legend()->hide();
chart->addSeries(series);
chart->setTitle("Simple spline chart example");
chart->createDefaultAxes();
chart->axes(Qt::Vertical).first()->setRange(0, 10); // 限制 y 轴上的值的范围

/* 创建QChartView对象 */
QChartView *chartView = new QChartView(chart);
chartView->setRenderHint(QPainter::Antialiasing);

/* 显示 */
QMainWindow window;
window.setCentralWidget(chartView);
window.resize(400, 300);
window.show();
运行结果如下:
2.3 使用场景
样条图的适用场景:
- 平滑曲线展示:样条图适合展示数据之间的曲线变化趋势,通过光滑的曲线能够更清晰地展现数据的变化规律,尤其适合对趋势进行分析和预测。
- 插值处理:当数据点之间缺少连续性时,样条图可以通过插值算法实现数据点之间的平滑过渡,呈现出连续而光滑的曲线,用于更准确地观察数据的变化趋势。
综合来说,折线图适合展示数据的整体趋势和比较多个数据系列的变化,而样条图则更适合展示数据的平滑曲线变化趋势和对趋势进行分析。
3. 动态图
此例依然是 Qt 官方帮助文档的例子:
chart.h
/****************************************************************************
**
** Copyright (C) 2016 The Qt Company Ltd.
** Contact: https://www.qt.io/licensing/
**
** This file is part of the Qt Charts module of the Qt Toolkit.
**
** $QT_BEGIN_LICENSE:GPL$
** Commercial License Usage
** Licensees holding valid commercial Qt licenses may use this file in
** accordance with the commercial license agreement provided with the
** Software or, alternatively, in accordance with the terms contained in
** a written agreement between you and The Qt Company. For licensing terms
** and conditions see https://www.qt.io/terms-conditions. For further
** information use the contact form at https://www.qt.io/contact-us.
**
** GNU General Public License Usage
** Alternatively, this file may be used under the terms of the GNU
** General Public License version 3 or (at your option) any later version
** approved by the KDE Free Qt Foundation. The licenses are as published by
** the Free Software Foundation and appearing in the file LICENSE.GPL3
** included in the packaging of this file. Please review the following
** information to ensure the GNU General Public License requirements will
** be met: https://www.gnu.org/licenses/gpl-3.0.html.
**
** $QT_END_LICENSE$
**
****************************************************************************/

#ifndef CHART_H
#define CHART_H

#include <QtCharts/QChart>
#include <QtCore/QTimer>

QT_CHARTS_BEGIN_NAMESPACE
class QSplineSeries;
class QValueAxis;
QT_CHARTS_END_NAMESPACE

QT_CHARTS_USE_NAMESPACE

//![1]
class Chart: public QChart
{
    Q_OBJECT
public:
    Chart(QGraphicsItem *parent = 0, Qt::WindowFlags wFlags = 0);
    virtual ~Chart();

public slots:
    void handleTimeout();

private:
    QTimer m_timer;
    QSplineSeries *m_series;
    QStringList m_titles;
    QValueAxis *m_axisX;    // 坐标轴类
    QValueAxis *m_axisY;
    qreal m_step;
    qreal m_x;
    qreal m_y;
};
//![1]

#endif /* CHART_H */
chart.cpp
/****************************************************************************
**
** Copyright (C) 2016 The Qt Company Ltd.
** Contact: https://www.qt.io/licensing/
**
** This file is part of the Qt Charts module of the Qt Toolkit.
**
** $QT_BEGIN_LICENSE:GPL$
** Commercial License Usage
** Licensees holding valid commercial Qt licenses may use this file in
** accordance with the commercial license agreement provided with the
** Software or, alternatively, in accordance with the terms contained in
** a written agreement between you and The Qt Company. For licensing terms
** and conditions see https://www.qt.io/terms-conditions. For further
** information use the contact form at https://www.qt.io/contact-us.
**
** GNU General Public License Usage
** Alternatively, this file may be used under the terms of the GNU
** General Public License version 3 or (at your option) any later version
** approved by the KDE Free Qt Foundation. The licenses are as published by
** the Free Software Foundation and appearing in the file LICENSE.GPL3
** included in the packaging of this file. Please review the following
** information to ensure the GNU General Public License requirements will
** be met: https://www.gnu.org/licenses/gpl-3.0.html.
**
** $QT_END_LICENSE$
**
****************************************************************************/

#include "chart.h"
#include <QtCharts/QAbstractAxis>
#include <QtCharts/QSplineSeries>
#include <QtCharts/QValueAxis>
#include <QtCore/QRandomGenerator>
#include <QtCore/QDebug>

Chart::Chart(QGraphicsItem *parent, Qt::WindowFlags wFlags):
    QChart(QChart::ChartTypeCartesian, parent, wFlags),
    m_series(0),
    m_axisX(new QValueAxis()),
    m_axisY(new QValueAxis()),
    m_step(0),
    m_x(5),
    m_y(1)
{
    QObject::connect(&m_timer, &QTimer::timeout, this, &Chart::handleTimeout);
    m_timer.setInterval(1000);

    m_series = new QSplineSeries(this);
    QPen green(Qt::red);
    green.setWidth(3);
    m_series->setPen(green);
    m_series->append(m_x, m_y);

    addSeries(m_series);

    addAxis(m_axisX,Qt::AlignBottom);
    addAxis(m_axisY,Qt::AlignLeft);
    m_series->attachAxis(m_axisX);
    m_series->attachAxis(m_axisY);
    m_axisX->setTickCount(5);
    m_axisX->setRange(0, 10);
    m_axisY->setRange(-5, 10);

    m_timer.start();
}

Chart::~Chart()
{

}

void Chart::handleTimeout()
{
    /*
     * plotArea().width(): 获取绘图区域的宽度,随着拉动显示窗口大小变化而变化
     * m_axisX->tickCount(): 获取x轴的刻度数量
     * m_axisX->max(): 表示x轴的最大值
     * m_axisX->min(): 表示x轴的最小值
     */
    qreal x = plotArea().width() / m_axisX->tickCount();
    qDebug() << "ployArea().width(): " << plotArea().width() << "maxisX->tickCount()" << m_axisX->tickCount() << endl;
    qreal y = (m_axisX->max() - m_axisX->min()) / m_axisX->tickCount();
    qDebug() << "m_axisX->max(): " << m_axisX->max() << "m_axisx->min(): " << m_axisX->min() << endl;
    qDebug() << "x = " << x << ", y = " << y << endl;
    m_x += y;   // 样条图 每次增加的点的步距x为固定的2
    m_y = QRandomGenerator::global()->bounded(5) - 2.5; //  限制样条图的y始终在
    m_series->append(m_x, m_y);
    scroll(x, 0);
    if (m_x == 100)
        m_timer.stop();
}
main.cpp
/****************************************************************************
**
** Copyright (C) 2016 The Qt Company Ltd.
** Contact: https://www.qt.io/licensing/
**
** This file is part of the Qt Charts module of the Qt Toolkit.
**
** $QT_BEGIN_LICENSE:GPL$
** Commercial License Usage
** Licensees holding valid commercial Qt licenses may use this file in
** accordance with the commercial license agreement provided with the
** Software or, alternatively, in accordance with the terms contained in
** a written agreement between you and The Qt Company. For licensing terms
** and conditions see https://www.qt.io/terms-conditions. For further
** information use the contact form at https://www.qt.io/contact-us.
**
** GNU General Public License Usage
** Alternatively, this file may be used under the terms of the GNU
** General Public License version 3 or (at your option) any later version
** approved by the KDE Free Qt Foundation. The licenses are as published by
** the Free Software Foundation and appearing in the file LICENSE.GPL3
** included in the packaging of this file. Please review the following
** information to ensure the GNU General Public License requirements will
** be met: https://www.gnu.org/licenses/gpl-3.0.html.
**
** $QT_END_LICENSE$
**
****************************************************************************/

#include "chart.h"
#include <QtCharts/QChartView>
#include <QtWidgets/QApplication>
#include <QtWidgets/QMainWindow>

QT_CHARTS_USE_NAMESPACE

int main(int argc, char *argv[])
{
    QApplication a(argc, argv);
    QMainWindow window;
    Chart *chart = new Chart;
    chart->setTitle("Dynamic spline chart");
    chart->legend()->hide();
    chart->setAnimationOptions(QChart::AllAnimations);
    QChartView chartView(chart);
    chartView.setRenderHint(QPainter::Antialiasing);
    window.setCentralWidget(&chartView);
    window.resize(400, 300);
    window.show();
    return a.exec();
}
运行后可看到持续在动态延伸的样条图。
使其能够持续动态延伸变化的关键代码为handleTimeout()接口:
代码块一
qreal x = plotArea().width() / m_axisX->tickCount();

scroll(x, 0);
获取绘图区域的宽度 除以 x轴的刻度数量;保证当调整窗口大小时,获得的值都是为一刻度(总共五刻度)宽度。
再通过
scroll(x, 0);将整个图向右滑动五分之一(一刻度)的距离。
代码块二
qreal y = (m_axisX->max() - m_axisX->min()) / m_axisX;

m_x += y;
m_y = QRandomGenerator::global()->bounded(5) - 2.5;

m_series->append(m_x, m_y);
m_axisX 在初始化时的 max()、min() 为 0, 10;
(10 - 0) / 5 = 2
m_x += 2;
在 scroll(x, 0); 后,max() 变为 12、min() 变为 2
依次循环
代码块一负责整个图向右延伸。
代码块二负责新增更新数据序列的点。
疑问点
通过加打印,确定是在scroll(x, 0); 后,m_axisX->max()和m_axisX->min()会同时增加 2 ,所以才能使得更新序列的点都相较于前一个点横向距离为2。
但为何 scroll(x, 0); 能修改 x 轴的最大最小值不理解,官方帮助文档也没查阅到有写明能修改。希望有大神知道的话不吝赐教~
此外,作者在尝试使用Qt creator的debug模式进行调试该槽函数时,在m_y = QRandomGenerator::global()->bounded(5) - 2.5;和m_series->append(m_x, m_y);均会出现段错误,但运行时却能够正常运行。有大神了解的话也请恳请指教一下~

 浙公网安备 33010602011771号