机器学习(Andrew Ng)作业代码(Exercise 7~8)
Programming Exercise 7: K-means Clustering and Principal Component Analysis
K-Means聚类
findClosestCentroids
给出若干组数据点X,矩阵X每一行代表一组数据,以及K个聚类中心centroids,寻找距离每个点最近的聚类中心点,换言之:
function idx = findClosestCentroids(X, centroids)
%FINDCLOSESTCENTROIDS computes the centroid memberships for every example
%   idx = FINDCLOSESTCENTROIDS (X, centroids) returns the closest centroids
%   in idx for a dataset X where each row is a single example. idx = m x 1
%   vector of centroid assignments (i.e. each entry in range [1..K])
%

% Set K
K = size(centroids, 1);

% You need to return the following variables correctly.
idx = zeros(size(X,1), 1);

% ====================== YOUR CODE HERE ======================
% Instructions: Go over every example, find its closest centroid, and store
%               the index inside idx at the appropriate location.
%               Concretely, idx(i) should contain the index of the centroid
%               closest to example i. Hence, it should be a value in the
%               range 1..K
%
% Note: You can use a for-loop over the examples to compute this.
%
    mindis=zeros(size(X,1),1);
    mindis(:)=1e9;
    idx(:)=0;
    for i=1:size(X,1)
        for j=1:K
            nowdis=(X(i,:)-centroids(j,:))*(X(i,:)-centroids(j,:))';
            if(nowdis<mindis(i))
                mindis(i)=nowdis;
                idx(i)=j;
            end
        end
    end
% =============================================================

end
computeCentroids
给出若干组数据点X,矩阵X每一行代表一组数据,以及K个聚类中心centroids,更新K个聚类中心点,使得代价函数最小,换言之:
function centroids = computeCentroids(X, idx, K)
%COMPUTECENTROIDS returs the new centroids by computing the means of the
%data points assigned to each centroid.
%   centroids = COMPUTECENTROIDS(X, idx, K) returns the new centroids by
%   computing the means of the data points assigned to each centroid. It is
%   given a dataset X where each row is a single data point, a vector
%   idx of centroid assignments (i.e. each entry in range [1..K]) for each
%   example, and K, the number of centroids. You should return a matrix
%   centroids, where each row of centroids is the mean of the data points
%   assigned to it.
%

% Useful variables
[m n] = size(X);

% You need to return the following variables correctly.
centroids = zeros(K, n);


% ====================== YOUR CODE HERE ======================
% Instructions: Go over every centroid and compute mean of all points that
%               belong to it. Concretely, the row vector centroids(i, :)
%               should contain the mean of the data points assigned to
%               centroid i.
%
% Note: You can use a for-loop over the centroids to compute this.
%
    cluster_num=zeros(K,1); %cluster_num(i)=the point number of the ith cluster
    for i=1:size(X,1)
        centroids(idx(i),:)=centroids(idx(i),:)+X(i,:);
        cluster_num(idx(i))=cluster_num(idx(i))+1;
    end
    for i=1:K
        centroids(i,:)=centroids(i,:)/cluster_num(i);
    end
% =============================================================


end
kMeansInitCentroids
随机从所有数据点中选K个点作为初始聚类中心点,具体看代码
function centroids = kMeansInitCentroids(X, K)
%KMEANSINITCENTROIDS This function initializes K centroids that are to be
%used in K-Means on the dataset X
%   centroids = KMEANSINITCENTROIDS(X, K) returns K initial centroids to be
%   used with the K-Means on the dataset X
%

% You should return this values correctly
centroids = zeros(K, size(X, 2));

% ====================== YOUR CODE HERE ======================
% Instructions: You should set centroids to randomly chosen examples from
%               the dataset X
%
    idx=randperm(size(X,1));
    centroids=X(idx(1:K),:);
% =============================================================

end
最终测试结果
Fig 1. K-Means聚类10次迭代过程中,3个聚类中心的变化路径
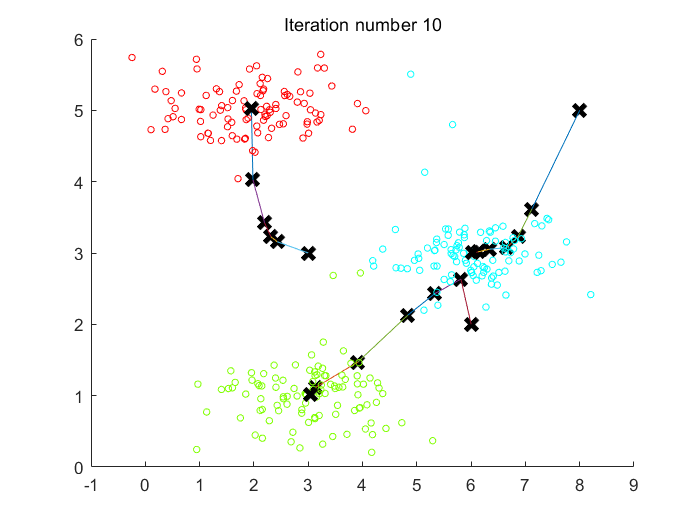
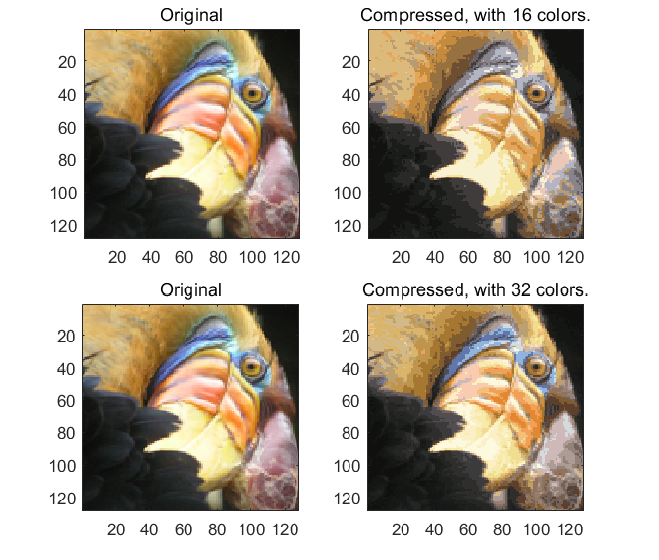
Fig 2.保留16色、32色后压缩得到的图片
主成分分析
pca
函数要求返回所有数据构成的协方差矩阵\(\Sigma\)的特征向量U,每个特征向量对应的特征值构成的对角阵S
对\(\Sigma\)奇异值分解即可得到U和S
function [U, S] = pca(X)
%PCA Run principal component analysis on the dataset X
%   [U, S, X] = pca(X) computes eigenvectors of the covariance matrix of X
%   Returns the eigenvectors U, the eigenvalues (on diagonal) in S
%

% Useful values
[m, n] = size(X);

% You need to return the following variables correctly.
U = zeros(n);
S = zeros(n);

% ====================== YOUR CODE HERE ======================
% Instructions: You should first compute the covariance matrix. Then, you
%               should use the "svd" function to compute the eigenvectors
%               and eigenvalues of the covariance matrix.
%
% Note: When computing the covariance matrix, remember to divide by m (the
%       number of examples).
%
    [U,S,~]=svd((X'*X)/m);
% =========================================================================

end
projectData
用前K个主成分(即U的前K列向量)对数据矩阵X降维,X的每一行代表一组数据
之前求得的U里每一列都是单位向量,对于某组数据(列向量\(x^{(i)}\)),对其降维就是将其投影到\(C(u^{(1)},\cdots,u^{(K)})\)子空间,即降维后的向量为:
令\(U_{reduced}=(u^{(1)},\cdots,u^{(K)})\),则
function Z = projectData(X, U, K)
%PROJECTDATA Computes the reduced data representation when projecting only
%on to the top k eigenvectors
%   Z = projectData(X, U, K) computes the projection of
%   the normalized inputs X into the reduced dimensional space spanned by
%   the first K columns of U. It returns the projected examples in Z.
%

% You need to return the following variables correctly.
Z = zeros(size(X, 1), K);

% ====================== YOUR CODE HERE ======================
% Instructions: Compute the projection of the data using only the top K
%               eigenvectors in U (first K columns).
%               For the i-th example X(i,:), the projection on to the k-th
%               eigenvector is given as follows:
%                    x = X(i, :)';
%                    projection_k = x' * U(:, k);
%
    Ureduced=U(:,1:K);
    Z=(Ureduced'*X')';
% =============================================================

end
recoverData
给出降维到K维后的若干组数据构成的矩阵Z,Z中每一行代表一组降维后的数据,以及协方差矩阵的特征向量(列向量)构成的矩阵U,恢复出原始数据X_rec
对于每组降维后的数据\(z^{(i)}\),只需将前K个特征向量按\(z^{(i)}\)线性组合即可恢复数据
function X_rec = recoverData(Z, U, K)
%RECOVERDATA Recovers an approximation of the original data when using the
%projected data
%   X_rec = RECOVERDATA(Z, U, K) recovers an approximation the
%   original data that has been reduced to K dimensions. It returns the
%   approximate reconstruction in X_rec.
%

% You need to return the following variables correctly.
X_rec = zeros(size(Z, 1), size(U, 1));

% ====================== YOUR CODE HERE ======================
% Instructions: Compute the approximation of the data by projecting back
%               onto the original space using the top K eigenvectors in U.
%
%               For the i-th example Z(i,:), the (approximate)
%               recovered data for dimension j is given as follows:
%                    v = Z(i, :)';
%                    recovered_j = v' * U(j, 1:K)';
%
%               Notice that U(j, 1:K) is a row vector.
%
    Ureduced=U(:,1:K);
    X_rec=(Ureduced*(Z'))';
% =============================================================

end
最终测试结果
Fig 1.PCA降维得到的两个主成分
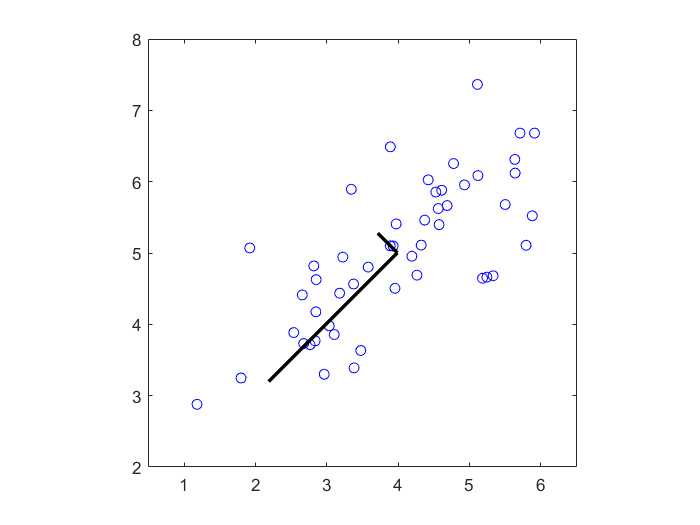
Fig 2.原始数据点(蓝色)与PCA降维后重构出的数据点(红色)
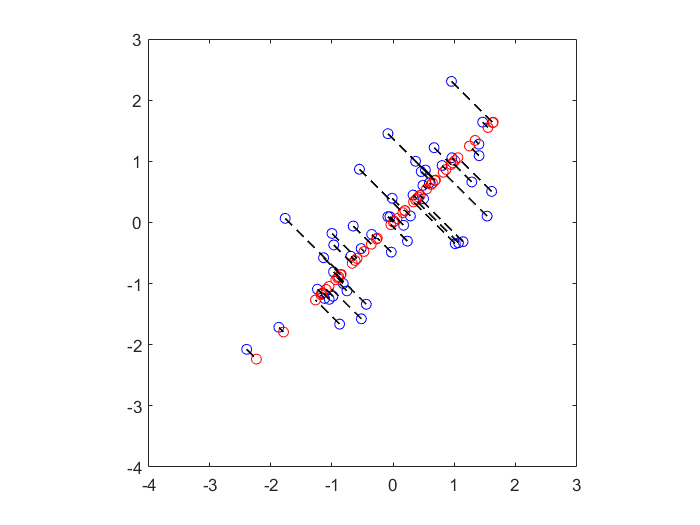
Fig 3.PCA降维得到的主成分脸
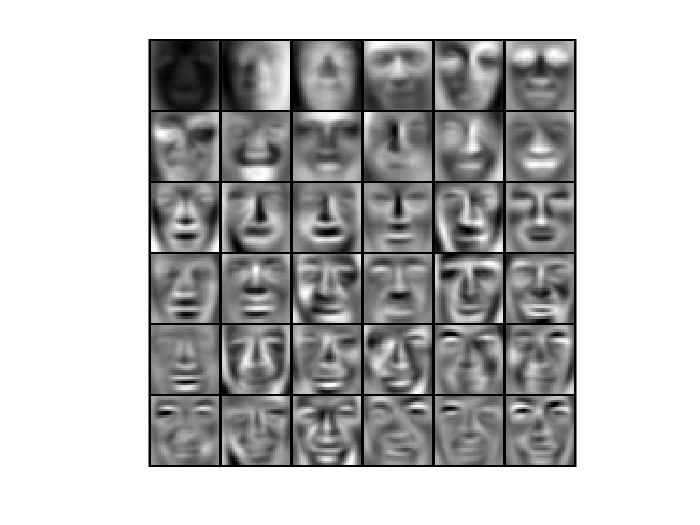
Fig 4.原始脸部图像与PCA降维重构后的脸部图像
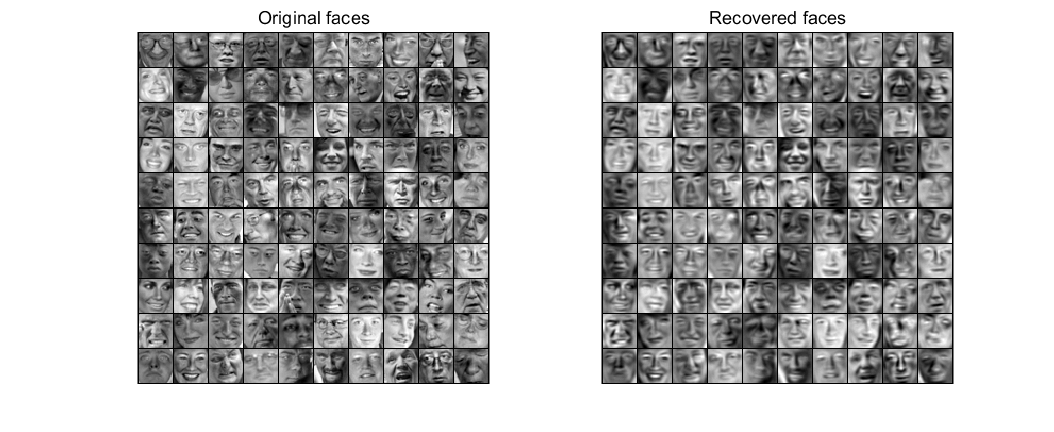
Fig 5.原始数据点(3种特征)
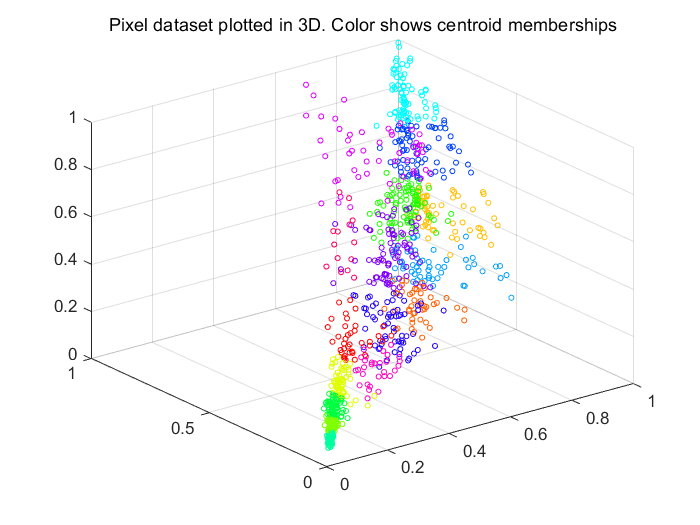
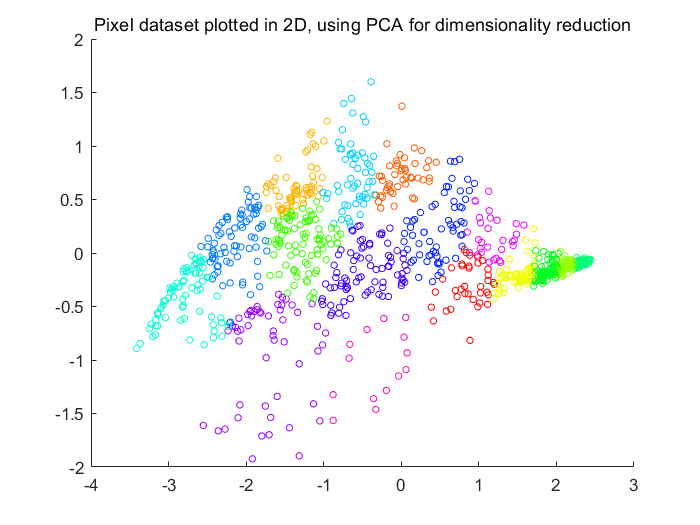
Fig 6.经PCA降维可视化后的数据(两种特征)
Programming Exercise 8: Anomaly Detection and Recommender Systems
单变量高斯分布实现异常检测
estimateGaussian
对于m组、n种特征的数据,假设其所有特征都是相互独立的,\(P(x|\mu;\sigma^2)\)是数据x正常的概率,那么
其中
function [mu sigma2] = estimateGaussian(X)
%ESTIMATEGAUSSIAN This function estimates the parameters of a
%Gaussian distribution using the data in X
%   [mu sigma2] = estimateGaussian(X),
%   The input X is the dataset with each n-dimensional data point in one row
%   The output is an n-dimensional vector mu, the mean of the data set
%   and the variances sigma^2, an n x 1 vector
%

% Useful variables
[m, n] = size(X);

% You should return these values correctly
mu = zeros(n, 1);
sigma2 = zeros(n, 1);

% ====================== YOUR CODE HERE ======================
% Instructions: Compute the mean of the data and the variances
%               In particular, mu(i) should contain the mean of
%               the data for the i-th feature and sigma2(i)
%               should contain variance of the i-th feature.
%
    mu=(mean(X))';
    for i=1:n
        sigma2(i)=sum((X(:,i)-mu(i)).*(X(:,i)-mu(i)))/m;
    end
% =============================================================


end
selectThreshold
用预测概率pval和Ground Truth yval选取最合适的\(\epsilon\),使得F1 Score最大
令Positive为异常(出现频率极小),Negtive为正常(出现频率大),则
TP=True Positive,预测为Positive并且预测正确的个数
TN=True Negative,预测为Negative并且预测正确的个数
FP=False Positive,预测为Positive并且预测错误的个数
FN=False Negative,预测为Negative并且预测错误的个数
Precision为准确率(查准率),Recall为召回率(查全率)
function [bestEpsilon bestF1] = selectThreshold(yval, pval)
%SELECTTHRESHOLD Find the best threshold (epsilon) to use for selecting
%outliers
%   [bestEpsilon bestF1] = SELECTTHRESHOLD(yval, pval) finds the best
%   threshold to use for selecting outliers based on the results from a
%   validation set (pval) and the ground truth (yval).
%

bestEpsilon = 0;
bestF1 = 0;
F1 = 0;

stepsize = (max(pval) - min(pval)) / 1000;
for epsilon = min(pval):stepsize:max(pval)

    % ====================== YOUR CODE HERE ======================
    % Instructions: Compute the F1 score of choosing epsilon as the
    %               threshold and place the value in F1. The code at the
    %               end of the loop will compare the F1 score for this
    %               choice of epsilon and set it to be the best epsilon if
    %               it is better than the current choice of epsilon.
    %
    % Note: You can use predictions = (pval < epsilon) to get a binary vector
    %       of 0's and 1's of the outlier predictions
        predictions=(pval<epsilon);
        truePositive=sum((predictions==yval)&(predictions));
        falsePositive=sum((predictions~=yval)&(predictions));
        trueNegative=sum((predictions==yval)&(~predictions));
        falseNegative=sum((predictions~=yval)&(~predictions));
        precision=truePositive/(truePositive+falsePositive);
        recall=truePositive/(truePositive+falseNegative);
        F1=2*(precision*recall)/(precision+recall);
    % =============================================================

    if F1 > bestF1
       bestF1 = F1;
       bestEpsilon = epsilon;
    end
end

end
最终测试结果
Fig 1.用训练样本拟合出的高斯分布等高线图
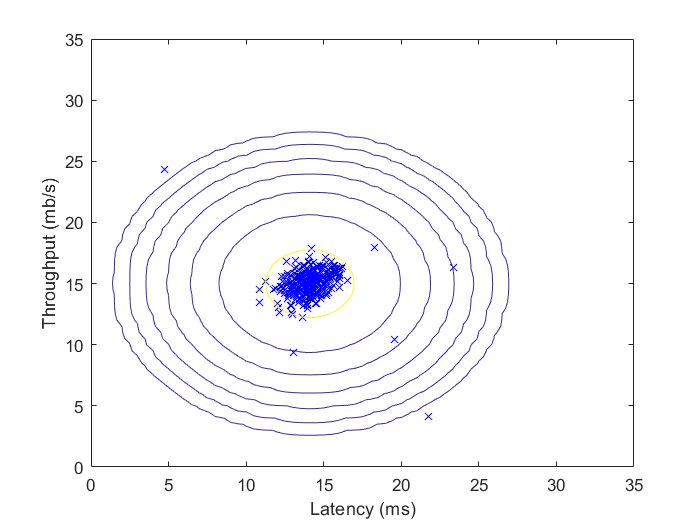
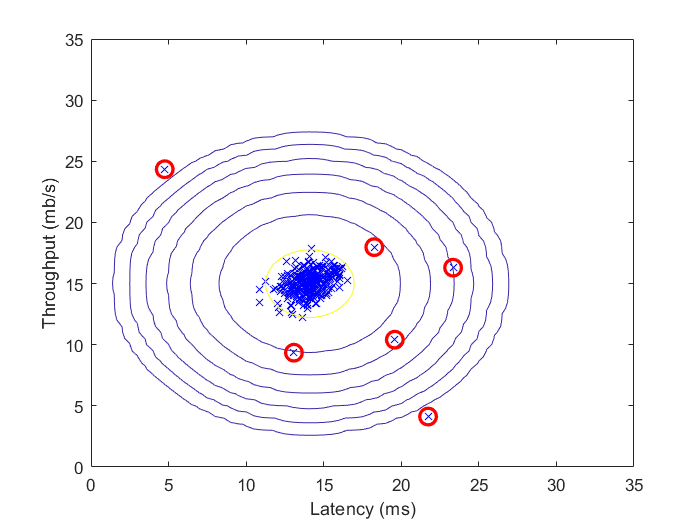
Fig 2.用自动选取的阈值筛选出的异常点
基于内容的推荐系统、协同过滤算法
cofiCostFunc
代价函数
梯度下降:
先尝试用一堆for循环实现梯度下降的公式,发现matlab效率太低,训练速度太慢
function [J, grad] = cofiCostFunc(params, Y, R, num_users, num_movies, ...
                                  num_features, lambda)
%COFICOSTFUNC Collaborative filtering cost function
%   [J, grad] = COFICOSTFUNC(params, Y, R, num_users, num_movies, ...
%   num_features, lambda) returns the cost and gradient for the
%   collaborative filtering problem.
%

% Unfold the U and W matrices from params
X = reshape(params(1:num_movies*num_features), num_movies, num_features);
Theta = reshape(params(num_movies*num_features+1:end), ...
                num_users, num_features);


% You need to return the following values correctly
J = 0;
X_grad = zeros(size(X));
Theta_grad = zeros(size(Theta));

% ====================== YOUR CODE HERE ======================
% Instructions: Compute the cost function and gradient for collaborative
%               filtering. Concretely, you should first implement the cost
%               function (without regularization) and make sure it is
%               matches our costs. After that, you should implement the
%               gradient and use the checkCostFunction routine to check
%               that the gradient is correct. Finally, you should implement
%               regularization.
%
% Notes: X - num_movies  x num_features matrix of movie features
%        Theta - num_users  x num_features matrix of user features
%        Y - num_movies x num_users matrix of user ratings of movies
%        R - num_movies x num_users matrix, where R(i, j) = 1 if the
%            i-th movie was rated by the j-th user
%
% You should set the following variables correctly:
%
%        X_grad - num_movies x num_features matrix, containing the
%                 partial derivatives w.r.t. to each element of X
%        Theta_grad - num_users x num_features matrix, containing the
%                     partial derivatives w.r.t. to each element of Theta
%
    nm=size(Y,1);
    nf=size(X,2);
    nu=size(Y,2);
    J=sum(sum(((Theta*X'-Y').*R').^2))/2+...
        (lambda*sum(sum(Theta.^2))/2)+(lambda*sum(sum(X.^2))/2);

    for i=1:nm
        for k=1:nf
            for j=1:nu
                if(R(i,j)==1)
                    X_grad(i,k)=X_grad(i,k)+(Theta(j,:)*(X(i,:))'-Y(i,j))*Theta(j,k);
                end
            end
            X_grad(i,k)=X_grad(i,k)+lambda*X(i,k);
        end
    end

    for j=1:nu
        for k=1:nf
            for i=1:nm
                if(R(i,j)==1)
                    Theta_grad(j,k)=Theta_grad(j,k)+(Theta(j,:)*(X(i,:))'-Y(i,j))*X(i,k);
                end
            end
            Theta_grad(j,k)=Theta_grad(j,k)+lambda*Theta(j,k);
        end
    end
% =============================================================

grad = [X_grad(:); Theta_grad(:)];

end
之后只保留一层for循环,内部其余循环全部用矩阵运算代替:
1、
则有:
2、
function [J, grad] = cofiCostFunc(params, Y, R, num_users, num_movies, ...
                                  num_features, lambda)
%COFICOSTFUNC Collaborative filtering cost function
%   [J, grad] = COFICOSTFUNC(params, Y, R, num_users, num_movies, ...
%   num_features, lambda) returns the cost and gradient for the
%   collaborative filtering problem.
%

% Unfold the U and W matrices from params
X = reshape(params(1:num_movies*num_features), num_movies, num_features);
Theta = reshape(params(num_movies*num_features+1:end), ...
                num_users, num_features);


% You need to return the following values correctly
J = 0;
X_grad = zeros(size(X));
Theta_grad = zeros(size(Theta));

% ====================== YOUR CODE HERE ======================
% Instructions: Compute the cost function and gradient for collaborative
%               filtering. Concretely, you should first implement the cost
%               function (without regularization) and make sure it is
%               matches our costs. After that, you should implement the
%               gradient and use the checkCostFunction routine to check
%               that the gradient is correct. Finally, you should implement
%               regularization.
%
% Notes: X - num_movies  x num_features matrix of movie features
%        Theta - num_users  x num_features matrix of user features
%        Y - num_movies x num_users matrix of user ratings of movies
%        R - num_movies x num_users matrix, where R(i, j) = 1 if the
%            i-th movie was rated by the j-th user
%
% You should set the following variables correctly:
%
%        X_grad - num_movies x num_features matrix, containing the
%                 partial derivatives w.r.t. to each element of X
%        Theta_grad - num_users x num_features matrix, containing the
%                     partial derivatives w.r.t. to each element of Theta
%
    nm=size(Y,1);
    nf=size(X,2);
    nu=size(Y,2);

    J=sum(sum(((Theta*X'-Y').*R').^2))/2+...
        (lambda*sum(sum(Theta.^2))/2)+(lambda*sum(sum(X.^2))/2);

    for i=1:nm
        idx=find(R(i,:)==1);
        Theta_tmp=Theta(idx,:);
        Y_tmp=Y(i,idx);
        X_grad(i,:)=(X(i,:)*Theta_tmp'-Y_tmp)*Theta_tmp+lambda*X(i,:);
    end

    for j=1:nu
        idx=find(R(:,j)==1);
        X_tmp=X(idx,:);
        Y_tmp=Y(idx,j)';
        Theta_grad(j,:)=(((Theta(j,:))*X_tmp')-Y_tmp)*X_tmp+lambda*Theta(j,:);
    end
% =============================================================

grad = [X_grad(:); Theta_grad(:)];

end
最终测试结果


 浙公网安备 33010602011771号