

WPF性能调试系列 – Ants Performance Profiler
WPF性能调试系列文章:
WPF页面渲染优化:Application Timeline
WPF页面业务加载优化:Ants Performance Profiler
Ants Performance Profiler
Ant Performance Profiler是RedGate旗下强大的性能调优产品, 可以用于分析.NET Winform、webform以及Windows服务。使用在这里主要用来监测wpf 应用程序业务端执行所消耗的时间及性能影响。
下载安装Ants Performance Profiler
从RedGate官网下载,下载地址为http://www.red-gate.com/products/dotnet-development/ants-performance-profiler/
模拟分析应用程序
打开Ants Performance Profiler,通过菜单File -> New Profiling Session...(Ctrl+N)打开新的监测会话,在可监测程序类型中选择.Net executable。
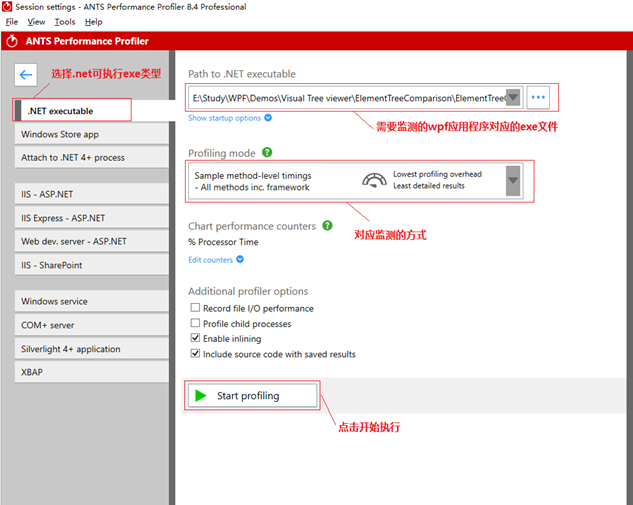
Profiling Mode:设置对于应用程序监测的方式
Line-level and method-level timings; all methods inc. framework:最详细代码级监控,包含framework内部的代码。
Method-level timings; all methods inc. framework:较为详细方法级监控,包含framework内部的代码。
Line-level and method-level timings; only methods with source:一般代码级监控,只包含项目内代码的监控。
Method-level timings; only methods with source:较少方法级监控,指包含项目内代码的监控。
Sample method-level timings:实例级监控。
开始执行后,wpf应用会打开执行,当需要检测的页面加载完成后可以关闭wpf应用,等待分析结果会显示如下图:

注:此工具针对的是页面逻辑的监控,对于xaml加载的监测可通过Application Timeline
业务逻辑代码级分析结果
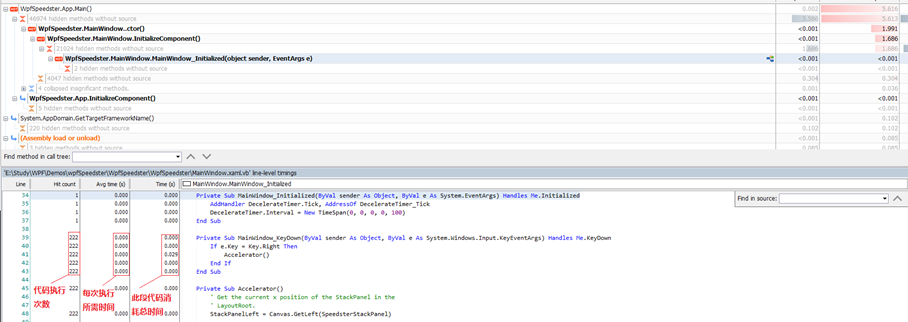
查看代码执行时间就可以分析出业务代码的瓶颈,对于高请求和高耗时的代码进行具体优化。
上面是RedGate的performance profiler的使用方法,主要用于检测页面业务逻辑性能瓶颈。接下来会介绍到RedGate另一个神级产品MemoryProfiler内存性能检测工具。

 浙公网安备 33010602011771号