Prometheus从0到1自定义监控
目标: 自己编写监控指标(记录页面点击次数),然后在granfa中展示
1. 编写exporter
package main

import (
   "fmt"
   "net/http"

   "github.com/prometheus/client_golang/prometheus"
   "github.com/prometheus/client_golang/prometheus/promhttp"
)

var pingCounter = prometheus.NewCounter(
   prometheus.CounterOpts{
       Name: "ping_request_count",
       Help: "No of request handled by Ping handler",
   },
)

func ping(w http.ResponseWriter, req *http.Request) {
   pingCounter.Inc()
   fmt.Fprintf(w, "pong")
}

func main() {
   prometheus.MustRegister(pingCounter)

   http.HandleFunc("/ping", ping)
   http.Handle("/metrics", promhttp.Handler())
   http.ListenAndServe(":8090", nil)
}
初始化项目,安装prometheus的依赖包,并运行
go mod init prom_example
go mod tidy
go run main.go
我们每访问一次 http://localhost:8090/ping, 指标ping_request_count就会+1
查看http://localhost:8090/metrics,可以看到该指标。
2. 添加Promeetheus作业
scrape_configs:
  - job_name: 'prometheus'
    static_configs:
      - targets: ['localhost:9090']
  - job_name: cmdb_server
    static_configs:
      - targets: ["localhost:8090"]
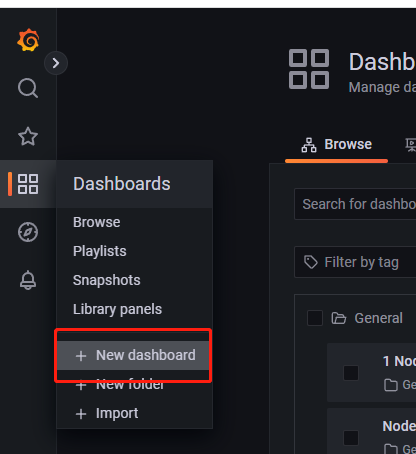
3. 在Grafana中添加面板展示
添加一个新的Dashboard
然后添加一个新面板
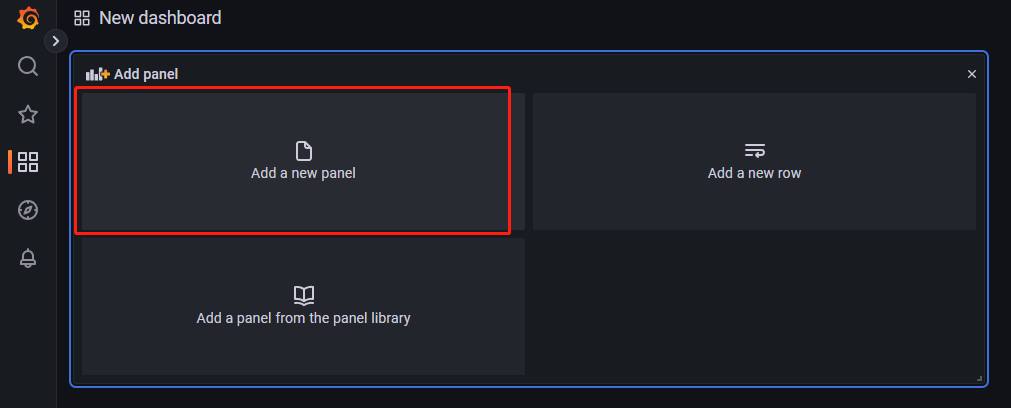
添加一个图表

不断的刷新可以看见ping的次数一直在增加。

 浙公网安备 33010602011771号