


导读:(1)绘制多边形 (2)绘制空心多边形 (3)绘制多条线来制作注视点 (4)绘制多色和单色的棋盘格 (5)绘制次序 (6)同时对比错觉 (7)[r g b a]中α通道
绘制多边形的思路:先设置边,再得到各点坐标,之后是其他属性,最后绘制→(1)、(2)
绘制矩形思路:先设置基本矩形和中心点的坐标,然后获取以中心点为中心后的矩形坐标→(4) 、(5) 、(6) 、(7)
绘制线思路:先设置臂长,据此设置起点和终点坐标,再进行绘制→(3)
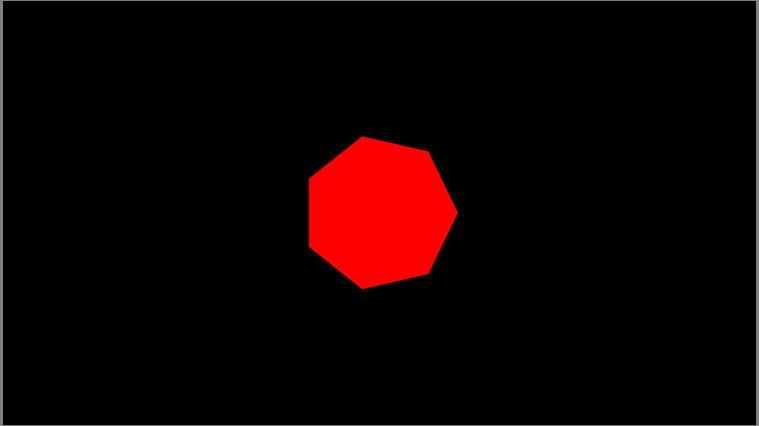
1.Polygon Demo: 如何绘制具有任意边数的多边形
(1) Screen('FillPoly',w,color,pointlist,isConvex) 绘制实心多边形
w 窗口指针 color 颜色 pointlist 多边形顶点矩阵(2*n),每行的两个值为一个顶点坐标值 isConvex是否为凸多边形(默认1,1为凸,2为凹)
% Number of sides for our polygon    多边形的边数
numSides = 7;

% Angles at which our polygon vertices endpoints will be. We start at zero   多边形顶点处的角度
% and then equally space vertex endpoints around the edge of a circle. The   从0开始,在圆的周围均匀分布顶点,然后依次连接这些点来定义多边形
% polygon is then defined by sequentially joining these end points.
anglesDeg = linspace(0, 360, numSides + 1);
anglesRad = anglesDeg * (pi / 180);
radius = 200;

% X and Y coordinates of the points defining out polygon, centred on the     获取这些点的坐标(以屏幕中心为中心点)
% centre of the screen
yPosVector = sin(anglesRad) .* radius + yCenter;
xPosVector = cos(anglesRad) .* radius + xCenter;

% Set the color of the rect to red   设置颜色
rectColor = [1 0 0];

% Cue to tell PTB that the polygon is convex (concave polygons require much       告知PTB这个多边形是凸的
% more processing)
isConvex = 1;

% Draw the rect to the screen  绘制(这里对坐标数组进行转置,是由于点坐标这一参数的要求,2*n的矩阵,每行为一个点的坐标)
Screen('FillPoly', window, rectColor, [xPosVector; yPosVector]', isConvex);

% Flip to the screen
Screen('Flip', window);
示意图
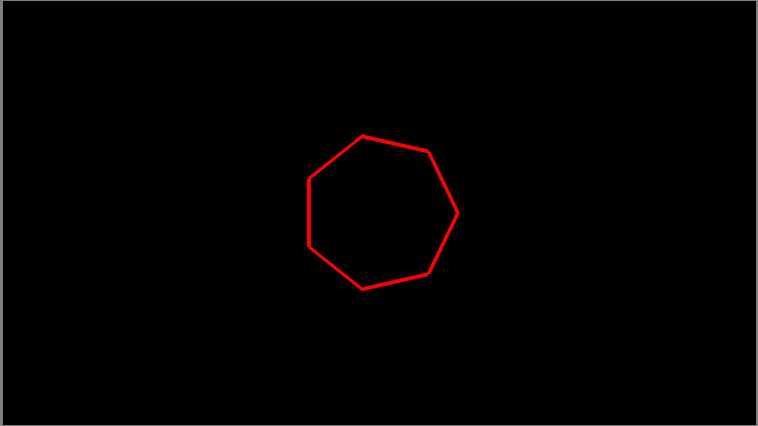
2.Framed Polygon Demo: 绘制空心多边形
(1) Screen('FramePoly',w,color,pointlist,penwidth) 绘制空心多边形
w 窗口指针 color 颜色 pointlist 多边形顶点矩阵(2*n),每行的两个值为一个顶点坐标 penwidth 为画笔粗细,像素为单位,默认为1
注:与FillPoly的参数基本一致,只是最后对画笔的粗细进行了设置
% Number of sides for our polygon
numSides = 7;

% Angles at which our polygon vertices endpoints will be. We start at zero
% and then equally space vertex endpoints around the edge of a circle. The
% polygon is then defined by sequentially joining these end points.
anglesDeg = linspace(0, 360, numSides + 1);
anglesRad = anglesDeg * (pi / 180);
radius = 200;

% X and Y coordinates of the points defining out polygon, centred on the
% centre of the screen
yPosVector = sin(anglesRad) .* radius + yCenter;
xPosVector = cos(anglesRad) .* radius + xCenter;

% Set the color of the rect to red
rectColor = [1 0 0];

% Width of the lines for our frame
lineWidth = 10;

% Draw the rect to the screen
Screen('FramePoly', window, rectColor, [xPosVector; yPosVector]', lineWidth);

% Flip to the screen
Screen('Flip', window);
示意图
3.Fixation Cross Demo: 如何绘制多条线来制作注视点
(1) Screen('DrawLine',w,color,fromH,fromV,toH,toV,penwidth) 绘制单线
w 窗口指针 color 颜色 fromh,fromv起点坐标 toh,tov终点坐标 penwidth线条宽度
(2) Screen('DrawLines',w,xy,width,color,center,smooth) 一次性绘制多条线
w 窗口指针 xy为2*2n的矩阵,n为线条数,第一行x坐标,第二行y坐标,第一二列是第一条线的起点和终点,以此类推
width线条宽度,一个值则都相同,否则取值数同线条数相同,默认为1
color颜色 一个值则都相同,否则同坐标列数相同(每相邻的两个颜色分别对应起点与终点颜色,依据线性插值计算线条上各点颜色),默认为白
center 中心点,默认(0,0) smooth线条平滑度,默认为0,取1表示反锯齿,且需使用Screen('BlendFunction')
% Here we set the size of the arms of our fixation cross   设置注视点长度/臂的大小
fixCrossDimPix = 40;

% Now we set the coordinates (these are all relative to zero we will let          设置坐标
% the drawing routine center the cross in the center of our monitor for us)       让这个注视点的中心是显示器的中心点
xCoords = [-fixCrossDimPix fixCrossDimPix 0 0];
yCoords = [0 0 -fixCrossDimPix fixCrossDimPix];
allCoords = [xCoords; yCoords];

% Set the line width for our fixation cross        设置线条宽度
lineWidthPix = 4;

% Draw the fixation cross in white, set it to the center of our screen and       绘制。设置为白色,以显示器的中心点为中心,并有好的反锯齿效果
% set good quality antialiasing
Screen('DrawLines', window, allCoords,...
    lineWidthPix, white, [xCenter yCenter], 2);

% Flip to the screen
Screen('Flip', window);
示意图

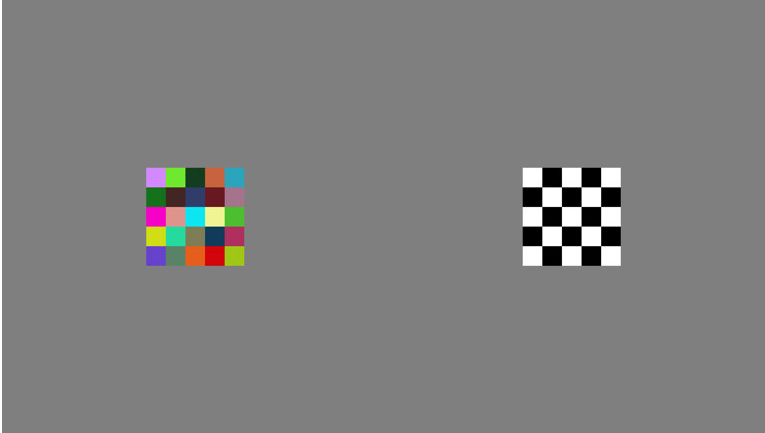
4.Checker-Board Demo:在先前演示的基础上,展示如何构建一个多色(左)和黑白(右)棋盘格。
思路:所用到的函数在先前都已讲解过。这里首先设置一个边长50的基本矩形。然后设置一个网格,并对网格的属性进行了调整(即点的位置坐标),网格中的这些点的坐标
是之后调整基本矩形坐标的中心点。值得注意的是,在控制黑白格的颜色属性时用到的是eye(n)函数,它对角线为1,其余位置原色为0.而这一函数在之后也会见到
% Make a base Rect of 50 by 50 pixels   设置基本矩阵
dim = 50;
baseRect = [0 0 dim dim];

% Make the coordinates for our grid of squares  制作方形格的坐标
[xPos, yPos] = meshgrid(-2:1:2, -2:1:2);

% Calculate the number of squares and reshape the matrices of coordinates  计算方形数量,并制作坐标向量
% into a vector
[s1, s2] = size(xPos);
numSquares = s1 * s2;
xPos = reshape(xPos, 1, numSquares);
yPos = reshape(yPos, 1, numSquares);

% Scale the grid spacing to the size of our squares and centre   调整网格间距
xPosLeft = xPos .* dim + screenXpixels * 0.25;
yPosLeft = yPos .* dim + yCenter;

xPosRight = xPos .* dim + screenXpixels * 0.75;
yPosRight = yPos .* dim + yCenter;

% Set the colors of each of our squares  设置颜色
multiColors = rand(3, numSquares);
bwColors = repmat(eye(2), 3, 3);
bwColors = bwColors(1:end-1, 1:end-1);
bwColors = reshape(bwColors, 1, numSquares);
bwColors = repmat(bwColors, 3, 1);

% Make our rectangle coordinates  制作矩形坐标
allRectsLeft = nan(4, 3);
allRectsRight = nan(4, 3);
for i = 1:numSquares
    allRectsLeft(:, i) = CenterRectOnPointd(baseRect,...
        xPosLeft(i), yPosLeft(i));
    allRectsRight(:, i) = CenterRectOnPointd(baseRect,...
        xPosRight(i), yPosRight(i));
end

% Draw the rect to the screen
Screen('FillRect', window, [multiColors bwColors],...
    [allRectsLeft allRectsRight]);

% Flip to the screen
Screen('Flip', window);
示意图
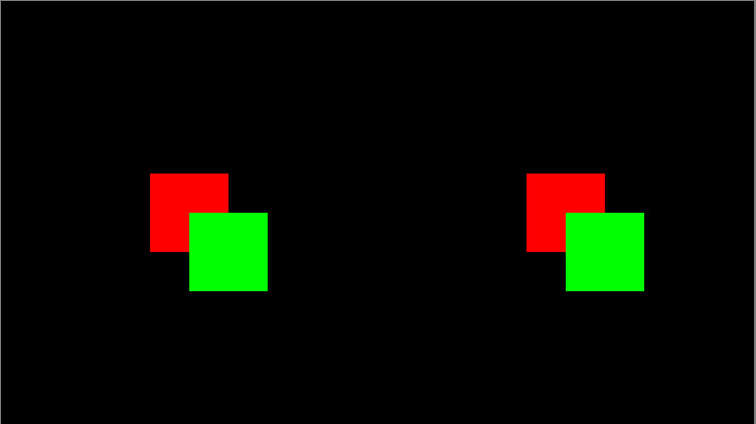
5.Order Of Drawing Demo: .这个演示了顺序绘图。这是在屏幕上绘制多个对象的关键,例如重叠对象。
注:所涉及函数之前都有介绍。左手边是分别执行命令,右手边则通过一条代码实现两个矩形的绘制。注意绘制的次序问题,这里先绘制的矩形(红)被后后绘制的矩形|(绿)所覆盖
% Make a base Rect of 200 by 200 pixels.  设置基本矩形
baseRect = [0 0 200 200];

% Center the left hand side squares on positions in the screen.   矩形居中到屏幕左手边位置
leftBackRect = CenterRectOnPointd(baseRect, screenXpixels * 0.25, yCenter);
leftForwardRect = CenterRectOnPointd(baseRect,...
    screenXpixels * 0.25 + 100, yCenter + 100);

% Do the same of the right hand side squares, but not concatonate these  右手边
% into a single matrix. This is bacause we will be drawing these both in a
% single line of code.
rightBackRect = CenterRectOnPointd(baseRect,...
    screenXpixels * 0.75, yCenter);
rightForwardRect = CenterRectOnPointd(baseRect,...
    screenXpixels * 0.75 + 100, yCenter + 100);
rightRects = [rightBackRect; rightForwardRect]';             注意这里的转置符号

% We do the same of the colors of the rects. Put them in one matrix for    设置颜色
% drawing
rightRectColors = [1 0 0; 0 1 0]';

% Draw the left hand side squares onto the screen, we do this sequentially  绘制左手边矩形
% with two lines of code, one for each rectangle.
Screen('FillRect', window, [1 0 0], leftBackRect);
Screen('FillRect', window, [0 1 0], leftForwardRect);

% Now we draw the two right hand side squares to the screen. We get the   绘制右手边矩形
% same results as if we draw in two seperate lines, however we efficiently
% draw both squares in a single line of code. Note, that as detailed above,
% we acheive the same ordering of squares by placing the coordinates of the          将首先要绘制的矩形坐标放入坐标矩阵,以实现相同的正方形顺序
% square we want to draw first into the matrix first.
Screen('FillRect', window, rightRectColors, rightRects);

% Flip to the screen.
Screen('Flip', window);
示意图
6.Simultaneous Contrast Illusion Demo:绘制一个简单的同时对比错觉。这一次所有的对象绘制在一行代码中实习。
注:这里的同事对比错觉(明度对比现象)是指,两个相似的灰色方形,亮度相同,由于背景的原因出现不同的灰色阴影。白色背景下的更暗。
% Make a base Rect of 1/2 screen Y dimension for the black and white        分别制作一个边长为显示器y维度一半和六分之一的矩形
% background squares, and 1/6 for the front grey squares. This will produce
% a standard simultaneous contrast illustion where the two smaller grey
% sqaures, although the same luminance will appear different shades of grey
% due to being on different backgrounds. The one on the white background
% square will look darker then the one on the white background square.
backDim = screenYpixels / 2;
baseRectBack = [0 0 backDim backDim];

frontDim = screenYpixels / 6;
baseRectFront = [0 0 frontDim frontDim];

% Position the rectangles on the screen       制作矩形位置坐标
backLeftRect = CenterRectOnPointd(baseRectBack,...
    xCenter - backDim / 2, yCenter);
backRightRect = CenterRectOnPointd(baseRectBack,...
    xCenter + backDim / 2, yCenter);

frontLeftRect = CenterRectOnPointd(baseRectFront,...
    xCenter - backDim / 2, yCenter);
frontRightRect = CenterRectOnPointd(baseRectFront,...
    xCenter + backDim / 2, yCenter);

% Make a marix of all the rect coordinates
allRects = [backLeftRect; backRightRect; frontLeftRect; frontRightRect]';   注意转置符号

% We do the same of the colors of the rects. Put them in one matrix for    颜色同理
% drawing
allColors = [white white white; black black black;...
    grey grey grey; grey grey grey]';

% Draw all the rects in one line of code
Screen('FillRect', window, allColors, allRects);

% Flip to the screen.
Screen('Flip', window);
示意图

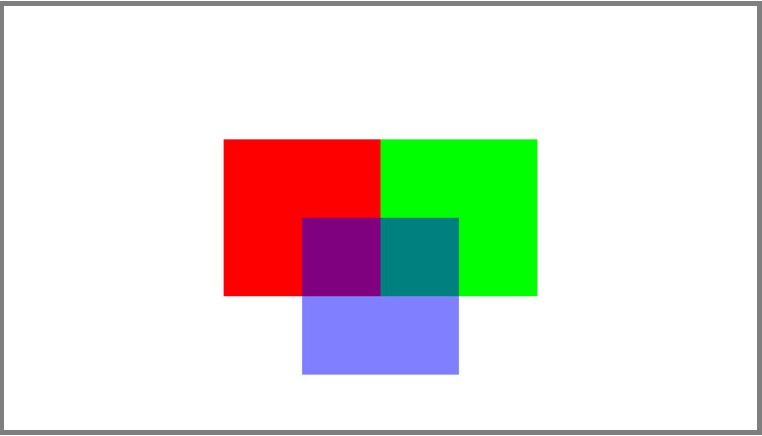
7.Semi-Transparent Squares Demo:如何使用“alpha”通道使图形半透明,以便您可以部分地“看穿图形”到后面的图形。同样,操作的顺序也是关键。
% Make a base Rect of 400 by 400 pixels   制作基本矩形
baseRect = [0 0 400 400];

% Screen X positions of our three rectangles  三个矩形的中心坐标
squareXpos = [xCenter - 200 xCenter + 200 xCenter];
squareYpos = [yCenter yCenter yCenter + 200];
numSqaures = length(squareXpos);

% Set the colors to Red, Green and Blue, with the fourth value being the  设置颜色[r g b a],第四个参数α值指透明度,1位完全不透明,0为完全透明
% "alpha" value. This also takes a value between 0 and 1 just like a
% normal colour, however now 0 = totally transparent and 1 = totally
% opaque. Our RGB triplets are now RGBA values.
allColors = [1 0 0 1; 0 1 0 1; 0 0 1 0.5]';

% Make our rectangle coordinates  制作矩形坐标
allRects = nan(4, 3);
for i = 1:numSqaures
    allRects(:, i) = CenterRectOnPointd(baseRect,...
        squareXpos(i), squareYpos(i));
end

% Draw the rect to the screen  绘制
Screen('FillRect', window, allColors, allRects);

% Flip to the screen
Screen('Flip', window);
示意图

 浙公网安备 33010602011771号