
elk收集nginx日志
系统环境是centos7 jdk1.8.0_221 本机的ip地址是192.168.1.8
filebeat 6.0.0版本,通过RPM包安装在需要监控日志的机器上(相当于agent)
rpm -ivh filebeat-6.0.0-x86_64.rpm

vim /etc/filebeat/filebeat.yml
#=========================== Filebeat prospectors =============================
filebeat.prospectors:
# Each - is a prospector. Most options can be set at the prospector level, so
# you can use different prospectors for various configurations.
# Below are the prospector specific configurations.
- type: log
# Change to true to enable this prospector configuration.
enabled: true
# Paths that should be crawled and fetched. Glob based paths.
paths:
- /var/log/zabbix/*.log
#============================= Filebeat modules ===============================
filebeat.config.modules:
# Glob pattern for configuration loading
path: ${path.config}/modules.d/*.yml
# Set to true to enable config reloading
reload.enabled: false
# Period on which files under path should be checked for changes
#reload.period: 10s
#==================== Elasticsearch template setting ==========================
setup.template.settings:
index.number_of_shards: 3
#index.codec: best_compression
#_source.enabled: false
#============================== Kibana =====================================
# Starting with Beats version 6.0.0, the dashboards are loaded via the Kibana API.
# This requires a Kibana endpoint configuration.
setup.kibana:
# Kibana Host
# Scheme and port can be left out and will be set to the default (http and 5601)
# In case you specify and additional path, the scheme is required: http://localhost:5601/path
# IPv6 addresses should always be defined as: https://[2001:db8::1]:5601
host: "192.168.51.91:5601"
#================================ Outputs =====================================
# Configure what output to use when sending the data collected by the beat.
#-------------------------- Elasticsearch output ------------------------------
output.elasticsearch:
# Array of hosts to connect to.
hosts: ["192.168.51.91:9200"]
# Optional protocol and basic auth credentials.
#protocol: "https"
#username: "elastic"
#password: "changeme"
#----------------------------- Logstash output --------------------------------
#output.logstash:
# The Logstash hosts
#hosts: ["localhost:5044"]
# Optional SSL. By default is off.
# List of root certificates for HTTPS server verifications
#ssl.certificate_authorities: ["/etc/pki/root/ca.pem"]
# Certificate for SSL client authentication
#ssl.certificate: "/etc/pki/client/cert.pem"
# Client Certificate Key
#ssl.key: "/etc/pki/client/cert.key"
logstash 6.0.0版本,通过RPM包安装
rpm -ivh logstash-6.0.0.rpm
配置文件在/etc/logstash目录下
vim /ect/logstash/conf.d/logstash.nginx.conf
input {
  file {
    #nginx日志存放的位置
    path => "/usr/local/nginx/logs/*.log"
    #表示从头开始读取
    start_position => "beginning"

    #记录读取文件内容和位置
    #sincedb_path => "/tmp/logstash_data/"
  }
}

filter {
    grok {
      match => {
        "message" => '%{IPORHOST:remote_ip} - %{DATA:user_name} \[%{HTTPDATE:time}\] "%{WORD:request_action} %{DATA:request} HTTP/%{NUMBER:http_version}" %{NUMBER:response} %{NUMBER:bytes} "%{DATA:referrer}" "%{DATA:agent}"'
      }
    }
    #删除message字段
    mutate {
      remove_field => "message"
    }
    #常用插件,根据ip地址提供对应的地理信息
    geoip {
      source => ip
    }
    #日期格式插件
    date {
      match => [ "timestamp" , "dd/MMM/yyyy:HH:mm:ss Z" ]
    }
}

output {
  elasticsearch {
     hosts => ["192.168.1.8:9200"]
     index => "logstash-nginx-access-log"
  }
  #输出到控制台
  stdout { codec => rubydebug }
}
elasicsearch 6.0.0版本,通过tar.gz源码安装
#解压
tar -zxvf elasticsearch-6.0.0.tar.gz
#移动到/usr/local目录下
mv elasticsearch-6.0.0 /usr/local
vim /usr/local/elasticsearch-6.0.0/config/elasticsearch.yml
# ---------------------------------- Cluster -----------------------------------
#
# Use a descriptive name for your cluster:
#
cluster.name: my-tao
#
# ------------------------------------ Node ------------------------------------
#
# Use a descriptive name for the node:
#
node.name: node8
#
# Add custom attributes to the node:
#
#node.attr.rack: r1
#
# ----------------------------------- Paths ------------------------------------
#
# Path to directory where to store the data (separate multiple locations by comma):
#
path.data: /usr/local/elasticsearch-6.0.0/data
#
# Path to log files:
#
path.logs: /usr/local/elasticsearch-6.0.0/logs
#
# ----------------------------------- Memory -----------------------------------
#
# Lock the memory on startup:
#
#bootstrap.memory_lock: true
#
# Make sure that the heap size is set to about half the memory available
# on the system and that the owner of the process is allowed to use this
# limit.
#
# Elasticsearch performs poorly when the system is swapping the memory.
#
# ---------------------------------- Network -----------------------------------
#
# Set the bind address to a specific IP (IPv4 or IPv6):
#
network.host: 192.168.1.8
#
# Set a custom port for HTTP:
#
http.port: 9200
#
# For more information, consult the network module documentation.
由于elasticsearch不能有root用户启动,我这里创建一个用户tao
更改所属用户
chown -R tao:tao /usr/local/elasticsearch.yml
用su tao进入 tao用户
启动elasticsearch时报错,报错内容如下
随即去修改tao用户系统的参数
vim /etc/security/limits.conf
#<domain>      <type>  <item>         <value>
*                soft    nofile          65536
*                hard    nofile          131072
tao              soft    nproc           4096
tao              hard    nproc           4096
#更改最大线程数
sudo sysctl -w vm.max_map_count=262144
#使修改生效
sudo sysctl -p
#注:在很多博客中我都看到以上操作配置会永久生效,但是实际我的操作中,重启机器后,配置会还原,所以我还是建议写入配置文件
# echo "vm.max_map_count=262144" >> /etc/sysctl.conf
kibana 6.0.0版本,通过rpm安装。
rpm -ivh kibana-6.0.0-x86_64.rpm
安装完毕后配置文件路径在/etc/kibana目录下
vim /etc/kibana/kibana.yml
# Kibana is served by a back end server. This setting specifies the port to use.
server.port: 5601

# Specifies the address to which the Kibana server will bind. IP addresses and host names are both valid values.
# The default is 'localhost', which usually means remote machines will not be able to connect.
# To allow connections from remote users, set this parameter to a non-loopback address.
server.host: "192.168.1.8"

# Enables you to specify a path to mount Kibana at if you are running behind a proxy. This only affects
# the URLs generated by Kibana, your proxy is expected to remove the basePath value before forwarding requests
# to Kibana. This setting cannot end in a slash.
#server.basePath: ""

# The maximum payload size in bytes for incoming server requests.
#server.maxPayloadBytes: 1048576

# The Kibana server's name.  This is used for display purposes.
#server.name: "your-hostname"

# The URL of the Elasticsearch instance to use for all your queries.
elasticsearch.url: "http://192.168.1.8:9200"

# When this setting's value is true Kibana uses the hostname specified in the server.host
# setting. When the value of this setting is false, Kibana uses the hostname of the host
# that connects to this Kibana instance.
#elasticsearch.preserveHost: true

# Kibana uses an index in Elasticsearch to store saved searches, visualizations and
# dashboards. Kibana creates a new index if the index doesn't already exist.
#kibana.index: ".kibana"
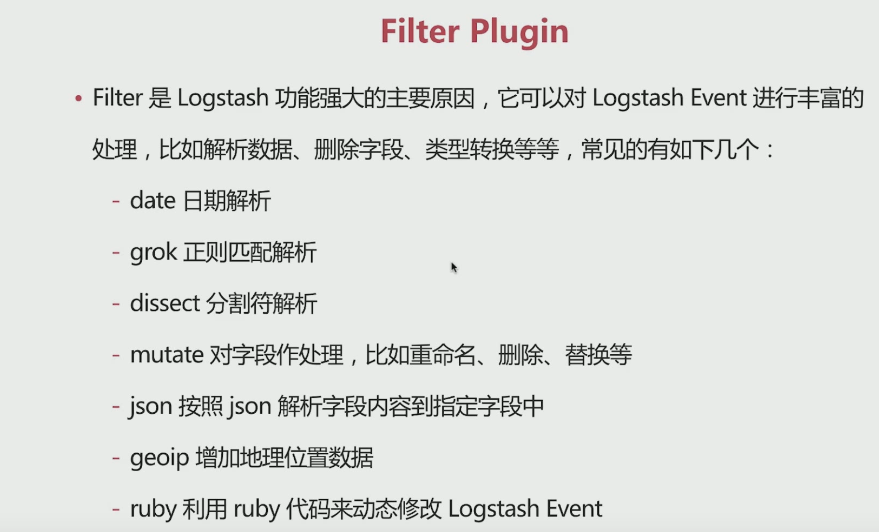
以下为logstash的filter扩展知识:

当匹配失败时
tag_on_failure:
默认是 _grokparsefailure,可以基于此做判断
正则表达式:https://www.debuggex.com
官方pattern正则匹配模板:https://github.com/logstash-plugins/logstash-patterns-core
利用nginx代理kibana
先安装nginx
./configure
    --sbin-path=/usr/local/nginx/nginx
    --conf-path=/usr/local/nginx/nginx.conf
    --pid-path=/usr/local/nginx/nginx.pid
    --with-http_ssl_module
    --with-pcre=../pcre-8.44
    --with-zlib=../zlib-1.2.11
    --with-openssl=../openssl

make && make install

#安装httpd工具
yum -y install httpd-tools
#设置登录验证账号密码
htpasswd -bc /usr/local/nginx/htpasswd.users admin 123456
修改nginx配置文件配置方向代理
http {
    include       mime.types;
    default_type  application/octet-stream;

    log_format  main  '$remote_addr - $remote_user [$time_local] "$request"'
'$status $body_bytes_sent "$http_referer"'
'"$http_user_agent" "$http_x_forwarded_for"';

    #access_log  logs/access.log  main;

    sendfile        on;
    #tcp_nopush     on;
    #不显示NGINX版本
    server_tokens off;
    #keepalive_timeout  0;
    keepalive_timeout  65;

    gzip  on;

    server {
        listen       80;
        server_name  localhost;

        #charset koi8-r;

        #access_log  logs/host.access.log  main;

        location / {
           #root   html;
           #index  index.html index.htm;
           auth_basic "kibana login auth";
           auth_basic_user_file /usr/local/nginx/kibana.htpasswd;
           proxy_pass http://192.168.51.91:5601;
           proxy_redirect off;
           proxy_set_header Host $host;
           proxy_set_header X-Real-IP $remote_addr;
           proxy_set_header X-Forwarded-For $proxy_add_x_forwarded_for;
        }

        error_page  404              /404.html;

        # redirect server error pages to the static page /50x.html
        #
        error_page   500 502 503 504  /50x.html;
        location = /50x.html {
            root   html;
        }
}

 浙公网安备 33010602011771号