机器学习—单变量线性回归
本篇讲述以下内容:
- 单变量线性回归
- 代价函数
- 梯度下降
单变量线性回归
回顾上节,在回归问题中,我们给定输入变量,试图映射到连续预期结果函数上从而得到输出。单变量线性回归就是从一个输入值预测一个输出值。输入/输出的对应关系就是一个线性函数。
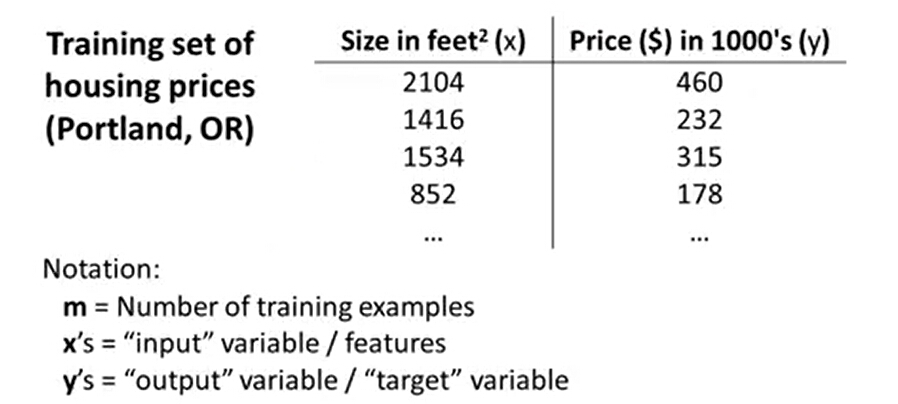
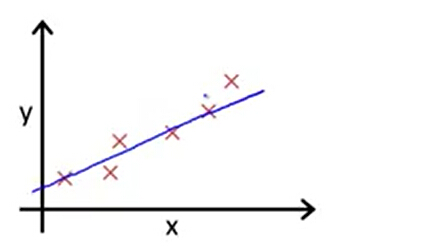
下面是一个根据房屋面积预测房屋价格的例子。
假设有一个数据集,我们称作训练集,数据集包括房屋面积和房屋价格数据。
x:表示输入变量,也叫特征变量。
y:表示输出变量,也叫目标变量。
(xi,yi):表示一个识训练样本,训练集的一行。i 表示 第 i 个训练样本。
m:表示训练样本的数量。
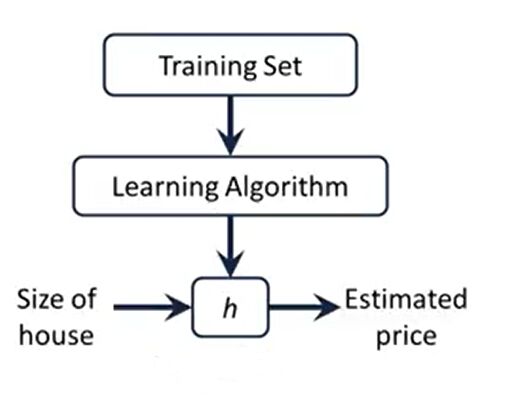
在接下来的学习之前,先了解一下监督学习的一般工作方式。如下图,训练集通过学习算法训练后,得到一个h(hypothesis),它表示为一个函数。
函数的输入为房屋大小,输出为房屋的价格。通过这个函数我们则可以预测房屋价格,这就是机器学习中的回归问题。
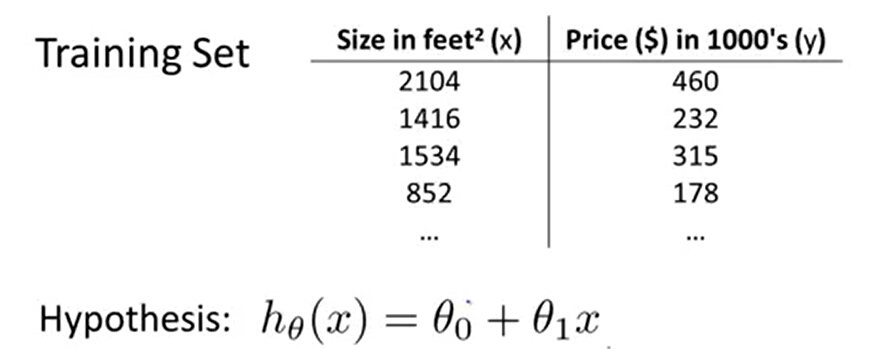
在单变量线性回归中,我们的假设函数为:hθ(x)=θ0+θ1x ,其中θ0 和θ1为模型参数。
讲到这肯定有疑惑为什么要选这个函数,实际应用可能不是线性的函数,可能会是更复杂的函数。这里只是为了从简单线性方程的例子入手,假设房屋的面积和价格是一个线性关系。
好继续, 我们有了假设函数,接下来要做的就是如何选择不同的参数θ0 和θ1。下图可以看到不同的参数值会得到不同的假设函数。
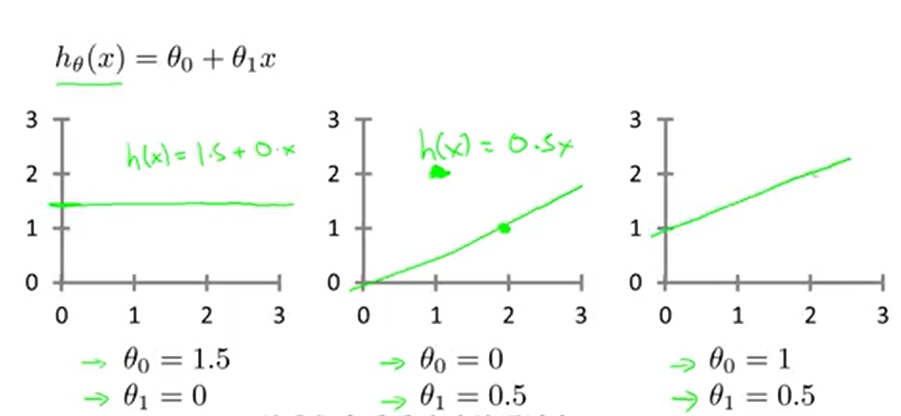
我们选择参数θ0 和θ1得到的直线,应该尽量和训练数据拟合。这样才能做出比较精准的预测。
那么如何来使它来更好的拟合数据呢?我们的想法是hθ(x) 应该最接近 y 值,即问题转化成了一个mininize(hθ(x) -y) 的问题,有没有感觉转化成数学问题了。
代价函数
接下来引入一个代价函数Cost Function,也被称作平方误差函数。
函数定义如下,每个训练样本 hθ(x)-y 的平方和,再求平均。再乘1/2是为了接下来的计算上的方便。
我们想要做的就是关于θ0 和θ1对函数J(θ0 ,θ1)求最小值。即找到使得J(θ0 ,θ1)最小值的时候,θ0 和θ1的值。接下来介绍一种算法,梯度下降。它能自动的找出使 J 最小化的参数θ0 和θ1的值。
梯度下降
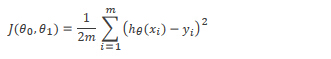
了解梯度下降前,我们了解一下J(θ0 ,θ1) 的函数图像。
当θ0 为0时,随着的变化θ1 将会得到下图的效果。θ1取1的时候 J 为最小值
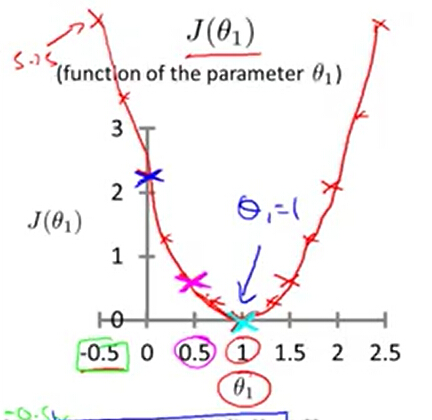
当θ0 和θ1都有值时。
好了,回到我们之前问题描述,我们有一个代价函数J(θ0 ,θ1),想通过一个算法来使用得 J 最小化。
那么梯度下降的思想就是:
开始给定一个(θ0 ,θ1)初始值,我们想通过不断的改变θ0 ,θ1的值,每次改都使得 J 减少。最终J 减少到最小。

下面通过图我们来看梯度下降是如何工作的。
首先想象一下,对θ0 ,θ1赋以某个初始值(一般可以初始化为0)。假设初始化后,J 对应是下图的标红的这个点。
我们想象这是一座山,你站在山上的这个点上。在梯度下降中,我们要做的是看看周周围,并问自己我想要通过小碎步下山,朝哪个方向能最快下山?并朝着这个方向前行。

每走一步都需要调整最快的那个方向。最终你走出了这么一条轨迹。最终走到一个局部最优解——山脚下。当然如果你是站在另一个点,你可以会走出另一条轨迹。


上面是通过图直观的感受,那么事实上在这走一步的方向,其实就是梯度的负方向。梯度其实就是J的导数,对于一个线性函数,也就是线的斜率。
如果把每一步的长度 定义为学习速率。那么每走一步的这个动作,其实就是 θ0 ,θ1 都朝梯度的负方向进行更新。控制着更新的幅度。
下图是数学定义:即按照一定的学习速率,不断重复更新θ0 ,θ1 直到 J 局部收敛到最小值。

下图是对一元线性函数的直客感受,如下图函数上的某点,沿红色方向,即斜率的反方向下降一个步长到另一点。θ1将得到 -* 斜率的更新。

另一个方向也是同样效果。

其中关于学习速率大小的的选择对算法的影响 ,如果速率太小,则下降的速度比较慢。如果速率过大,会无法收敛到最小值。

如果θ1的选择一开始就是最优点。那么这个点的导数为0,θ1则不会得到更新。

梯度下降的过程中,导数的值会不断变小,下降的幅度也会自然的减少。所有没有必要在下降的过程中调整学习速率。

在线性回归中,梯度下降的具体实现
前面讲了梯度下降的数学特性,那么在线性回归的训练算法中是如何应用的呢。
下图左边是梯度下降的算法,右边是线性回归的模型。

要实现这个算法,我们还差![]() 这个关键项。它表示分别对θ0 ,θ1求导,可以参数数学上的求导方法。
这个关键项。它表示分别对θ0 ,θ1求导,可以参数数学上的求导方法。
对θ0 求导后得到

对θ1求导后得到

然后代到梯度下降的公式中。每一次循环,都要分别求出θ0 ,θ1的更新值然后更新。

课后练习代码,Octave实现。
现在有一家餐饮连锁公司,关于城市人口和利润的数据。我们要得到城市人口和利润的预测函数。
先用可视化的方式Plot 这些数据。

%% ======================= Part 2: Plotting =======================
fprintf('Plotting Data ...\n')
data = load('ex1data1.txt');
X = data(:, 1); y = data(:, 2);
m = length(y); % number of training examples

% Plot Data
% Note: You have to complete the code in plotData.m
plotData(X, y);

fprintf('Program paused. Press enter to continue.\n');
pause;
function plotData(x, y)
%PLOTDATA Plots the data points x and y into a new figure
%   PLOTDATA(x,y) plots the data points and gives the figure axes labels of
%   population and profit.

% ====================== YOUR CODE HERE ======================
% Instructions: Plot the training data into a figure using the
%               "figure" and "plot" commands. Set the axes labels using
%               the "xlabel" and "ylabel" commands. Assume the
%               population and revenue data have been passed in
%               as the x and y arguments of this function.
%
% Hint: You can use the 'rx' option with plot to have the markers
%       appear as red crosses. Furthermore, you can make the
%       markers larger by using plot(..., 'rx', 'MarkerSize', 10);

figure; % open a new figure window

plot(x, y, 'rx','MarkerSize',10); %Plot the data

ylabel('Profit in $10,000s'); %Set the y-axis lable

xlabel('Population of City in 10,000s'); %Set the x-axis lable

% ============================================================

end
用梯度下降方法,得到一个最佳似合直线。
%% =================== Part 3: Gradient descent ===================
fprintf('Running Gradient Descent ...\n')

X = [ones(m, 1), data(:,1)]; % Add a column of ones to x
theta = zeros(2, 1); % initialize fitting parameters

% Some gradient descent settings
iterations = 1500; %定义循环次数
alpha = 0.01; %定义学习速率

% compute and display initial cost
computeCost(X, y, theta)

% run gradient descent
theta = gradientDescent(X, y, theta, alpha, iterations);
CostFunction 代价函数实现,
function J = computeCost(X, y, theta)
%COMPUTECOST Compute cost for linear regression
%   J = COMPUTECOST(X, y, theta) computes the cost of using theta as the
%   parameter for linear regression to fit the data points in X and y

% Initialize some useful values
m = length(y); % number of training examples

% You need to return the following variables correctly
J = 0;

% ====================== YOUR CODE HERE ======================
% Instructions: Compute the cost of a particular choice of theta
%               You should set J to the cost.

temp = (X * theta) - y ;

J = (1 / (2 * m)) * sum( (temp.^2) ) ;

% 矩阵运算方式
% temp'*temp
% =========================================================================

end
梯度下降实现
function [theta, J_history] = gradientDescent(X, y, theta, alpha, num_iters)
%GRADIENTDESCENT Performs gradient descent to learn theta
%   theta = GRADIENTDESENT(X, y, theta, alpha, num_iters) updates theta by
%   taking num_iters gradient steps with learning rate alpha

% Initialize some useful values
m = length(y); % number of training examples
J_history = zeros(num_iters, 1);

for iter = 1:num_iters

    % ====================== YOUR CODE HERE ======================
    % Instructions: Perform a single gradient step on the parameter vector
    %               theta.
    %
    % Hint: While debugging, it can be useful to print out the values
    %       of the cost function (computeCost) and gradient here.
    %

temp1 = theta(1) - (alpha / m) * sum((X * theta - y ).*X(:,1));

temp2 = theta(2) - (alpha / m) * sum((X * theta - y).* X(:,2));

theta(1) = temp1;

theta(2) = temp2;

% 矩阵运算方式
% theta = theta - alpha * (X' * (X * theta - y)) / m;
    % ============================================================

    % Save the cost J in every iteration
    J_history(iter) = computeCost(X, y, theta);

end

end
打印结果
% print theta to screen
fprintf('Theta found by gradient descent: ');
fprintf('%f %f \n', theta(1), theta(2));

% Plot the linear fit
hold on; % keep previous plot visible
plot(X(:,2), X*theta, '-')
legend('Training data', 'Linear regression')
hold off % don't overlay any more plots on this figure

% Predict values for population sizes of 35,000 and 70,000
predict1 = [1, 3.5] *theta;
fprintf('For population = 35,000, we predict a profit of %f\n',...
    predict1*10000);
predict2 = [1, 7] * theta;
fprintf('For population = 70,000, we predict a profit of %f\n',...
    predict2*10000);

fprintf('Program paused. Press enter to continue.\n');
pause;


注:上述学习资料参考:https://www.coursera.org/learn/machine-learning


 浙公网安备 33010602011771号