prometheus+grafana安装与集成
部署prometheus server
prometheus软件下载地址:https://prometheus.io/download/
同步时间
我们在安装prometheus server监控软件之前,需要同步集群时间。
由于prometheus是一个时间序列数据库,因此其对系统时间的准确性要求很高,必须保证本机时间实时同步。
timedatectl set-timezone Asia/Shanghai
yum -y install ntpdate && ntpdate ntp1.aliyun.com
安装prometheus软件包
mkdir /data
tar -xf prometheus-2.53.4.linux-amd64.tar.gz  -C /data/
mv /data/prometheus-2.53.4.linux-amd64 /data/prometheus
配置systemd管理prometheus
cat >> /usr/lib/systemd/system/prometheus.service << EOF
[Service]
ExecStart=/data/prometheus/prometheus --config.file=/data/prometheus/prometheus.yml --web.listen-address=0.0.0.0:9090 --storage.tsdb.retention.time=10d --web.enable-lifecycle --storage.tsdb.path=/data/prometheus/data
[Install]
WantedBy=multi-user.target
[Unit]
Description=prometheus
After=network.target
EOF

systemctl daemon-reload
systemctl enable prometheus
systemctl start prometheus
systemctl status prometheus

# 启动参数解释:
# --web.listen-address=0.0.0.0:9090:代表prometheus监听的地址
# --storage.tsdb.retention.time=10d:代表数据保留时间 默认10天
# --web.enable-lifecycle:代表开启热更新配置
# --storage.tsdb.path=/data/prometheus/data:本地tsdb存储位置
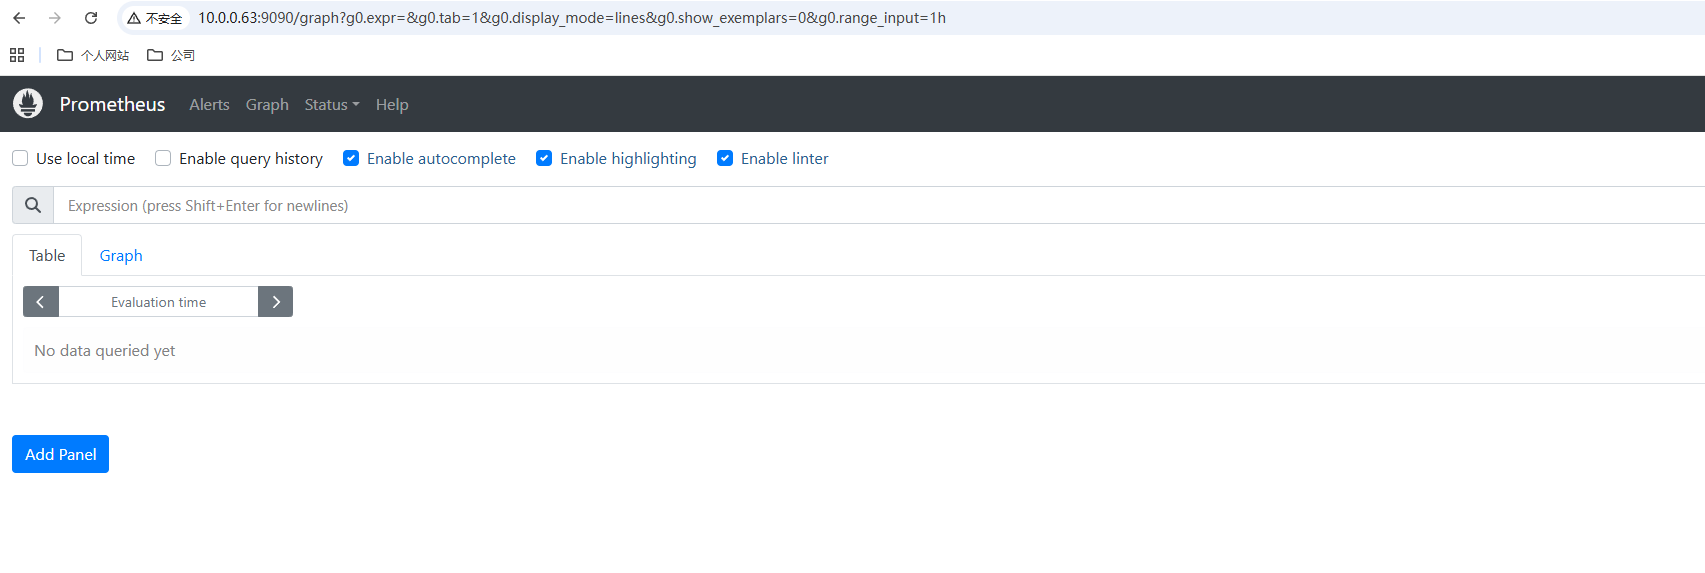
验证
我们可以在游览器中访问9090端口
部署grafana
下载软件包并启动
wget https://dl.grafana.com/oss/release/grafana-11.6.0.linux-amd64.tar.gz
tar -xf grafana-11.6.0.linux-amd64.tar.gz -C /data/
mv /data/grafana-v11.6.0 /data/grafana
配置systemd管理grafana
cat  > /usr/lib/systemd/system/grafana.service  << EOF
[Service]
ExecStart=/data/grafana/bin/grafana-server --config=/data/grafana/conf/defaults.ini --homepath=/data/grafana

[Install]
WantedBy=multi-user.target

[Unit]
Description=grafana
After=network.target
EOF


systemctl daemon-reload
systemctl enable grafana
systemctl start grafana
systemctl status grafana
配置grafana集成prometheus
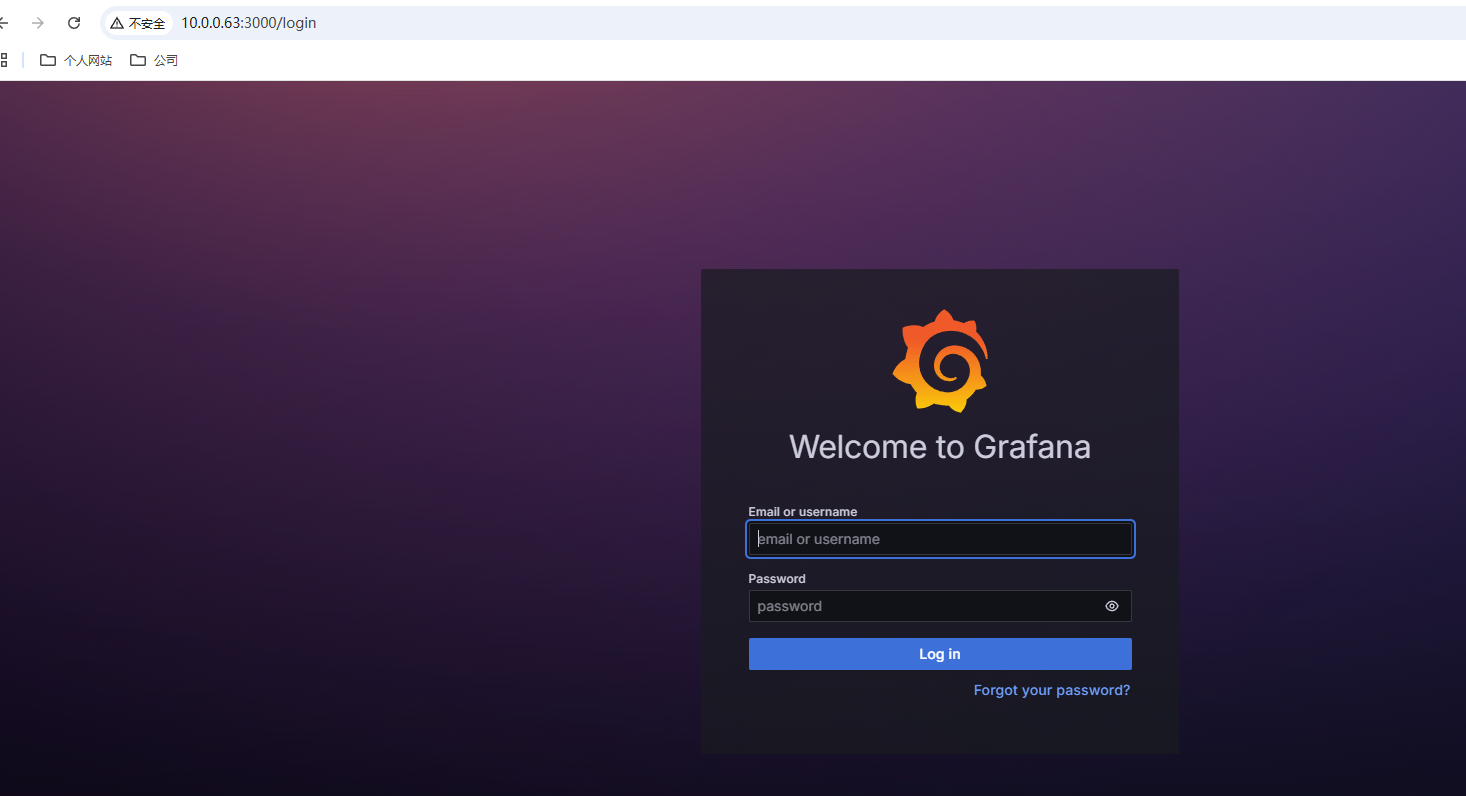
默认的用户名和密码都为admin。首次登录需要重新自定义一个密码
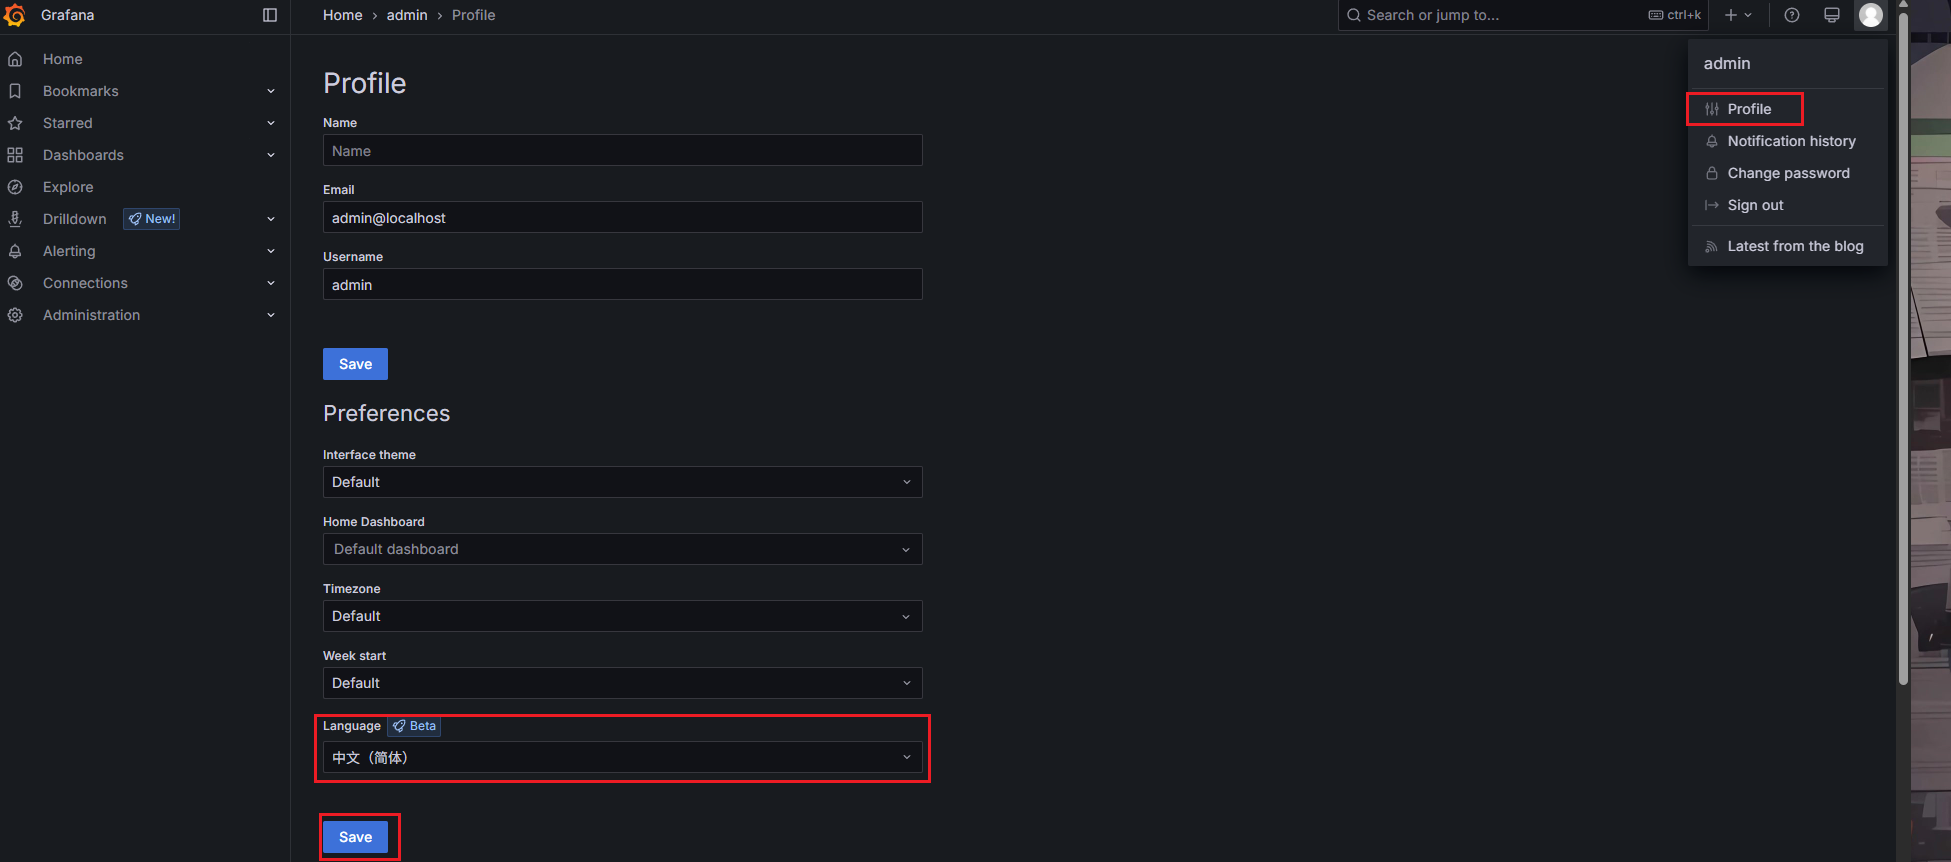
配置汉化:
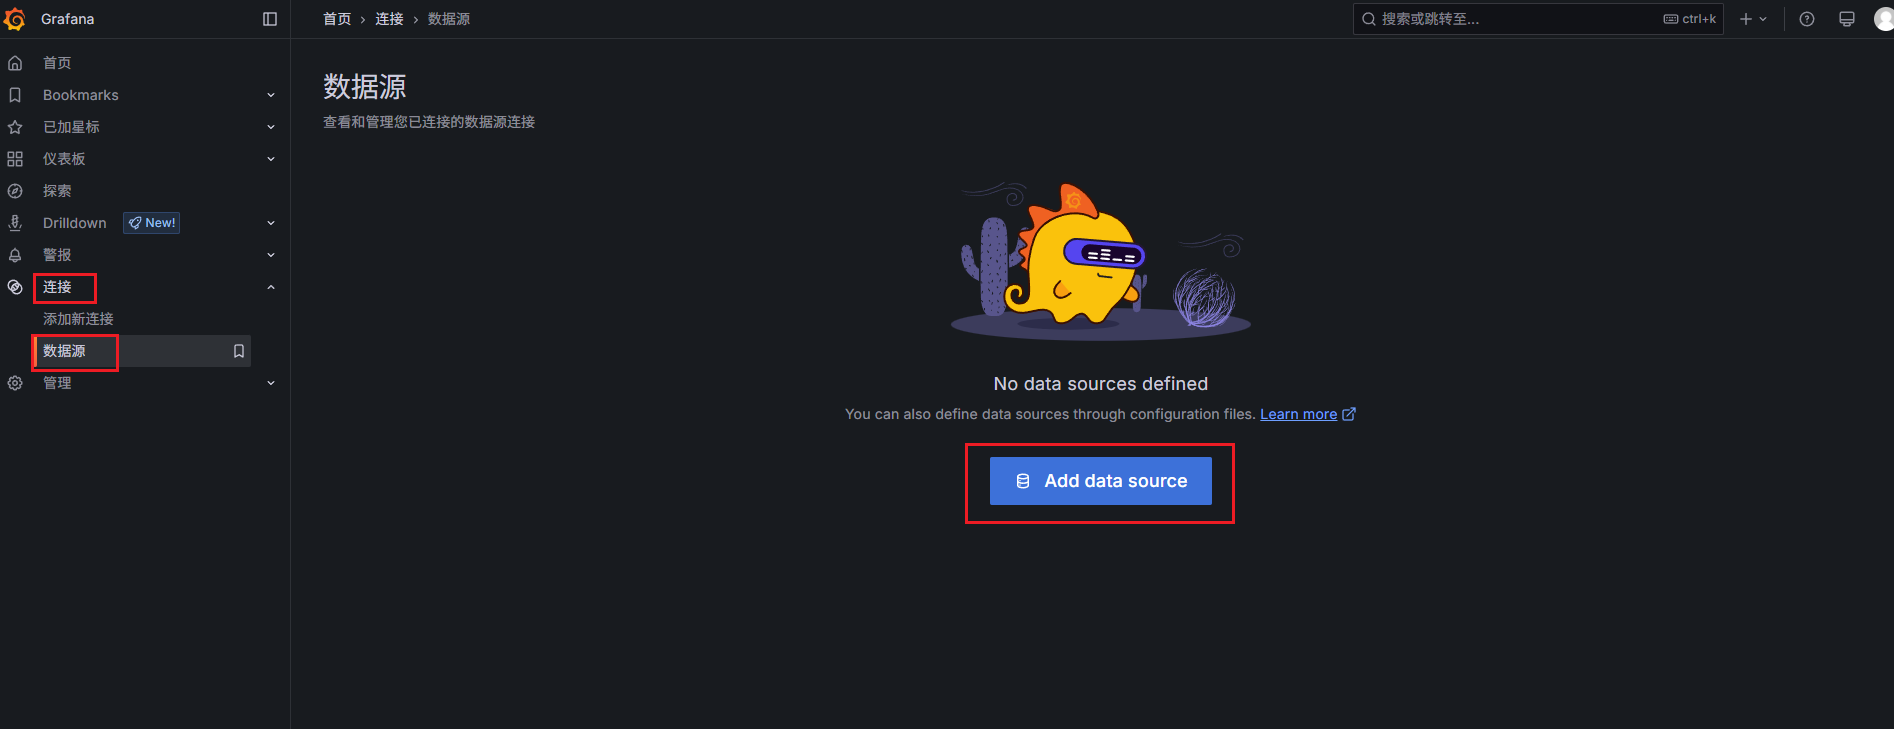
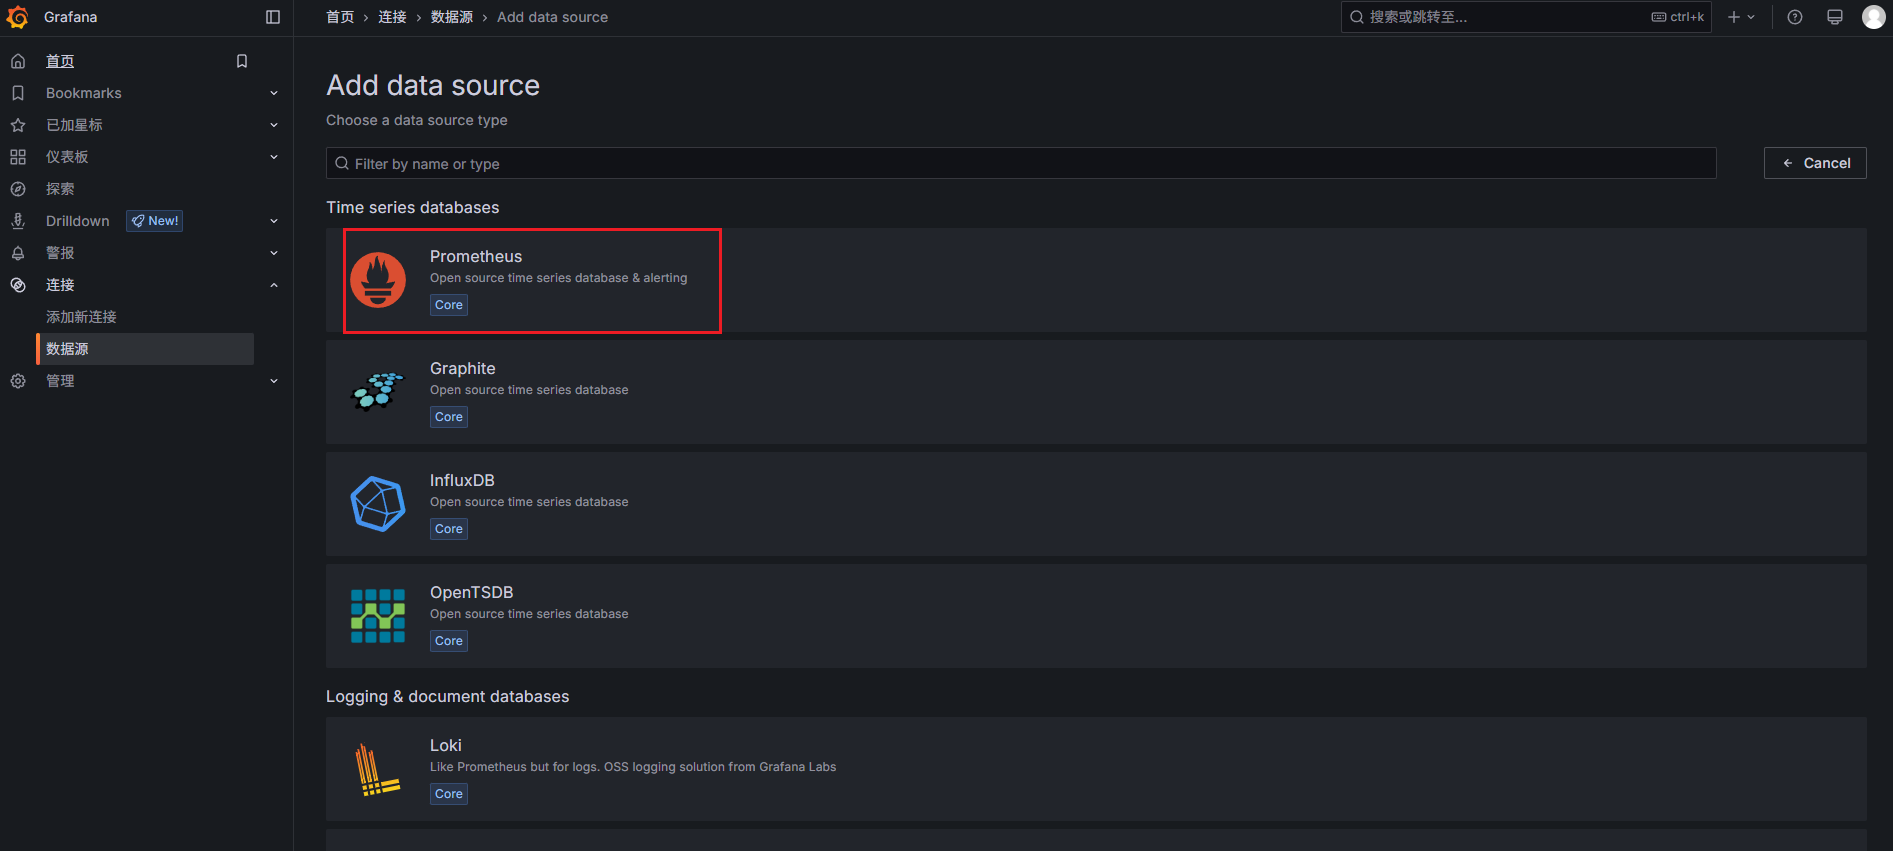
添加数据源:
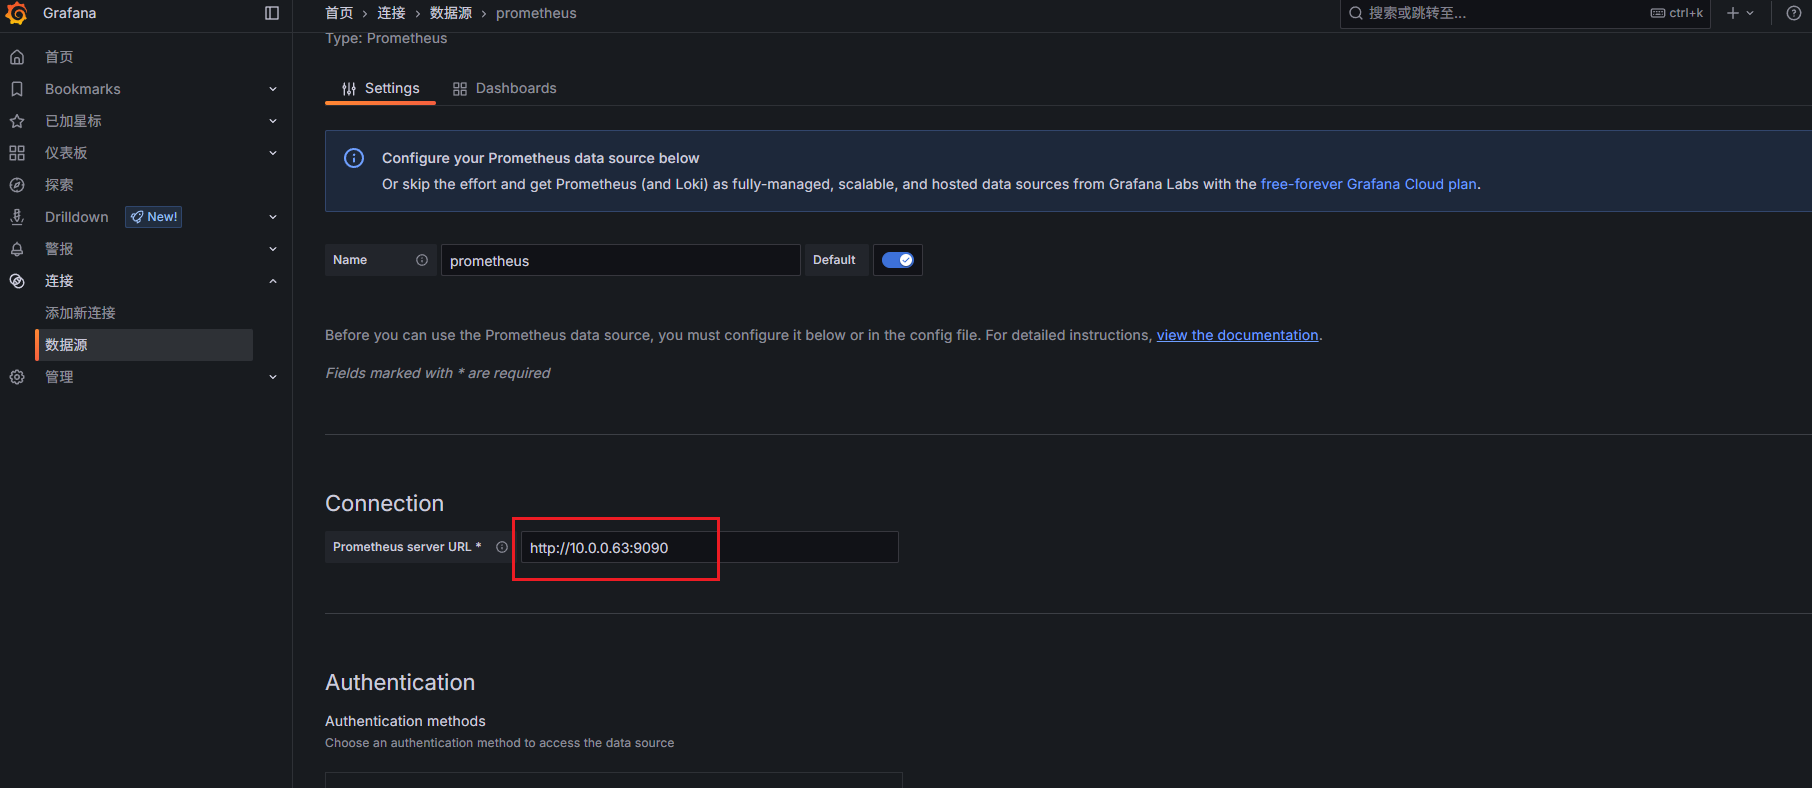
选择prometheus:
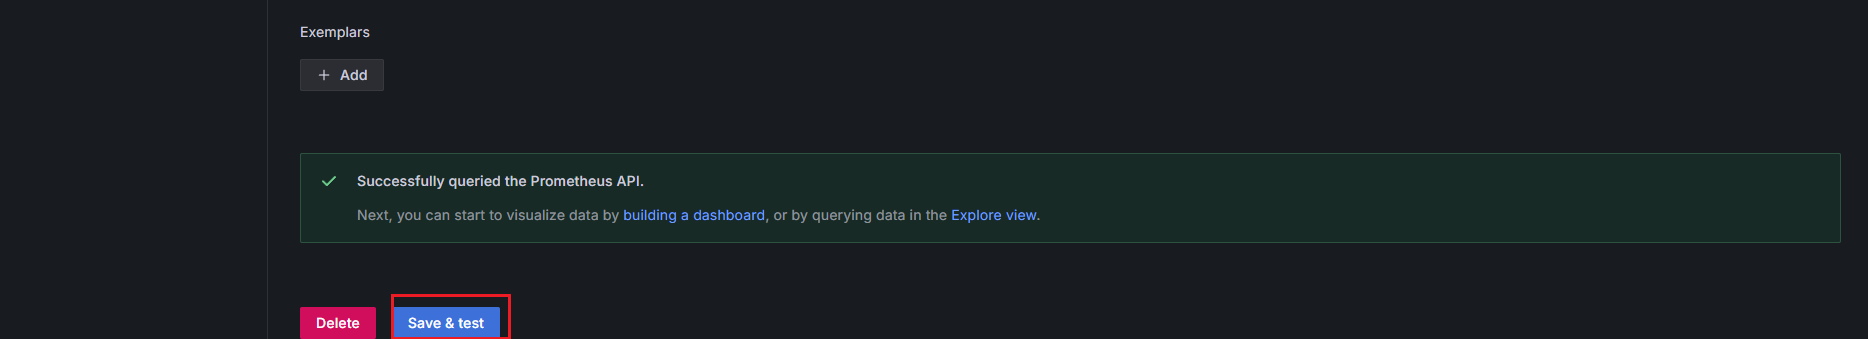
添加成功:
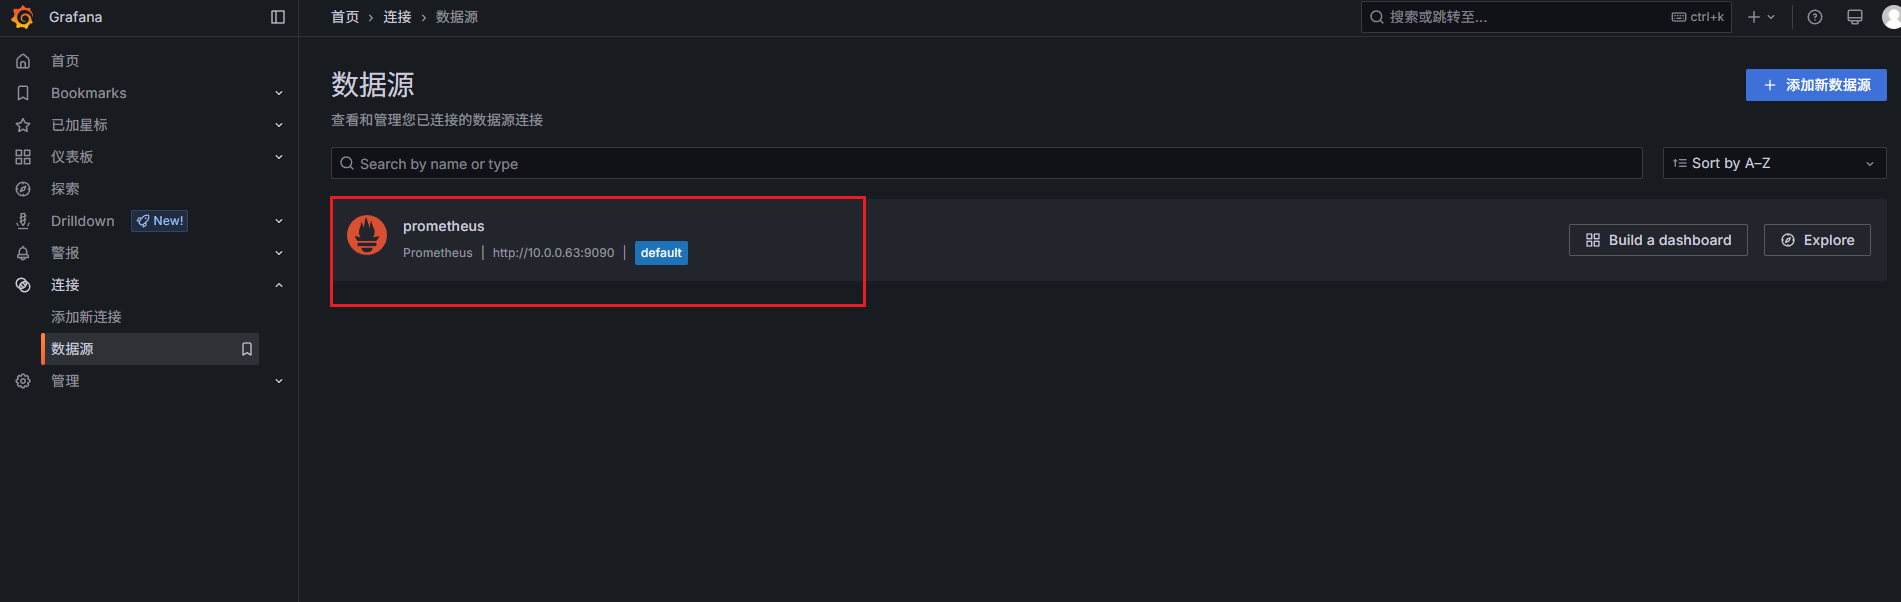
查看当前添加的数据源:


 浙公网安备 33010602011771号