


VASP+Phono3py计算声子linewidth
以ZrH2为例.
1.
post-processing:
计算linewidth at different q-points:
phono3py --fc3 --fc2 --dim="2 2 2" --loglevel=2 --mesh="64 64 64" -c POSCAR-unitcell --ga="0 0 0 1 1 1 2 2 2 3 3 3 4 4 4 5 5 5 6 6 6 7 7 7 8 8 8 9 9 9 10 10 10 11 11 11 12 12 12 13 13 13 14 14 14 15 15 15 16 16 16 17 17 17 18 18 18 19 19 19 20 20 20 21 21 21 22 22 22 23 23 23 24 24 24 25 25 25 26 26 26 27 27 27 28 28 28 29 29 29 30 30 30 31 31 31 32 32 32" --lw --bi="1,2,3,4,5,6,7,8,9,10,11,12,13,14,15,16,17,18"
这样会对BZ取64*64*64个点,然后算ga中每三个数值决定的一个q点.
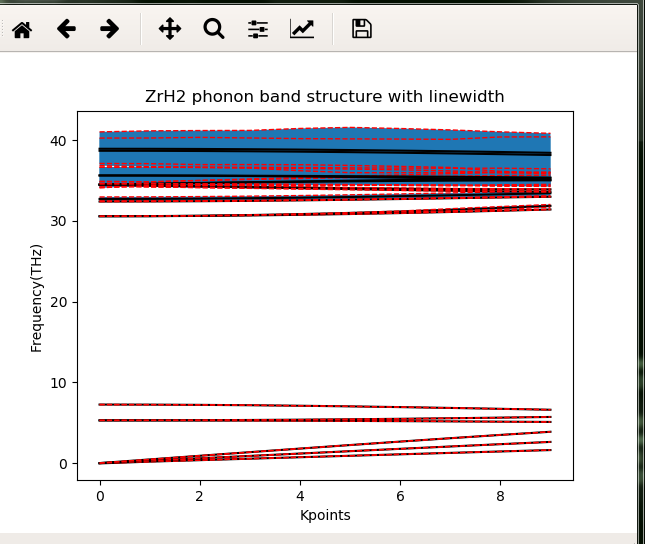
画出phonon linewidth 分布图:
  1 #!/usr/bin/env python
  2
  3 import os
  4 import sys
  5 import numpy as np
  6 import matplotlib.pyplot as plt
  7
  8 lw_dir = "linewidth"
  9 freq_file = "m646464.out"
 10 temp = 10 # temperature
 11 lw_factor = 10.0 # magnified factor
 12
 13 def readOutput(file_name):
 14     with open(file_name, 'rb') as f:
 15         all_lines = f.readlines()
 16
 17     all_found = 0
 18     for i in range(len(all_lines)):
 19         if all_found == 3:
 20             break
 21         elif "Mesh sampling" in all_lines[i]:
 22             mesh = map(int, all_lines[i].split()[3:6])
 23             all_found += 1
 24         elif "Band indices" in all_lines[i]:
 25             band_index = map(int, all_lines[i].replace('[','').replace(']','').split()[2:])
 26             all_found += 1
 27         elif "Grid point to" in all_lines[i]:
 28             gp_index = map(int, all_lines[i+1].split()[:])
 29             all_found += 1
 30
 31     return mesh, band_index, gp_index
 32
 33 def getLW(grid_index, temp, mesh, n_band):
 34     lw_grid = []
 35     mesh_file_name = ''.join(map(str, mesh))
 36     for i in range(n_band):
 37         file_name = os.path.join(lw_dir, 'linewidth-m'+mesh_file_name+'-g'+str(grid_index)+'-b'+str(i+1)+'.dat')
 38         with open(file_name, 'rb') as f:
 39             all_lines = f.readlines()
 40
 41         for line in all_lines:
 42             # add space and 0000 to avoid alias
 43             if (" "+str(float(temp))+"0000") in line:
 44                 lw_grid.append(float(line.split()[-1]))
 45
 46     if len(lw_grid) != n_band:
 47         print("Error!\n")
 48         sys.exit(1)
 49
 50     return lw_grid
 51
 52 def getFreq(grid_index, n_band):
 53     freq_grid = []
 54     with open(freq_file, 'rb') as f:
 55        all_lines = f.readlines()
 56
 57     for i in range(len(all_lines)):
 58         if " Grid point" in all_lines[i] and int(all_lines[i].split()[3]) == grid_index:
 59             # may have different lines for this data block
 60             for j in range(i+5, i+9):
 61                 freq_grid.extend(map(float, all_lines[j].strip().lstrip('[').rstrip(']').split()[:]))
 62             if ']' not in all_lines[i+8]:
 63                 freq_grid.extend(map(float, all_lines[i+9].strip().lstrip('[').rstrip(']').split()[:]))
 64
 65     if len(freq_grid) != n_band:
 66         print("Error!\n")
 67         sys.exit(1)
 68
 69     return freq_grid
 70
 71
 72 # Main routine
 73 mesh, band_index, gp_index = readOutput(freq_file)
 74
 75 freq = []
 76 lw = []
 77 n_band = len(band_index)
 78 x = range(len(gp_index))
 79
 80 for grid_index in gp_index:
 81     lw_tmp = getLW(grid_index, temp, mesh, n_band)
 82     lw.append(lw_tmp)
 83
 84     freq_tmp = getFreq(grid_index, n_band)
 85     freq.append(freq_tmp)
 86
 87 lw_upper = np.add(freq, 0.5*lw_factor*np.array(lw))
 88 lw_lower = np.add(freq, -0.5*lw_factor*np.array(lw))
 89
 90 freq_plot = zip(*freq)
 91 lw_plot = zip(*lw)
 92 lw_upper_plot = zip(*lw_upper)
 93 lw_lower_plot = zip(*lw_lower)
 94
 95 fig,ax = plt.subplots()
 96 for i in range(n_band):
 97     ax.plot(x, freq_plot[i], color='black')
 98     ax.plot(x, lw_upper_plot[i], x, lw_lower_plot[i], linestyle='--', linewidth=1, color='red')
 99     ax.fill_between(x, lw_upper_plot[i], lw_lower_plot[i], where=np.array(lw_upper_plot[i]) >= np.array(lw_lower_plot[i]), facecolor=None, interpolate=True)
100     #ax.fill_between(x, lw_upper_plot[i], lw_lower_plot[i], where=np.array(lw_upper_plot[i]) >= np.array(lw_lower_plot[i]), markerfacecolor="None", interpolate=True)
101 ax.set_title('ZrH2 phonon band structure with linewidth')
102 ax.set_xlabel('Kpoints')
103 ax.set_ylabel('Frequency(THz)')
104 plt.show()

 浙公网安备 33010602011771号