
爬取前程无忧官网 搜索大数据职位信息
1.主题式网络爬虫名称:爬取前程无忧官网 搜索大数据职位信息
2.主题式网络爬虫爬取的内容与数据特征分析:爬取前程无忧官网 搜索大数据职位信息
3.主题式网络爬虫设计方案概述(包括实现思路与技术难点)
思路:通过按f12查找页面的源代码,找到所需代码处在的标签,通过爬虫处理将所需代码保存到excel文件内,再进行清洗,分析以及数据可视化的处理。
二、主题页面的结构特征分析
1.主题页面的结构与特征分析

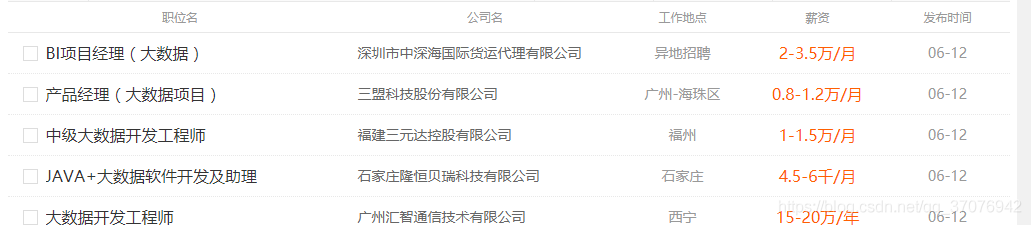
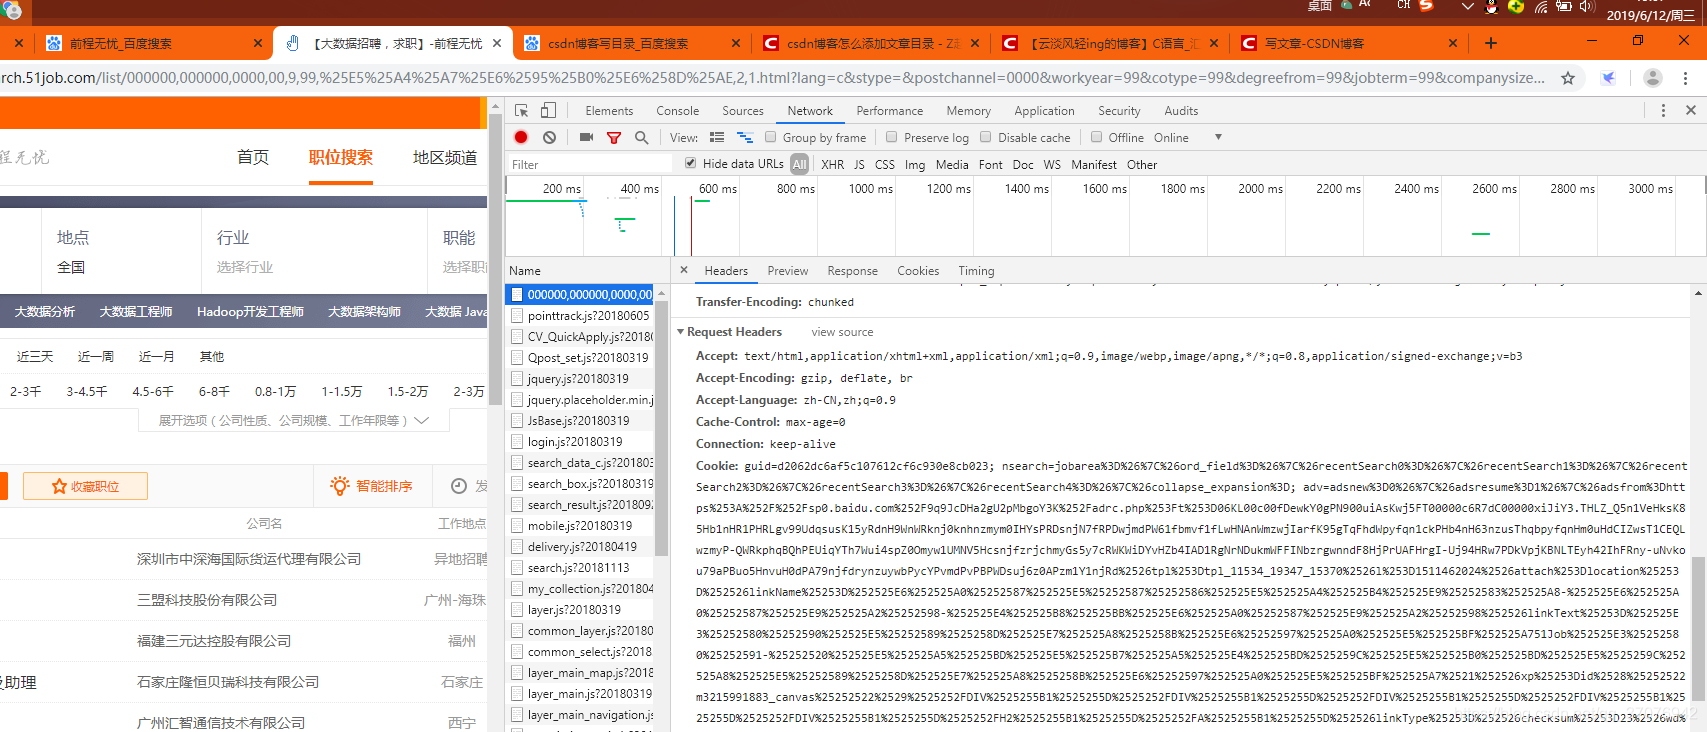
2.Htmls页面解析
三、网络爬虫程序设计
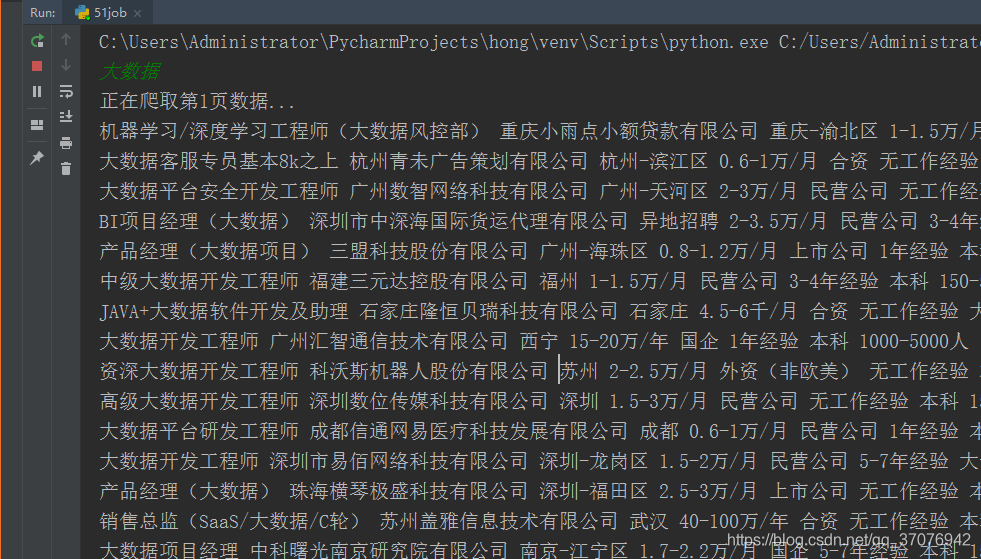
1.数据爬取与采集
import urllib.request import xlwt import re import urllib.parse import time header={ 'Host':'search.51job.com', 'Upgrade-Insecure-Requests':'1', 'User-Agent':'Mozilla/5.0 (Windows NT 10.0; Win64; x64) AppleWebKit/537.36 (KHTML, like Gecko) Chrome/78.0.3904.108 Safari/537.36' } def getfront(page,item): #page是页数,item是输入的字符串,见后文 result = urllib.parse.quote(item) #先把字符串转成十六进制编码 ur1 = result+',2,'+ str(page)+'.html' ur2 = 'https://search.51job.com/list/000000,000000,0000,00,9,99,' res = ur2+ur1 #拼接网址 a = urllib.request.urlopen(res) html = a.read().decode('gbk') # 读取源代码并转为unicode return html def getInformation(html): reg = re.compile(r'class="t1 ">.*? <a target="_blank" title="(.*?)" href="(.*?)".*? <span class="t2"><a target="_blank" title="(.*?)" href="(.*?)".*?<span class="t3">(.*?)</span>.*?<span class="t4">(.*?)</span>.*?<span class="t5">(.*?)</span>.*?',re.S)#匹配换行符 items=re.findall(reg,html) return items #新建表格空间 excel1 = xlwt.Workbook() # 设置单元格格式 sheet1 = excel1.add_sheet('Job', cell_overwrite_ok=True) sheet1.write(0, 0, '序号') sheet1.write(0, 1, '职位') sheet1.write(0, 2, '公司名称') sheet1.write(0, 3, '公司地点') sheet1.write(0, 4, '公司性质') sheet1.write(0, 5, '薪资') sheet1.write(0, 6, '学历要求') sheet1.write(0, 7, '工作经验') sheet1.write(0, 8, '公司规模') sheet1.write(0, 9, '公司类型') sheet1.write(0, 10,'公司福利') sheet1.write(0, 11,'发布时间') number = 1 item = input() for j in range(1,10000): #页数自己随便改 try: print("正在爬取第"+str(j)+"页数据...") html = getfront(j,item) #调用获取网页原码 for i in getInformation(html): try: url1 = i[1] #职位网址 res1 = urllib.request.urlopen(url1).read().decode('gbk') company = re.findall(re.compile(r'<div class="com_tag">.*?<p class="at" title="(.*?)"><span class="i_flag">.*?<p class="at" title="(.*?)">.*?<p class="at" title="(.*?)">.*?',re.S),res1) job_need = re.findall(re.compile(r'<p class="msg ltype".*?>.*? <span>|</span> (.*?) <span>|</span> (.*?) <span>|</span> .*?</p>',re.S),res1) welfare = re.findall(re.compile(r'<span class="sp4">(.*?)</span>',re.S),res1) print(i[0],i[2],i[4],i[5],company[0][0],job_need[2][0],job_need[1][0],company[0][1],company[0][2],welfare,i[6]) sheet1.write(number,0,number) sheet1.write(number,1,i[0]) sheet1.write(number,2,i[2]) sheet1.write(number,3,i[4]) sheet1.write(number,4,company[0][0]) sheet1.write(number,5,i[5]) sheet1.write(number,6,job_need[1][0]) sheet1.write(number,7,job_need[2][0]) sheet1.write(number,8,company[0][1]) sheet1.write(number,9,company[0][2]) sheet1.write(number,10,(" ".join(str(i) for i in welfare))) sheet1.write(number,11,i[6]) number+=1 excel1.save("51job.xls") time.sleep(0.3) #休息间隔,避免爬取海量数据时被误判为攻击,IP遭到封禁 except: pass except: pass

2.对数据进行清洗和处理
#coding:utf-8
import pandas as pd
import re
#除此之外还要安装xlrd包

data = pd.read_excel(r'51job.xls',sheet_name='Job')
result = pd.DataFrame(data)
a = result.dropna(axis=0,how='any')
pd.set_option('display.max_rows',None)     #输出全部行,不省略
b = u'数据'
number = 1
li = a['职位']
for i in range(0,len(li)):
    try:
        if b in li[i]:
            #print(number,li[i])
            number+=1
        else:
            a = a.drop(i,axis=0)
    except:
        pass
b2= u'人'
li2 = a['学历要求']
for i in range(0,len(li2)):
    try:
        if b2 in li2[i]:
            #print(number,li2[i])
            number+=1
            a = a.drop(i,axis=0)
    except:
        pass
b3 =u'万/年'
b4 =u'千/月'
li3 = a['薪资']
#注释部分的print都是为了调试用的
for i in range(0,len(li3)):
    try:
        if b3 in li3[i]:
            x = re.findall(r'\d*\.?\d+',li3[i])
            #print(x)
            min_ = format(float(x[0])/12,'.2f')              #转换成浮点型并保留两位小数
            max_ = format(float(x[1])/12,'.2f')
            li3[i][1] = min_+'-'+max_+u'万/月'
        if b4 in li3[i]:
            x = re.findall(r'\d*\.?\d+',li3[i])
            #print(x)
            #input()
            min_ = format(float(x[0])/10,'.2f')
            max_ = format(float(x[1])/10,'.2f')
            li3[i][1] = str(min_+'-'+max_+'万/月')
        print(i,li3[i])

    except:
        pass
a.to_excel('51job2.xls', sheet_name='Job', index=False)
3.数据分析与可视化(例如:数据柱形图、直方图、散点图、盒图、分布图)
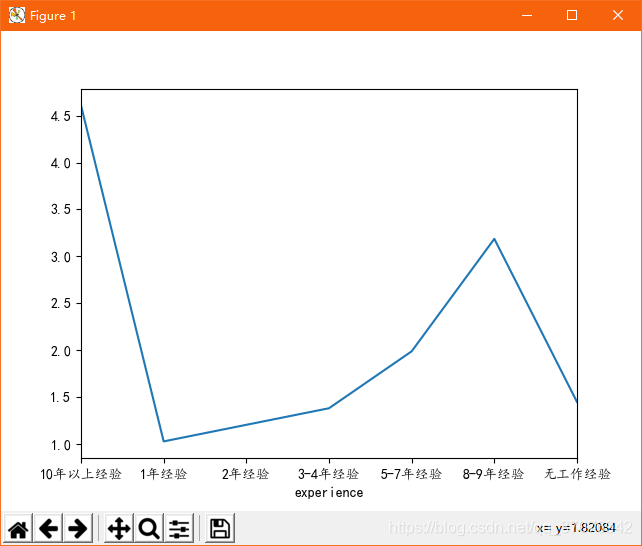
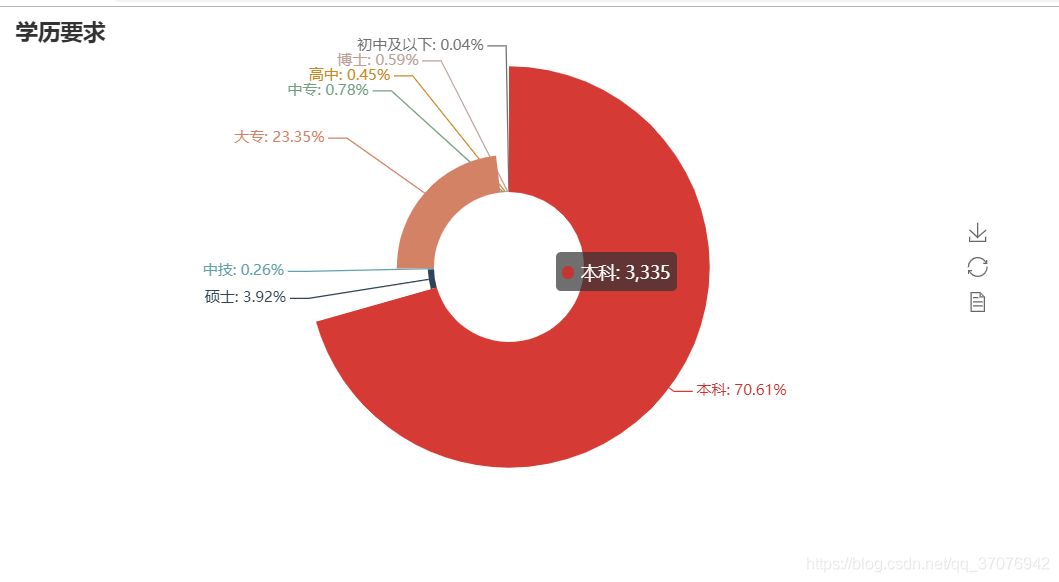
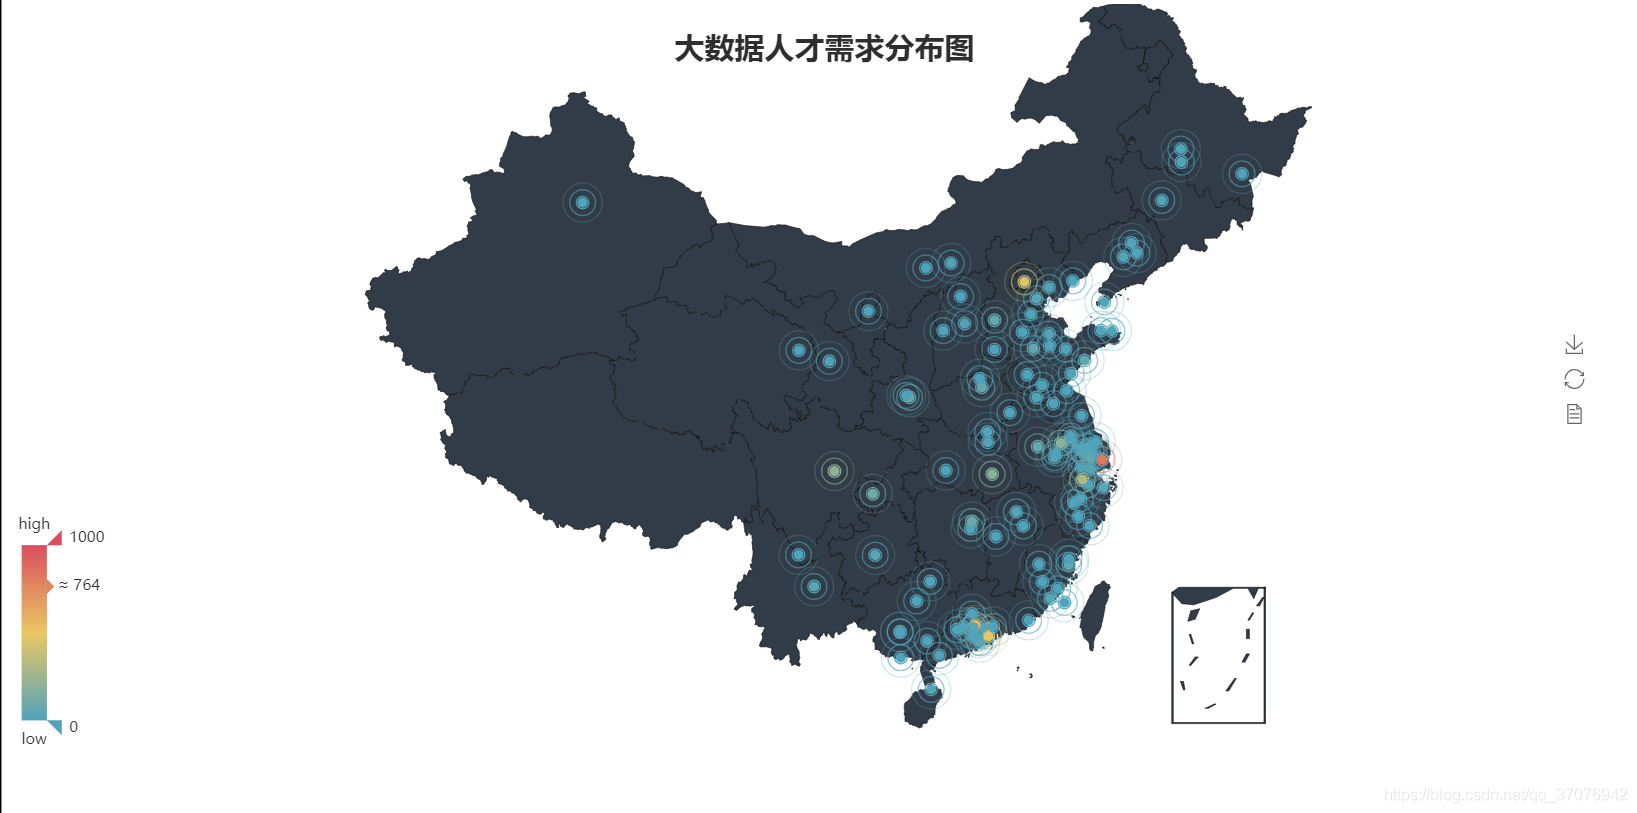
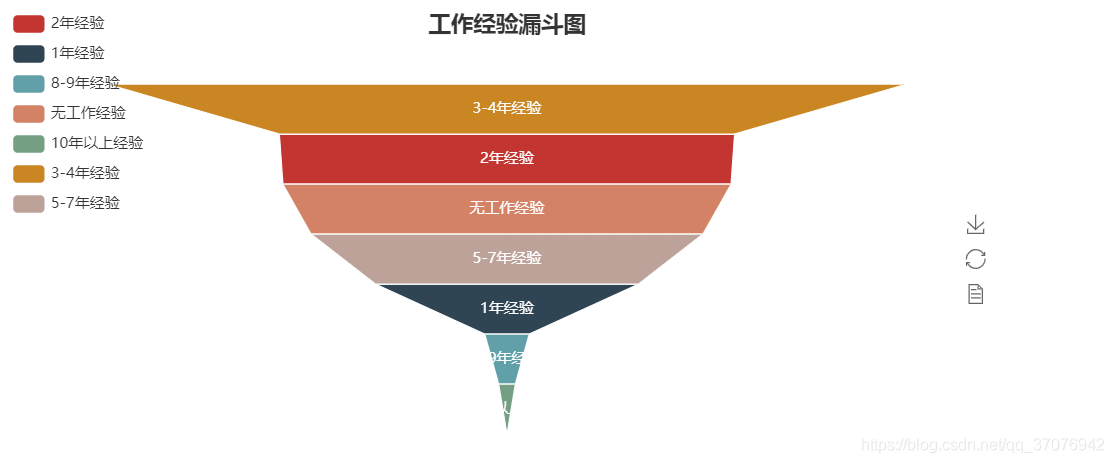
# -*- coding: utf-8 -*-
import pandas as pd
import re
from pyecharts import Funnel,Pie,Geo
import matplotlib.pyplot as plt
file = pd.read_excel(r'51job2.xls',sheet_name='Job')
f = pd.DataFrame(file)
pd.set_option('display.max_rows',None)
add = f['公司地点']
sly = f['薪资']
edu = f['学历要求']
exp = f['工作经验']
address =[]
salary = []
education = []
experience = []
for i in range(0,len(f)):
    try:
        a = add[i].split('-')
        address.append(a[0])
        #print(address[i])
        s = re.findall(r'\d*\.?\d+',sly[i])
        s1= float(s[0])
        s2 =float(s[1])
        salary.append([s1,s2])
        #print(salary[i])
        education.append(edu[i])
        #print(education[i])
        experience.append(exp[i])
        #print(experience[i])
    except:
       pass
min_s=[]                            #定义存放最低薪资的列表
max_s=[]                            #定义存放最高薪资的列表
for i in range(0,len(experience)):
    min_s.append(salary[i][0])
    max_s.append(salary[i][0])

my_df = pd.DataFrame({'experience':experience, 'min_salay' : min_s, 'max_salay' : max_s})                #关联工作经验与薪资
data1 = my_df.groupby('experience').mean()['min_salay'].plot(kind='line')
plt.show()
my_df2 = pd.DataFrame({'education':education, 'min_salay' : min_s, 'max_salay' : max_s})                #关联学历与薪资
data2 = my_df2.groupby('education').mean()['min_salay'].plot(kind='line')
plt.show()
def get_edu(list):
    education2 = {}
    for i in set(list):
        education2[i] = list.count(i)
    return education2
dir1 = get_edu(education)
# print(dir1)

attr= dir1.keys()
value = dir1.values()
pie = Pie("学历要求")
pie.add("", attr, value, center=[50, 50], is_random=False, radius=[30, 75], rosetype='radius',
        is_legend_show=False, is_label_show=True,legend_orient='vertical')
pie.render('学历要求玫瑰图.html')
def get_address(list):
    address2 = {}
    for i in set(list):
        address2[i] = list.count(i)
    address2.pop('异地招聘')
    # 有些地名可能不合法或者地图包里没有可以自行删除,之前以下名称都会报错,现在好像更新了
    #address2.pop('山东')
    #address2.pop('怒江')
    #address2.pop('池州')
    return address2
dir2 = get_address(address)
#print(dir2)

geo = Geo("大数据人才需求分布图", title_color="#2E2E2E",
          title_text_size=24,title_top=20,title_pos="center", width=1300,height=600)
attr2 = dir2.keys()
value2 = dir2.values()
geo.add("",attr2, value2, type="effectScatter", is_random=True, visual_range=[0, 1000], maptype='china',symbol_size=8, effect_scale=5, is_visualmap=True)
geo.render('大数据城市需求分布图.html')
def get_experience(list):
    experience2 = {}
    for i in set(list):
         experience2[i] = list.count(i)
    return experience2
dir3 = get_experience(experience)
#print(dir3)

attr3= dir3.keys()
value3 = dir3.values()
funnel = Funnel("工作经验漏斗图",title_pos='center')
funnel.add("", attr3, value3,is_label_show=True,label_pos="inside", label_text_color="#fff",legend_orient='vertical',legend_pos='left')
funnel.render('工作经验要求漏斗图.html')


5.根据数据之间的关系,分析两个变量之间的相关系数,画出散点图,并建立变量之间的回归方程(一元或多元)(10分)。
X = df.score
Y = df.Numbers
def func(params, x):
        a, b, c = params
        return a*x*x+b*x+c
def error(params,x,y):
     return func(params,x)-y
def main(a,b,c):
    p0 = [0,0,0]
    Para=leastsq(error,p0,args=(X,Y))
    a,b,c=Para[0]
    print("a=",a,"b=",b,"c=",c)
    plt.scatter(X,Y,color="green",label=u"评分分布",linewidth=2)
    x=np.linspace(0,30,20)
    y=a*x*x+b*x+c
    plt.plot(x,y,color="red",label=u"回归方程直线",linewidth=2)
    plt.title("大数据职位信息关系图")
    plt.legend()
    plt.grid()
    plt.show()
main()
#一元二次回归方程
7.将以上各部分的代码汇总,附上完整程序代码
# -*- coding:utf-8 -*- import urllib.request import xlwt import re import urllib.parse import time header={ 'Host':'search.51job.com', 'Upgrade-Insecure-Requests':'1', 'User-Agent':'Mozilla/5.0 (Windows NT 10.0; Win64; x64) AppleWebKit/537.36 (KHTML, like Gecko) Chrome/78.0.3904.108 Safari/537.36' } def getfront(page,item): #page是页数,item是输入的字符串 result = urllib.parse.quote(item) #先把字符串转成十六进制编码 ur1 = result+',2,'+ str(page)+'.html' ur2 = 'https://search.51job.com/list/000000,000000,0000,00,9,99,' res = ur2+ur1 #拼接网址 a = urllib.request.urlopen(res) html = a.read().decode('gbk') # 读取源代码并转为unicode return html def getInformation(html): reg = re.compile(r'class="t1 ">.*? <a target="_blank" title="(.*?)" href="(.*?)".*? <span class="t2"><a target="_blank" title="(.*?)" href="(.*?)".*?<span class="t3">(.*?)</span>.*?<span class="t4">(.*?)</span>.*?<span class="t5">(.*?)</span>.*?',re.S)#匹配换行符 items=re.findall(reg,html) return items #新建表格空间 excel1 = xlwt.Workbook() # 设置单元格格式 sheet1 = excel1.add_sheet('Job', cell_overwrite_ok=True) sheet1.write(0, 0, '序号') sheet1.write(0, 1, '职位') sheet1.write(0, 2, '公司名称') sheet1.write(0, 3, '公司地点') sheet1.write(0, 4, '公司性质') sheet1.write(0, 5, '薪资') sheet1.write(0, 6, '学历要求') sheet1.write(0, 7, '工作经验') sheet1.write(0, 8, '公司规模') sheet1.write(0, 9, '公司类型') sheet1.write(0, 10,'公司福利') sheet1.write(0, 11,'发布时间') number = 1 item = input() for j in range(1,10000): #页数自己随便改 try: print("正在爬取第"+str(j)+"页数据...") html = getfront(j,item) #调用获取网页原码 for i in getInformation(html): try: url1 = i[1] #职位网址 res1 = urllib.request.urlopen(url1).read().decode('gbk') company = re.findall(re.compile(r'<div class="com_tag">.*?<p class="at" title="(.*?)"><span class="i_flag">.*?<p class="at" title="(.*?)">.*?<p class="at" title="(.*?)">.*?',re.S),res1) job_need = re.findall(re.compile(r'<p class="msg ltype".*?>.*? <span>|</span> (.*?) <span>|</span> (.*?) <span>|</span> .*?</p>',re.S),res1) welfare = re.findall(re.compile(r'<span class="sp4">(.*?)</span>',re.S),res1) print(i[0],i[2],i[4],i[5],company[0][0],job_need[2][0],job_need[1][0],company[0][1],company[0][2],welfare,i[6]) sheet1.write(number,0,number) sheet1.write(number,1,i[0]) sheet1.write(number,2,i[2]) sheet1.write(number,3,i[4]) sheet1.write(number,4,company[0][0]) sheet1.write(number,5,i[5]) sheet1.write(number,6,job_need[2][0]) sheet1.write(number,7,job_need[1][0]) sheet1.write(number,8,company[0][1]) sheet1.write(number,9,company[0][2]) sheet1.write(number,10,(" ".join(str(i) for i in welfare))) sheet1.write(number,11,i[6]) number+=1 excel1.save("51job.xls") time.sleep(0.3) #休息间隔,避免爬取海量数据时被误判为攻击,IP遭到封禁 except: pass except: pass #coding:utf-8 import pandas as pd import re data = pd.read_excel(r'51job.xls',sheet_name='Job') result = pd.DataFrame(data) a = result.dropna(axis=0,how='any') pd.set_option('display.max_rows',None) #输出全部行,不省略 b = u'数据' number = 1 li = a['职位'] for i in range(0,len(li)): try: if b in li[i]: #print(number,li[i]) number+=1 else: a = a.drop(i,axis=0) #删除整行 except: pass b2 = '人' li2 = a['学历要求'] for i in range(0,len(li2)): try: if b2 in li2[i]: # print(number,li2[i]) number += 1 a = a.drop(i, axis=0) except: pass b3 =u'万/年' b4 =u'千/月' li3 = a['薪资'] #注释部分的print都是为了调试用的 for i in range(0,len(li3)): try: if b3 in li3[i]: x = re.findall(r'\d*\.?\d+',li3[i]) #print(x) min_ = format(float(x[0])/12,'.2f') #转换成浮点型并保留两位小数 max_ = format(float(x[1])/12,'.2f') li3[i][1] = min_+'-'+max_+u'万/月' if b4 in li3[i]: x = re.findall(r'\d*\.?\d+',li3[i]) #print(x) #input() min_ = format(float(x[0])/10,'.2f') max_ = format(float(x[1])/10,'.2f') li3[i][1] = str(min_+'-'+max_+'万/月') print(i,li3[i]) except: pass a.to_excel('51job2.xls', sheet_name='Job', index=False) ############################################################################################# import pandas as pd import re from pyecharts import Funnel,Pie,Geo import matplotlib.pyplot as plt file = pd.read_excel(r'51job2.xls',sheet_name='Job') f = pd.DataFrame(file) pd.set_option('display.max_rows',None) add = f['公司地点'] sly = f['薪资'] edu = f['学历要求'] exp = f['工作经验'] address =[] salary = [] education = [] experience = [] for i in range(0,len(f)): try: a = add[i].split('-') address.append(a[0]) #print(address[i]) s = re.findall(r'\d*\.?\d+',sly[i]) s1= float(s[0]) s2 =float(s[1]) salary.append([s1,s2]) #print(salary[i]) education.append(edu[i]) #print(education[i]) experience.append(exp[i]) #print(experience[i]) except: pass min_s=[] #定义存放最低薪资的列表 max_s=[] #定义存放最高薪资的列表 for i in range(0,len(experience)): min_s.append(salary[i][0]) max_s.append(salary[i][0]) #matplotlib模块如果显示不了中文字符串可以用以下代码。 plt.rcParams['font.sans-serif'] = ['KaiTi'] # 指定默认字体 plt.rcParams['axes.unicode_minus'] = False # 解决保存图像是负号'-'显示为方块的问题 my_df = pd.DataFrame({'experience':experience, 'min_salay' : min_s, 'max_salay' : max_s}) #关联工作经验与薪资 data1 = my_df.groupby('experience').mean()['min_salay'].plot(kind='line') plt.show() my_df2 = pd.DataFrame({'education':education, 'min_salay' : min_s, 'max_salay' : max_s}) #关联学历与薪资 data2 = my_df2.groupby('education').mean()['min_salay'].plot(kind='line') plt.show() def get_edu(list): education2 = {} for i in set(list): education2[i] = list.count(i) return education2 dir1 = get_edu(education) # print(dir1) attr= dir1.keys() value = dir1.values() pie = Pie("学历要求") pie.add("", attr, value, center=[50, 50], is_random=False, radius=[30, 75], rosetype='radius', is_legend_show=False, is_label_show=True,legend_orient='vertical') pie.render('学历要求玫瑰图.html') def get_address(list): address2 = {} for i in set(list): address2[i] = list.count(i) address2.pop('异地招聘') # 有些地名可能不合法或者地图包里没有可以自行删除,之前以下名称都会报错,现在好像更新了 #address2.pop('山东') #address2.pop('怒江') #address2.pop('池州') return address2 dir2 = get_address(address) #print(dir2) geo = Geo("大数据人才需求分布图", title_color="#2E2E2E", title_text_size=24,title_top=20,title_pos="center", width=1300,height=600) attr2 = dir2.keys() value2 = dir2.values() geo.add("",attr2, value2, type="effectScatter", is_random=True, visual_range=[0, 1000], maptype='china',symbol_size=8, effect_scale=5, is_visualmap=True) geo.render('大数据城市需求分布图.html') def get_experience(list): experience2 = {} for i in set(list): experience2[i] = list.count(i) return experience2 dir3 = get_experience(experience) #print(dir3) attr3= dir3.keys() value3 = dir3.values() funnel = Funnel("工作经验漏斗图",title_pos='center') funnel.add("", attr3, value3,is_label_show=True,label_pos="inside", label_text_color="#fff",legend_orient='vertical',legend_pos='left') funnel.render('工作经验要求漏斗图.html') X = df.score Y = df.Numbers def func(params, x): a, b, c = params return a*x*x+b*x+c def error(params,x,y): return func(params,x)-y def main(a,b,c): p0 = [0,0,0] Para=leastsq(error,p0,args=(X,Y)) a,b,c=Para[0] print("a=",a,"b=",b,"c=",c) plt.scatter(X,Y,color="green",label=u"评分分布",linewidth=2) x=np.linspace(0,30,20) y=a*x*x+b*x+c plt.plot(x,y,color="red",label=u"回归方程直线",linewidth=2) plt.title("大数据职位信息关系图") plt.legend() plt.grid() plt.show() main() #一元二次回归方程
1.经过对主题数据的分析与可视化,可以得到哪些结论?
经过对主题数据的分析与可视化可以更直观的了解数据
2.对本次程序设计任务完成的情况做一个简单的小结。
通过此次作业了解到了对于函数熟悉应用重要性
对代码不断的修改,对于python有进一步的认识,我明白了数据的分析与可视化,掌握了不少库的使用,加深了对python的热爱通过这次做题任务,我在完成的过程中遇到了很多的困难,让我得到了许多收获,也让我充分的认识到了自己的不足之处!

