Linux Grafana+Prometheus搭建实战
一、服务端-Grafana
-
安装grafana
sudo yum install -y https://dl.grafana.com/enterprise/release/grafana-enterprise-9.5.1-1.x86_64.rpm -
启动
systemctl start grafana-server.service
systemctl status grafana-server.service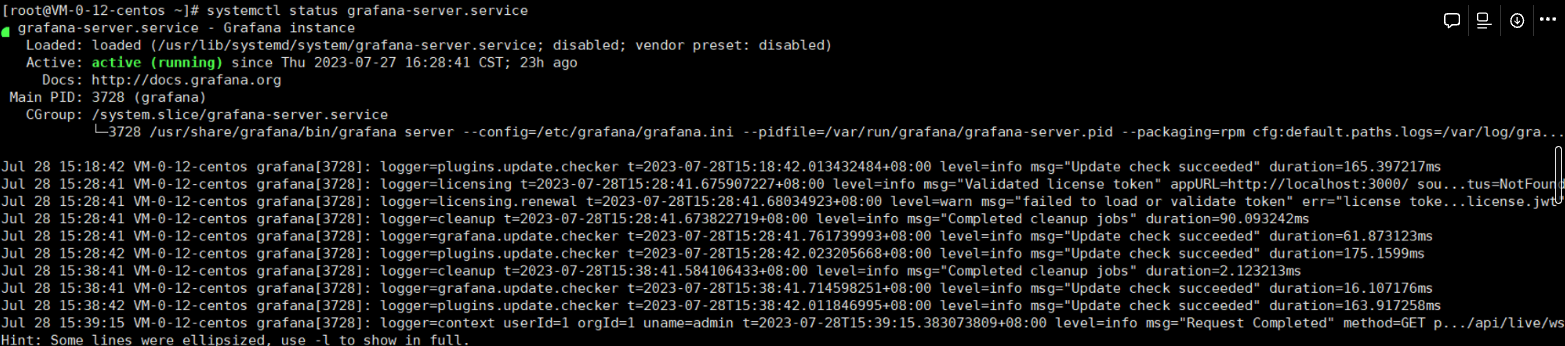
-
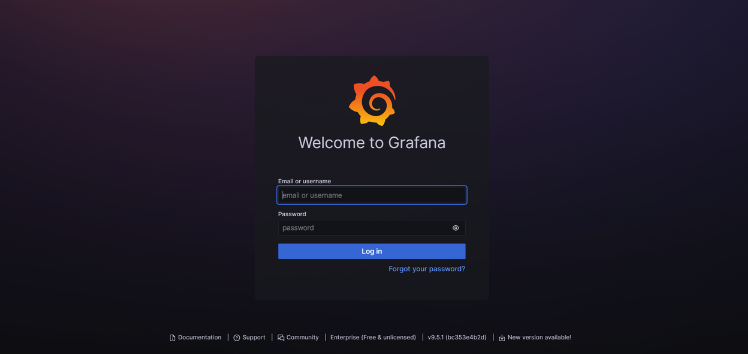
访问默认300端口
默认用户、密码:admin、admin,登陆后可自行进行修改操作
二、prometheus安装
-
官网确认下载版本
-
下载适合版本上传至服务器中
wget https://github.com/prometheus/prometheus/releases/download/v2.46.0/prometheus-2.46.0.linux-amd64.tar.gz -
安装包解压
mkdir /mnt/prometheus cd /mnt/prometheus tar zxf prometheusxxxx.tar.gz 解压 -
修改配置文件
cp prometheus.yml prometheus.yml.bak 备份global: #用于prometheus的全局配置,比如采集间隔,抓取超时时间等 scrape_interval: 15s #采集目标主机监控数据的时间间隔,默认为1m evaluation_interval: 15s #触发告警生成alert的时间间隔,默认是1m # scrape_timeout is set to the global default (10s). scrape_timeout: 10s #数据采集超时时间,默认10s alerting: #用于alertmanager实例的配置,支持静态配置和动态服务发现的机制 alertmanagers: - static_configs: - targets: # - alertmanager:9093 rule_files: #用于加载告警规则相关的文件路径的配置,可以使用文件名通配机制 # - "first_rules.yml" # - "second_rules.yml" scrape_configs: #用于采集时序数据源的配置 # The job name is added as a label `job=<job_name>` to any timeseries scraped from this config. - job_name: "prometheus" #每个被监控实例的集合用job_name命名,支持静态配置(static_configs)和动态服务发现的机制(*_sd_configs) # metrics_path defaults to '/metrics' # scheme defaults to 'http'. static_configs: #静态目标配置,固定从某个target拉取数据 - targets: ["本机地址:9090"] -
启动
# 进入解压后的文件夹 cd /xxxxxx/prometheus/prometheus-xxxxxx.linux-amd64 # 前台启动 ./prometheus --config.file=prometheus.yml # 后台启动prometheus,并且重定向输入日志到当前目录的prometheus.out -推荐 nohup ./prometheus --config.file=prometheus.yml >> /data/prometheus/prometheus-xxxxxxxxx.linux-amd64/prometheus.out 2>&1 & -
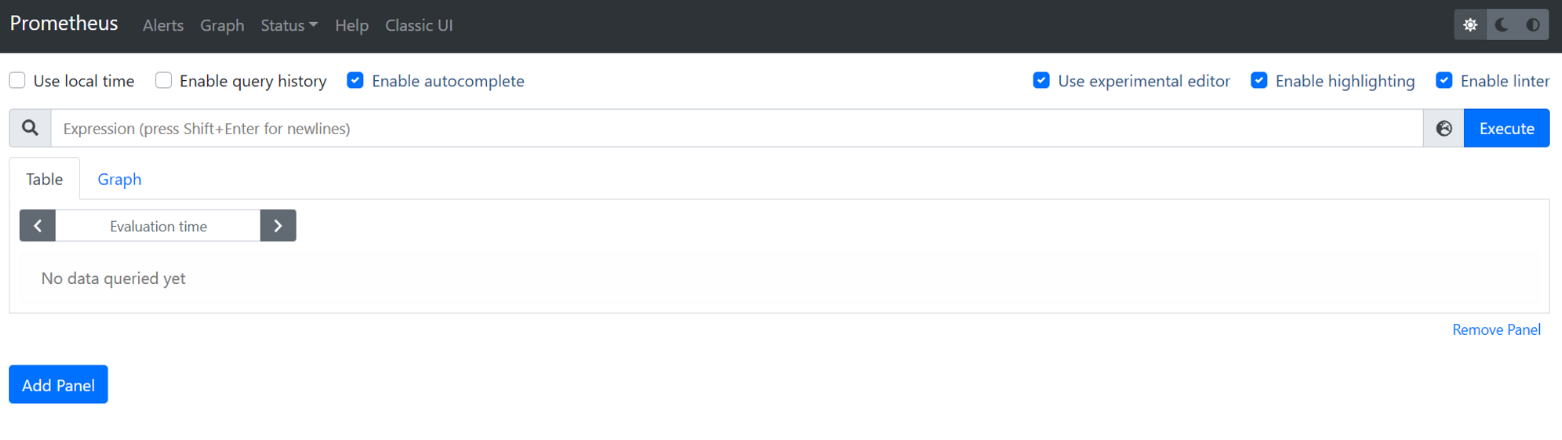
访问prometheus
默认9090端口,访问效果如下
三、exporter插件安装
涉及插件:mysqld_exporter、node_exporter
插件下载地址:https://prometheus.io/download/
-
分别在服务器将安装包下载至服务器
wget https://github.com/prometheus/mysqld_exporter/releases/download/v0.15.0/mysqld_exporter-0.15.0.linux-amd64.tar.gz
wget https://github.com/prometheus/node_exporter/releases/download/v1.6.1/node_exporter-1.6.1.linux-amd64.tar.gz
3.1 node_exporter安装
-
解压并执行
tar xvzf node_exporter-1.6.1.linux-amd64.tar.gz nohup /路径/node_exporter/node_exporter & -
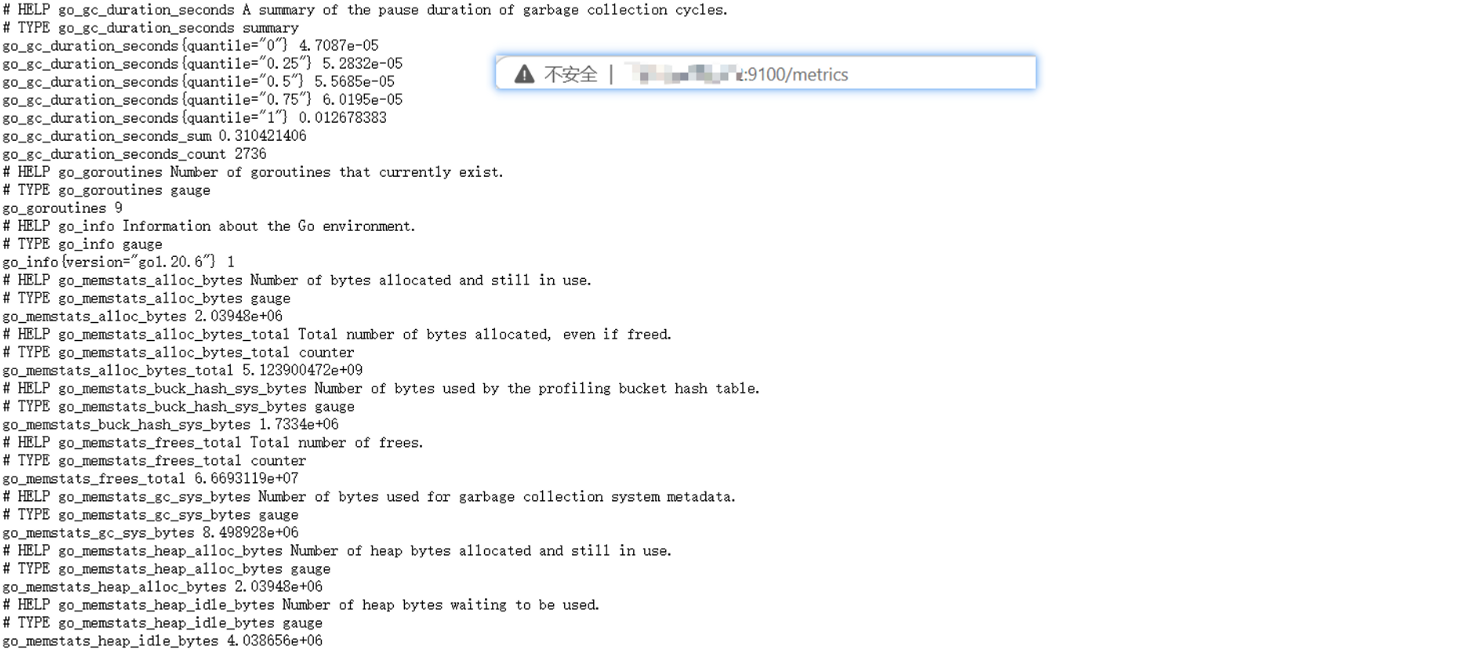
浏览器访问http://IP:9100/metrics就可以查看到node_exporter在被监控端收集的监控信息
-
prometheus服务器的配置文件里添加被监控机器的配置
在主配置文件最后加上下面三行 - job_name: 'agent1' #取一个job名称来代表被监控的机器 static_configs: - targets: ['IP:9100'] # 这里改成被监控机器的IP,后面端口接9100 -
重启并运行
pkill prometheus
nohup ./prometheus --config.file=prometheus.yml >> /opt/Tool/prometheus/prometheus-2.28.1.linux-amd64/prometheus.out 2>&1 &
3.2 mysql_exporter安装
-
解压文件中新增数据库连接配置my.cnf
[client] host=127.0.0.1 port=3306 user=root password=xxxxxxxxxxxx -
启动运行
nohup /路径/mysqld_exporter-0.14.0.linux-amd64/mysqld_exporter --config.my-cnf=/路径/mysqld_exporter-0.14.0.linux-amd64/.my.cnf & -
修改Prometheus服务器的配置文件
在主配置文件最后加上下面三行 - job_name: 'mysqld' #取一个job名称来代表被监控的机器 static_configs: - targets: ['IP:9104'] # 这里改成被监控机器的IP,后面端口接9104 -
重启prometheus
3.3 prometheus 查看监控节点
四、Grafana导入插件,连接
启动:./prometheus --config.file=promethus.yml &prometheus
插件下载地址:Dashboards | Grafana Labs
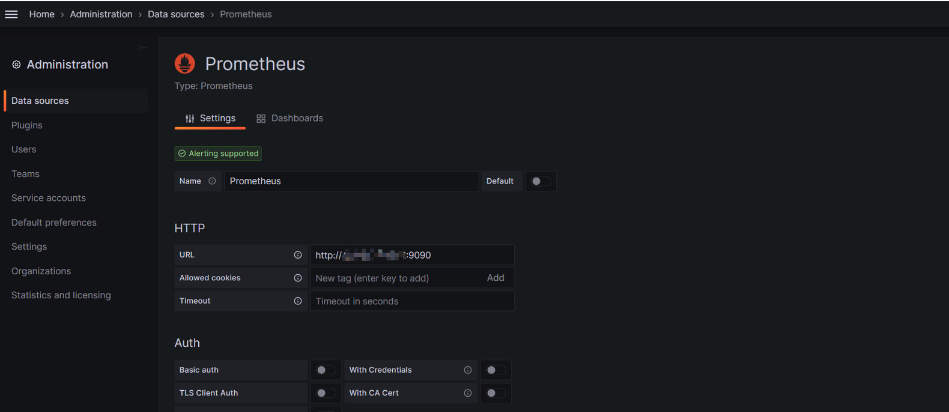
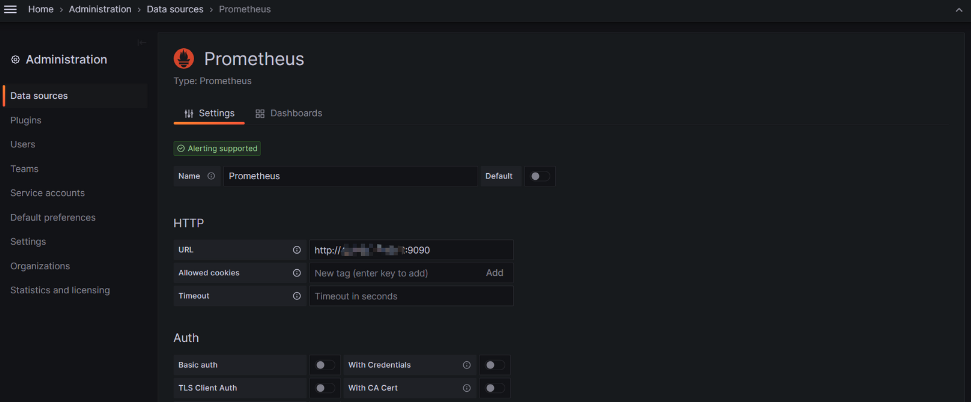
注意:Data_Source选择:Prometheus
4.1 下载插件
下载方式:Download JSON 或者 cpoy ID都行
涉及到插件1:Node Exporter Full | Grafana Labs
涉及到插件2:MySQL Overview | Grafana Labs
4.2 Grafana中新增Data_Source
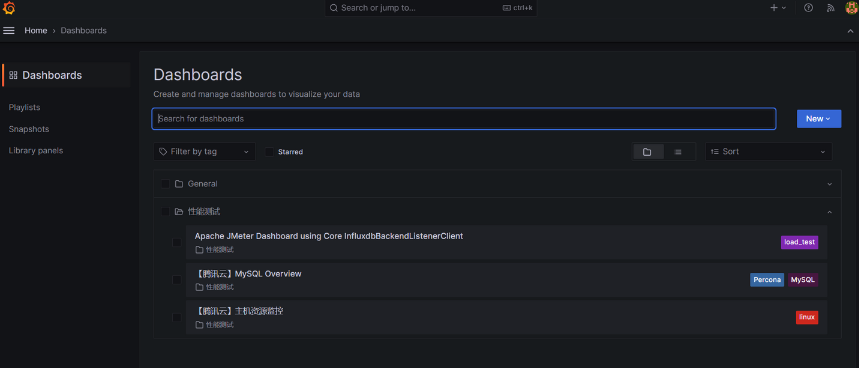
4.3 DashBoard中新增项目+导入
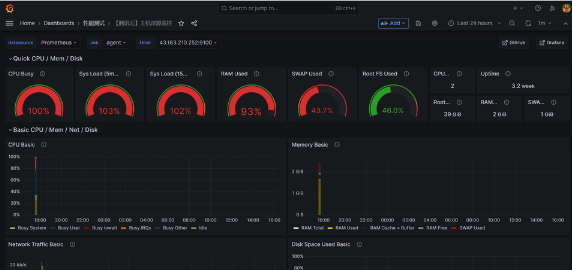
4.4 导入JSON自动识别查看最终效果


 浙公网安备 33010602011771号