


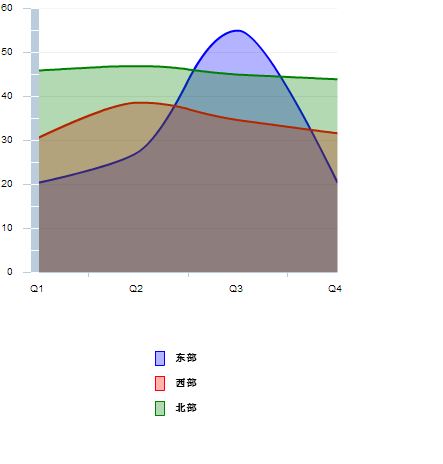
<?xml version="1.0" encoding="utf-8"?>
<mx:Application xmlns:mx="http://www.adobe.com/2006/mxml" layout="absolute">
    <mx:Script>
        <![CDATA[
            import mx.collections.ArrayCollection;
            [Bindable]
            private var sales:ArrayCollection=new ArrayCollection([{Quarter:"Q1",East:20.4,West:30.6,North:45.9},
                {Quarter:"Q2",East:27.4,West:38.6,North:46.9},{Quarter:"Q3",East:55,West:34.6,North:45},
                {Quarter:"Q4",East:20.4,West:31.6,North:43.9},]);
        ]]>
    </mx:Script>
    <mx:SolidColor id="sc1" color="blue" alpha=".3"/>
    <mx:SolidColor id="sc2" color="red" alpha=".3"/>
    <mx:SolidColor id="sc3" color="green" alpha=".3"/>
    <mx:Stroke id="s1" color="blue" weight="2"/>
    <mx:Stroke id="s2" color="red" weight="2"/>
    <mx:Stroke id="s3" color="green" weight="2"/>
    <mx:AreaChart id="myChart" width="350" height="300" dataProvider="{sales}">
        <mx:horizontalAxis>
            <mx:CategoryAxis categoryField="Quarter"/>
        </mx:horizontalAxis>
        <mx:series>
            <mx:AreaSeries displayName="东部" yField="East" form="curve" areaStroke="{s1}" areaFill="{sc1}"/>
            <mx:AreaSeries displayName="西部" yField="West" form="curve" areaStroke="{s2}" areaFill="{sc2}"/>
            <mx:AreaSeries displayName="北部" yField="North" form="curve" areaStroke="{s3}" areaFill="{sc3}"/>
        </mx:series>
    </mx:AreaChart>
    <mx:Legend dataProvider="{myChart}" x="151" y="345"/>
</mx:Application>

 浙公网安备 33010602011771号