
二、prometheus之Alertmanager告警
一、Alertmanager简介
Prometheus是一个划分平台,metrics的收集和存储与警报是分开的,警报是由Alertmanager负责,这是监控环境的独立部分。警报的规则是在Prometheus server上进行定义的,这些规则可以触发时间,然后将其传到alertmanager,alertmanager随后决定如何处理各自的警报,处理复制之类的问题,并决定在发送警报时使用什么机制:实时消息、电子邮件或者是其他钉钉、微信等工具。
报警设置:
prometheus --> 触发阈值 --> 超出持续时间 --> alertmanager --> 分组|抑制|静默 --> 媒介类型 --> 邮件|钉钉|微信等

分组(group):将类似性质的告警合并为单个通知,比如网络通知、主机通知、服务通知。
静默(silences):是一种简单的特定时间静默的机制,例如:服务器要升级维护可以先设置这个时间段告警静默
抑制(inhibition):当告警发出后,停止重复发送由此告警引发的其他告警即合并一个故障引起多个报警时间,可以消除冗余告警
二、Alertmanager部署
# 解包
root@prometheus:~# tar xf alertmanager-0.23.0.linux-amd64.tar.gz -C /usr/local/
root@prometheus:~# cd /usr/local/
root@prometheus:/usr/local# ls
alertmanager-0.23.0.linux-amd64  bin  etc  games  include  lib  man  prometheus  prometheus-2.32.1.linux-amd64  sbin  share  src
root@prometheus:/usr/local# ln -sv alertmanager-0.23.0.linux-amd64/ alertmanager
'alertmanager' -> 'alertmanager-0.23.0.linux-amd64/'
root@prometheus:/usr/local#


# service 启动文件
root@prometheus:/usr/local# cat > /etc/systemd/system/alertmanager.service << EOF
> [Unit]
> Description=Prometheus Server
> Documentation=https://prometheus.io/docs/introduction/overview/
> After=network.target
>
> [Service]
> Restart=on-failure
> WorkingDirectory=/usr/local/alertmanager
> ExecStart=/usr/local/alertmanager/alertmanager
>
> [Install]
> WantedBy=multi-user.target
> EOF
root@prometheus:/usr/local#


# 启动
root@prometheus:/usr/local# systemctl daemon-reload
root@prometheus:/usr/local# systemctl start alertmanager.service
root@prometheus:/usr/local# netstat -tnlp | grep 9093
tcp6       0      0 :::9093                 :::*                    LISTEN      45186/alertmanager
root@prometheus:/usr/local#
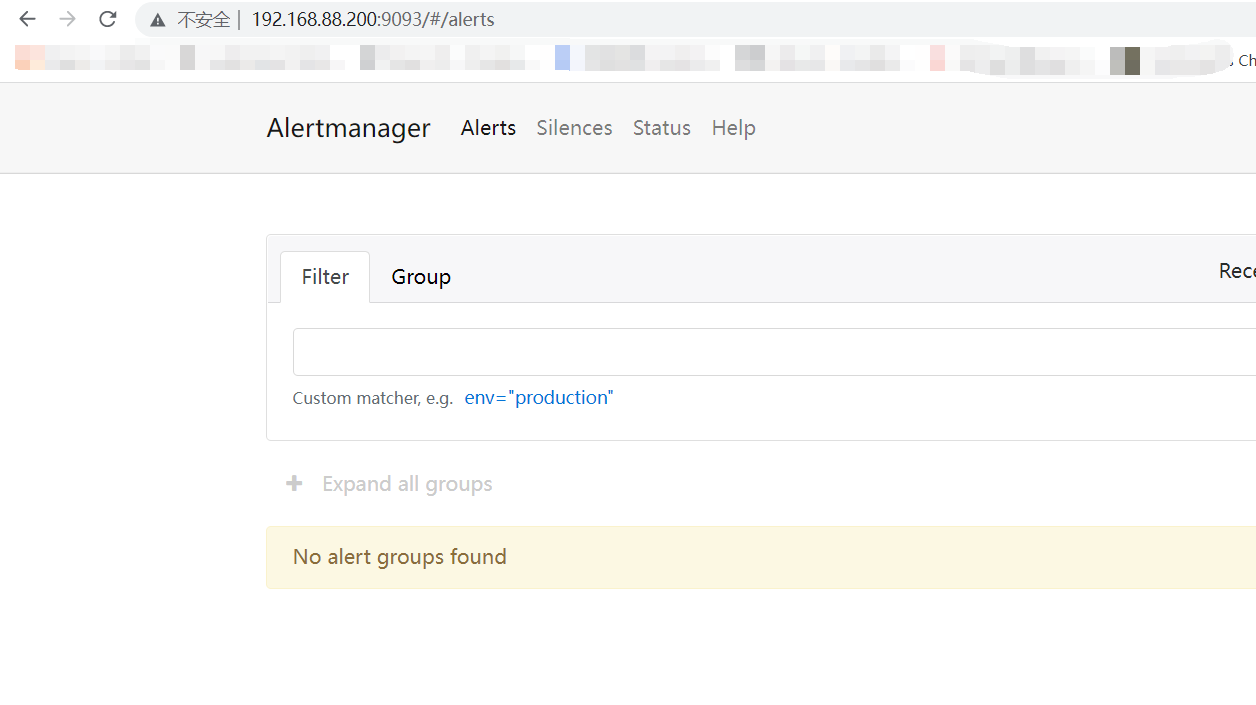
测试访问
三、Alertmanager告警配置
Alertmanager的配置有两个地方,一个是在Prometheus server端进行配置告警节点,指定匹配告警规则文件路径,以及监控alertmanager本身。另一个直接配置alertmanager自身的配置,在alertmanager.yml进行配置。
root@prometheus:/usr/local/prometheus# vim /usr/local/prometheus/prometheus.yml
global:
  scrape_interval: 15s
  evaluation_interval: 15s

# Alertmanager configuration
alerting:
  alertmanagers:
    - static_configs:
        - targets:
           - 192.168.88.200:9093

rule_files:
   - "rules/*_rules.yml"
  # - "second_rules.yml"

scrape_configs:
  - job_name: "prometheus"
    static_configs:
      - targets: ["localhost:9090"]

  - job_name: "alertmanager"
    static_configs:
      - targets: ["192.168.88.200:9093"]
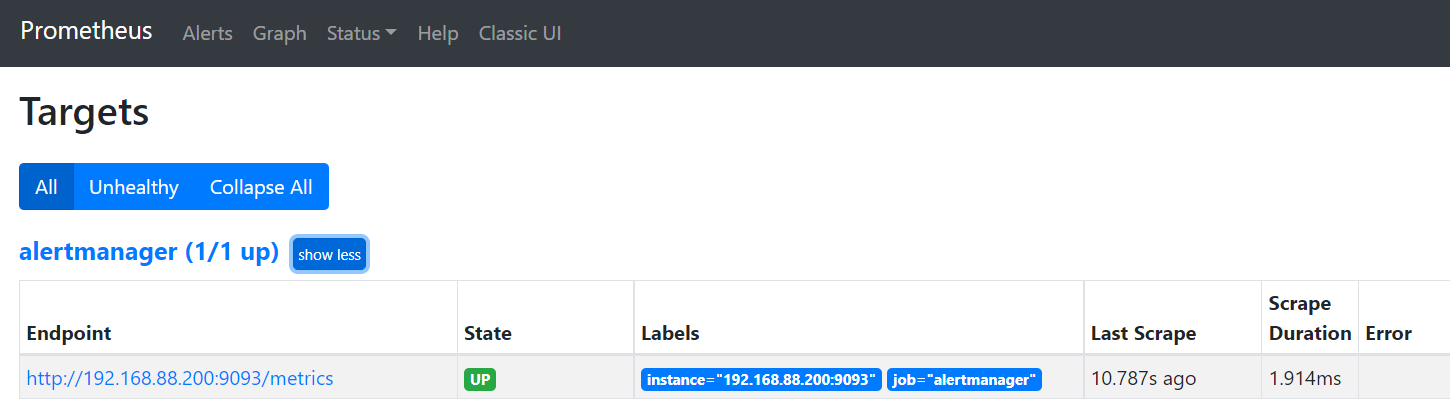
prometheus web端可以看到alertmanager 端点
配置完成prometheus.yml后,再来看看默认的alertmanager.yml的介绍,如下:
[root@prometheus alertmanager]# cat alertmanager.yml
global:
  resolve_timeout: 5m    #处理超时时间,默认为5min

route:
  group_by: ['alertname']    # 报警分组依据
  group_wait: 10s    # 最初即第一次等待多久时间发送一组警报的通知
  group_interval: 10s    # 在发送新警报前的等待时间
  repeat_interval: 1h    # 发送重复警报的周期 对于email配置中,此项不可以设置过低,否则将会由于邮件发送太多频繁,被smtp服务器拒绝
  receiver: 'web.hook'    # 发送警报的接收者的名称,以下receivers name的名称

receivers:
- name: 'web.hook'    # 警报
  webhook_configs:    # webhook配置
  - url: 'http://192.168.0.143:5001/'

inhibit_rules:    # 一个inhibition规则是在与另一组匹配器匹配的警报存在的条件下,使匹配一组匹配器的警报失效的规则。两个警报必须具有一组相同的标签。
  - source_match:
      severity: 'critical'
    target_match:
      severity: 'warning'
    equal: ['alertname', 'dev', 'instance']
-
global: 全局配置,包括报警解决后的超时时间、SMTP 相关配置、各种渠道通知的 API 地址等等。
-
route: 用来设置报警的分发策略,它是一个树状结构,按照深度优先从左向右的顺序进行匹配。
-
receivers: 配置告警消息接受者信息,例如常用的 email、wechat、slack、webhook 等消息通知方式。
-
inhibit_rules: 抑制规则配置,当存在与另一组匹配的警报(源)时,抑制规则将禁用与一组匹配的警报(目标)。
四、自定义告警规则和发送
在prometheus.yml中创建规则文件,进行监控node02主机的node_exporter是否存活,并发送告警信息如下:
[root@prometheus prometheus]# pwd
/usr/local/prometheus
[root@prometheus prometheus]# mkdir rules
[root@prometheus rules]# vim node_rules.yml
groups:
- name: node-up    # 分组名称
  rules:           # 规则设置
  - alert: node-up  #告警名称
    expr: up{instance="192.168.88.201:9100"} == 0    # 表达式,查询式语句查询up的值是否等于0,如果等于则告警
    for: 15s    # 告警持续时间
    labels:
      severity: 1
      team: node
    annotations:    # 注解
      summary: "{{ $labels.instance }} 已停止运行超过 15s!"
[root@prometheus rules]# systemctl restart prometheus
设定prometheus.yml中的rules后,再配置alertmanager的告警相关信息,如下:
[root@prometheus alertmanager]# pwd
/usr/local/alertmanager

[root@prometheus alertmanager]# vim alertmanager.yml
global:
  resolve_timeout: 5m
  smtp_smarthost: 'smtp.163.com:465'
  smtp_from: 'xxxxxxxxx@163.com'
  smtp_auth_username: 'xxxxxxxxx@163.com'
  smtp_auth_password: 'xxxxxxxxx'    # 16位qq邮箱授权码作为密码
  smtp_require_tls: false

route:
  group_by: ['alertname']
  group_wait: 10s
  group_interval: 10s
  repeat_interval: 1h
  receiver: 'email'    # 选用邮箱告警发送

receivers:
- name: 'email'
  email_configs:
  - to: 'xxxxxxxxx@163.com'

inhibit_rules:
  - source_match:
      severity: 'critical'
    target_match:
      severity: 'warning'
    equal: ['alertname', 'dev', 'instance']
配置完成后,测试一下是否可以正常出现告警信息和邮件的成功发送。
[root@node1 ~]# systemctl stop node_exporter
停止node1的exporter后,可以在prometheus server的web界面上可以看到告警:http://<ip>:9090/alerts,如图:
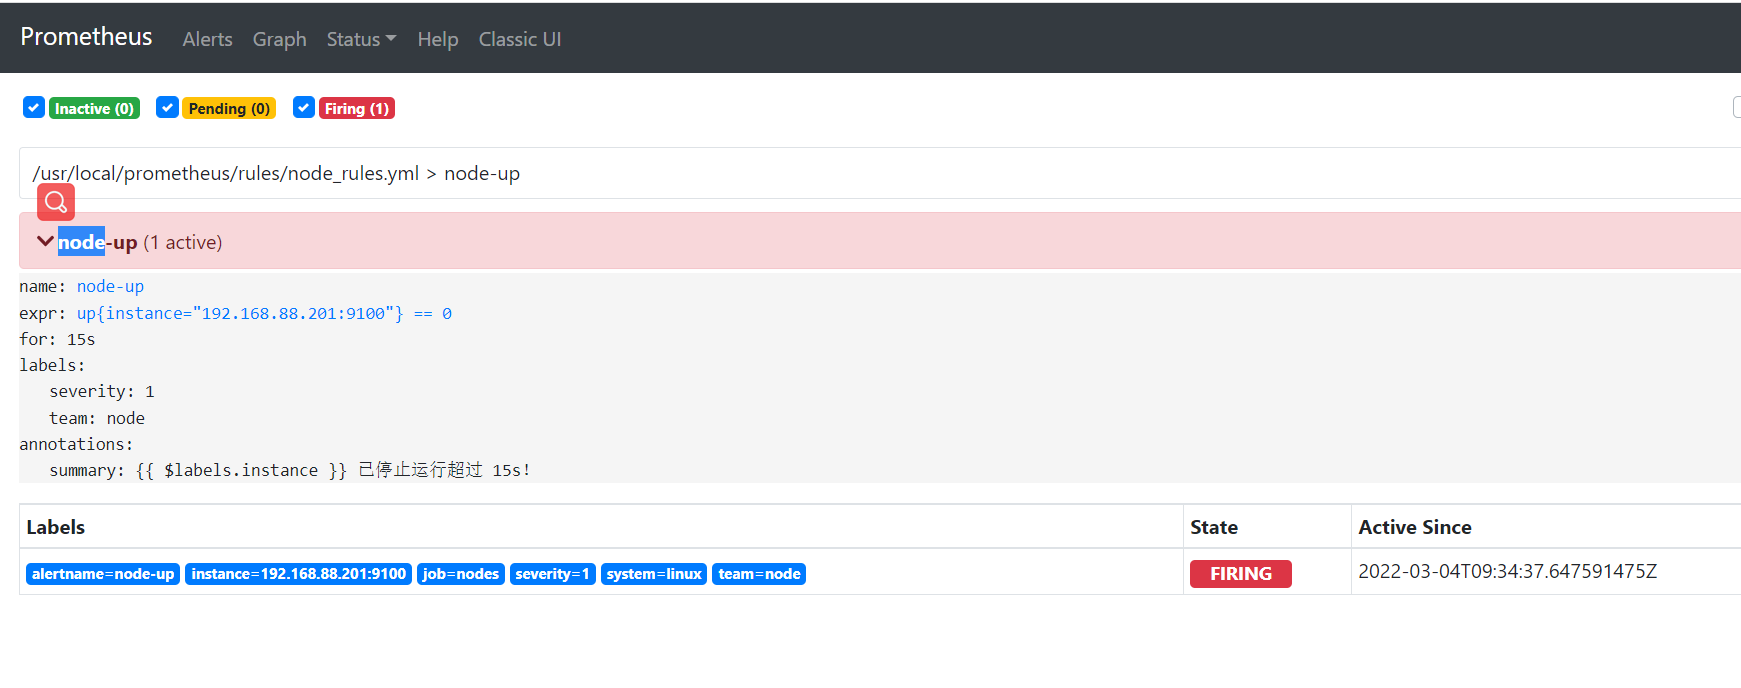
1)inactive:表示当前报警信息即不是firing状态也不是pending状态
2)pending:表示在设置的阈值时间范围内被激活的
3)firing:表示超过设置的阈值时间被激活的
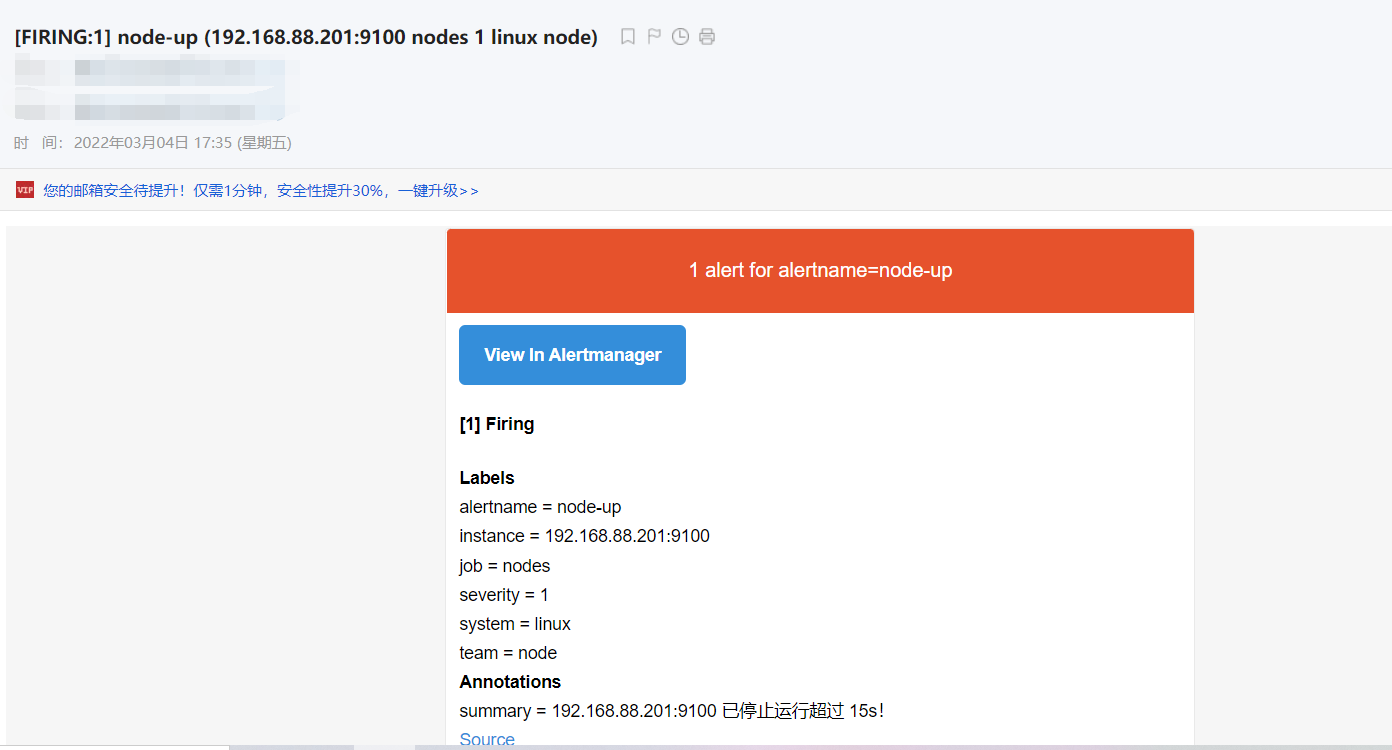
当状态变成了firing的时候,我们的163邮箱就会收到响应的告警邮件
五、自定义告警模板
上面已经实现了告警规则触发,告警邮件的发送,但是官方的告警模板实在吝啬难懂,为此,我们也可以进行自定义告警模板,实现最直观的告警信息。在alertmanager目录下创建template目录,增加邮件模板,然后修改alertmanager的配置。
# 创建模板文件
[root@prometheus alertmanager]# mkdir template
[root@prometheus template]# vim email.tmpl
{{ define "email.html" }}
{{ range .Alerts }}
<pre>
========start==========
告警程序: prometheus_alert
告警级别: {{ .Labels.severity }}
告警类型: {{ .Labels.alertname }}
故障主机: {{ .Labels.instance }}
告警主题: {{ .Annotations.summary }}
告警详情: {{ .Annotations.description }}
触发时间: {{ .StartsAt.Format "2019-12-14 16:01:01" }}
========end==========
</pre>
{{ end }}
{{ end }}
# 修改alertmanager.yml配置
[root@prometheus alertmanager]# cat alertmanager.yml
global:
resolve_timeout: 5m
smtp_smarthost: 'smtp.163.com:465'
smtp_from: 'zrxzaizai@163.com'
smtp_auth_username: 'zrxzaizai@163.com'
smtp_auth_password: 'administrator2!'
smtp_require_tls: false
templates: # 指定邮件模板的路径,可以使用相对路径,template/*.tmpl的方式
- '/usr/local/alertmanager/template/email.tmpl'
route:
group_by: ['alertname']
group_wait: 10s
group_interval: 10s
repeat_interval: 1h
receiver: 'email' # 选用邮箱告警发送
receivers:
- name: 'email'
email_configs:
- to: 'zrxzaizai@163.com'
html: '{{ template "email.html" . }}' # 指定使用模板,如果不指定,还是会加载默认的模板的
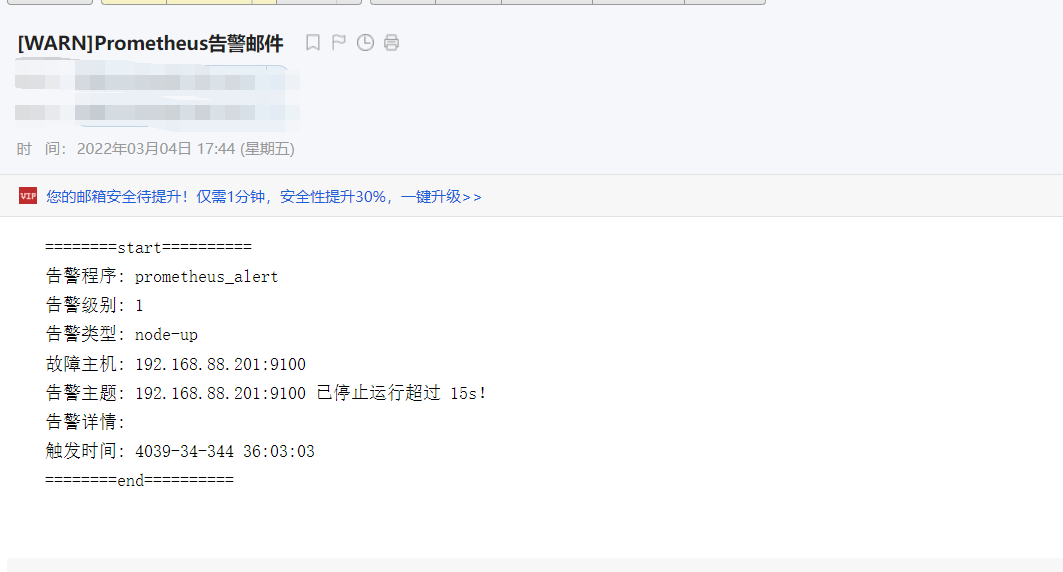
headers: { Subject: "[WARN]Prometheus告警邮件" } # 配置邮件主题
inhibit_rules:
- source_match:
severity: 'critical'
target_match:
severity: 'warning'
equal: ['alertname', 'dev', 'instance']
# 重启alertmanager
root@prometheus template]# systemctl restart alertmanager
# 测试故障告警
[root@node1 ~]# systemctl stop node_exporter
经过一小段时间后,邮箱会收到告警邮件,是不是好看多了,如图:

 浙公网安备 33010602011771号