

matplotlib修改坐标轴刻度值,刻度个数
Matplotlib 中的 ticker 模块用于支持坐标轴刻度的修改,调用下列命令可以初步查看主副坐标轴刻度的数值定位方式(locator)与具体格式(formatter)等。
详情:http://matplotlib.org/api/axis_api.html
ax.xaxis.get_major_ticks()
ax.xaxis.get_minor_ticks()
ax.xaxis.get_major_locator()
ax.xaxis.get_minor_locator()
ax.xaxis.get_major_formatter()
ax.xaxis.get_minor_formatter()
设置主副刻度对象属性
# encoding:utf-8
import matplotlib.pyplot as plt
from matplotlib.ticker import MultipleLocator, FormatStrFormatter
import numpy as np
def test():
ax = plt.subplot(111) # 注意:一般都在ax中设置,不再plot中设置
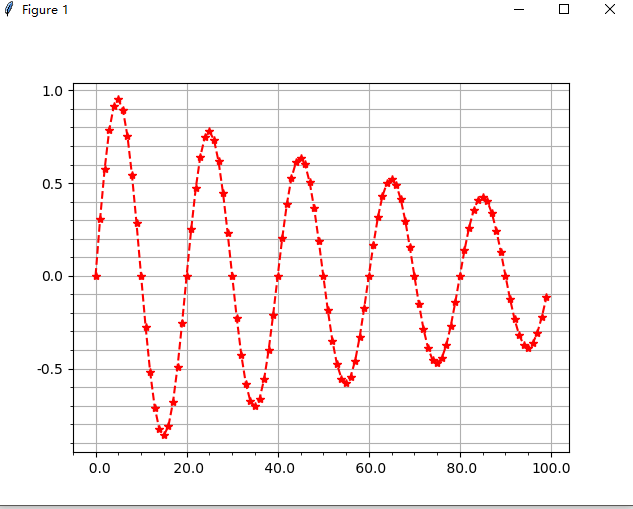
t = np.arange(0.0, 100.0, 1)
s = np.sin(0.1 * np.pi * t) * np.exp(-t * 0.01)
plt.plot(t, s, '--r*')
# 修改主刻度
xmajorLocator = MultipleLocator(20) # 将x主刻度标签设置为20的倍数
xmajorFormatter = FormatStrFormatter('%5.1f') # 设置x轴标签文本的格式
ymajorLocator = MultipleLocator(0.5) # 将y轴主刻度标签设置为0.5的倍数
ymajorFormatter = FormatStrFormatter('%1.1f') # 设置y轴标签文本的格式
# 设置主刻度标签的位置,标签文本的格式
ax.xaxis.set_major_locator(xmajorLocator)
ax.xaxis.set_major_formatter(xmajorFormatter)
ax.yaxis.set_major_locator(ymajorLocator)
ax.yaxis.set_major_formatter(ymajorFormatter)
# 修改次刻度
xminorLocator = MultipleLocator(5) # 将x轴次刻度标签设置为5的倍数
yminorLocator = MultipleLocator(0.1) # 将此y轴次刻度标签设置为0.1的倍数
# 设置次刻度标签的位置,没有标签文本格式
ax.xaxis.set_minor_locator(xminorLocator)
ax.yaxis.set_minor_locator(yminorLocator)
# 打开网格
ax.xaxis.grid(True, which='major') # x坐标轴的网格使用主刻度
ax.yaxis.grid(True, which='minor') # y坐标轴的网格使用次刻度
# 删除坐标轴的刻度显示
# ax.yaxis.set_major_locator(plt.NullLocator())
# ax.xaxis.set_major_formatter(plt.NullFormatter())
plt.savefig("D:\脚本项目\工具\服务器监控\est.png")
plt.show()
test()

 浙公网安备 33010602011771号