Python-深入浅出数据分析-最优化
在阅读前,读一下Python-深入浅出数据分析-总结会更好点,以后遇到问题比如代码运行不了,再读读也行,>-_-<
写在前面
本文需要线性规划基础
第三章核心问题是在约束条件下求最大值问题,目标函数和约束条件都是线性的,其实是线性规划问题。
定义数据模型
问题的数学模型如下:
其中,\(x_1\)为生产橡皮鸭的个数,\(x_2\)为生产橡皮鱼的个数,\(z\)为总利润
scipy
数据模型建立了,怎么解呢?怎么解这个线性规划问题呢?scipy!
scipy.optimize.linprog(c, A_ub=None, b_ub=None, A_eq=None, b_eq=None, bounds=None, method='simplex', callback=None, options=None)
Minimize a linear objective function subject to linear equality and inequality constraints.
Linear Programming is intended to solve the following problem form:
Minimize: c^T * x
Subject to: A_ub * x <= b_ub
A_eq * x == b_eq
根据帮助文档,把求最大值问题,改为求最小值问题
求\(5x_1 + 4x_2\)的最大值 \(\Longleftrightarrow\) 求\(-5x_1-4x_2\)的最小值
import numpy as np
import pandas as pd
import matplotlib.pyplot as plt
from scipy.optimize import linprog

c = [-5, -4]
A = [[100, 125]]
b = [50000]
x1_bounds = (0, 400)
x2_bounds = (0, 300)

res = linprog(c, A_ub=A, b_ub=b, bounds=(x1_bounds, x2_bounds))
res
'''
     fun: -2320.0
 message: 'Optimization terminated successfully.'
     nit: 2
   slack: array([   0.,    0.,  220.])
  status: 0
 success: True
       x: array([ 400.,   80.])
'''
生成橡皮鸭400个,橡皮鱼80个
结合业务
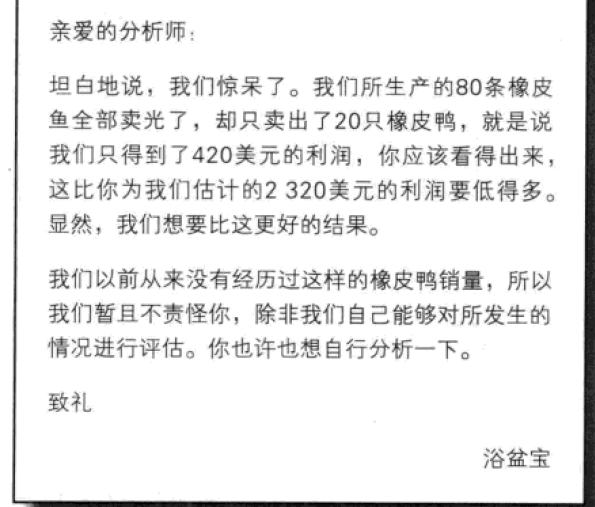
虽然理论上利润最大了,但是生产了这么多,有人买吗?尴尬的事情发生了
分析历史趋势
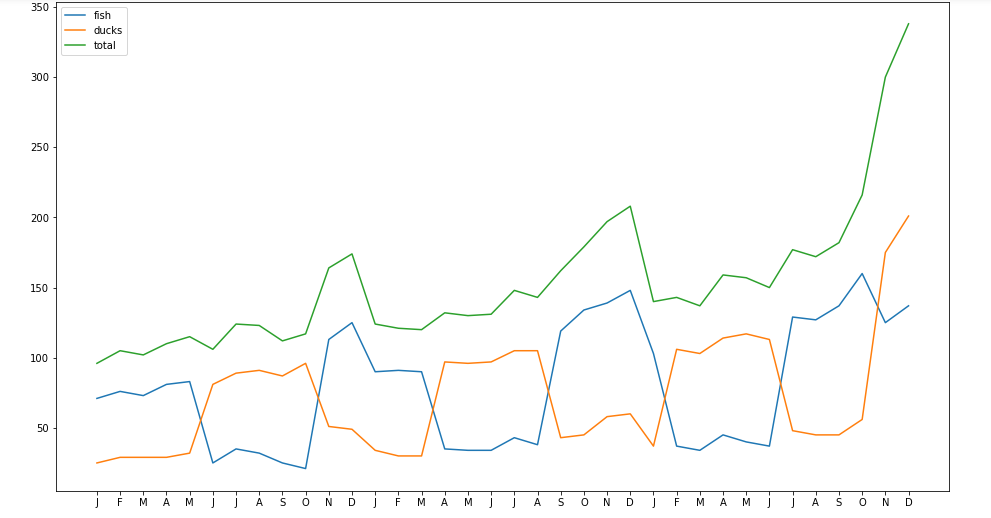
分析过去的售卖情况,调整模型的约束条件
df = pd.read_excel('./historical_sales_data.xls', names= ['Month', 'Year', 'Fish', 'Ducks', 'Total'])

fig = plt.figure(figsize= (16, 9))
ax = fig.add_subplot(1, 1, 1)

ax.plot(df.index, df.Fish, label= 'fish')
ax.plot(df.index, df.Ducks, label= 'ducks')
ax.plot(df.index, df.Total, label= 'total')

ax.legend()

ax.set_xticks(df.index)
l = ax.set_xticklabels(df.Month)
增加约束条件
12月份之后的1月份销量均会下降,比如橡皮鸭最多只能售卖150只,橡皮鱼最多只能售卖100只
c = [-5, -4]
A = [[100, 125]]
b = [50000]
x1_bounds = (0, 150)
x2_bounds = (0, 100)

res = linprog(c, A_ub=A, b_ub=b, bounds=(x1_bounds, x2_bounds))
res
'''
     fun: -1150.0
 message: 'Optimization terminated successfully.'
     nit: 2
   slack: array([ 22500.,      0.,      0.])
  status: 0
 success: True
       x: array([ 150.,  100.])

'''

 浙公网安备 33010602011771号