Prometheus Grafana快速搭建
Prometheus
Prometheus和Grafana组合基本上是监控系统的标配。Prometheus做存储后端,Grafana做分析及可视化界面。

普罗米修斯是开源的系统监控/报警工具库,功能非常全,且拥有活跃的开发者和用户社区。Prometheus通过HTTP定期主动拉取(Pull)的方式获得指标(直接获取或通过gateway推送),在本地存储所有抓取的样本,并对这些数据运行规则,从现有数据聚合和记录新的时间序列,或生成警报。
Prometheus原生的可视化界面做得比较原始(主要用于调试),所以社区(官方推荐)使用Grafana来做数据展示。
Grafana专注于数据展示,有着丰富用成熟的展示方式和插件,数据源支持Elasticsearch, Prometheus, Graphite, InfluxDB等等。可以让你通过界面点击(无需写前端代码)快速搭建一个非常专业漂亮的展示界面。即便对于前端零基础的开发者也非常友好!
安装Prometheus
-
在官网下载需要的版本(
uname -rv查看linux内核版本及发行号)。比如x86的就下载linux-386系列。 -
Prometheus会主动通过HTTP请求来收集受监控目标的指标。 比如它也通过HTTP Rest API导出了自己的健康状态数据,所以也可以用来监控自己。解压下载源文件内包含一个基本的
prometheus.yml配置可以参照。配置非常简单。global: # 全局配置 scrape_interval: 15s #主动拉取指标的间隔 evaluation_interval: 15s #计算间隔 scrape_configs: #监控的目标配置 - job_name: prometheus #名称 static_configs: # 静态配置 - targets: ['127.0.0.1:9090'] #监控目标暴露的HTTP API端口,是个列表- 把里面的localhost改成你对应机器的IP。
- 其它详细的配置可见配置文档。
-
前台启动Prometheus,如果是在生产环境,需要后台启动时,最好自行配置Systemd。
# Start Prometheus. # By default, Prometheus stores its database in ./data (flag --storage.tsdb.path). ./prometheus --config.file=prometheus.yml -
用浏览器打开http://IP:9090/metrics查询所有指标列表。
-
用浏览器打开http://IP:9090/graph,原生的简易的展示界面(太简陋了,基本没人会用)。
PS:因为Promethues自己导出的指标和展示界面都是同一个9090端口。但实践中metrics接口指向的是目标机器的指标列表,用于Promethues主动拉取。
丰富的Exporter可以下载使用,开箱即用。下面可以用NodeExporter来做个范例。
安装NodeExporter
NodeExporter暴露很多和硬件/软件相关的指标(metrics)。
- 直接下载对应的版本。
- 解压NodeExporter。
-
$ tar xvfz node_exporter-*
$ cd node_exporter-*
-
启动NodeExporter。
$ ./node_exporter
INFO[0000] Starting node_exporter (version=0.18.1, branch=HEAD, revision=3db77732e925c08f675d7404a8c46466b2ece83e)  source="node_exporter.go:156"
INFO[0000] Build context (go=go1.12.5, user=root@b50852a1acba, date=20190604-16:41:43)  source="node_exporter.go:157"
INFO[0000] Enabled collectors:   source="node_exporter.go:97"
INFO[0000]  - arp                source="node_exporter.go:104"
...
INFO[0000] Listening on :9100    source="node_exporter.go:170"
可以使用
./node_exporter -h查看具体的启动参数。从上面可以看它使用的端口是9100,所有的指标列表都可以和上面示例中的prometheus的接口一样:$ curl http://localhost:9100/metrics # HELP go_gc_duration_seconds A summary of the GC invocation durations. # TYPE go_gc_duration_seconds summary go_gc_duration_seconds{quantile="0"} 2.8138e-05 go_gc_duration_seconds{quantile="0.25"} 4.1588e-05 go_gc_duration_seconds{quantile="0.5"} 0.000102923 go_gc_duration_seconds{quantile="0.75"} 0.000162106 go_gc_duration_seconds{quantile="1"} 0.000495923 go_gc_duration_seconds_sum 0.060153937 go_gc_duration_seconds_count 537 # HELP go_goroutines Number of goroutines that currently exist. ...可以看到所有关于node_exporter的指标列表。接下来就是把让prometheus来取这些指标。
-
配置prometheus拉node exporter的指标。即把targets增加9100端口。
scrape_configs: - job_name: 'node' static_configs: - targets: ['127.0.0.1:9100'] -
重启prometheus。
./prometheus --config.file=./prometheus.yml再次查看浏览器打开graph查看:http://127.0.0.1:9090/graph。勾选
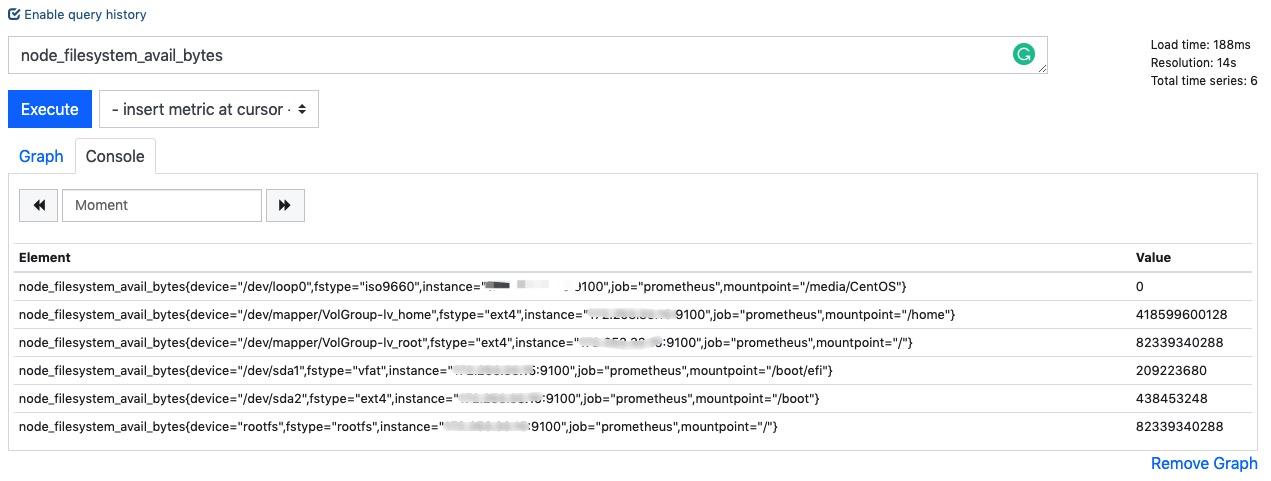
Enable query history后直接输入以node就可以看到大量关于node为前缀的指标了。比如:node_filesystem_avail_bytes查看文件系统可用空间大小情况。
这个界面还是太原始了,但可以用来体验一下PromQL。接下来演示一下接入grafana来展示这些数据。
安装Grafana
按官方指引下载安装:比如Centos安装是
$ wget https://dl.grafana.com/oss/release/grafana-6.3.3-1.x86_64.rpm
$ sudo yum localinstall grafana-6.3.3-1.x86_64.rpm
配置grafana
你可以在/etc/grafana/grafana.ini中配置端口及其它的,具体所有的配置项在: https://grafana.com/docs/installation/configuration/,我们这里都保持默认值,端口默认为3000.用户名/密码默认为admin。
你可以在这里找到对应的启动方式,比如在CentOS上就是
sudo service grafana-server start
启动成功后,你可以使用浏览器打开http://IP:3000使用admin/admin登录。
创建界面
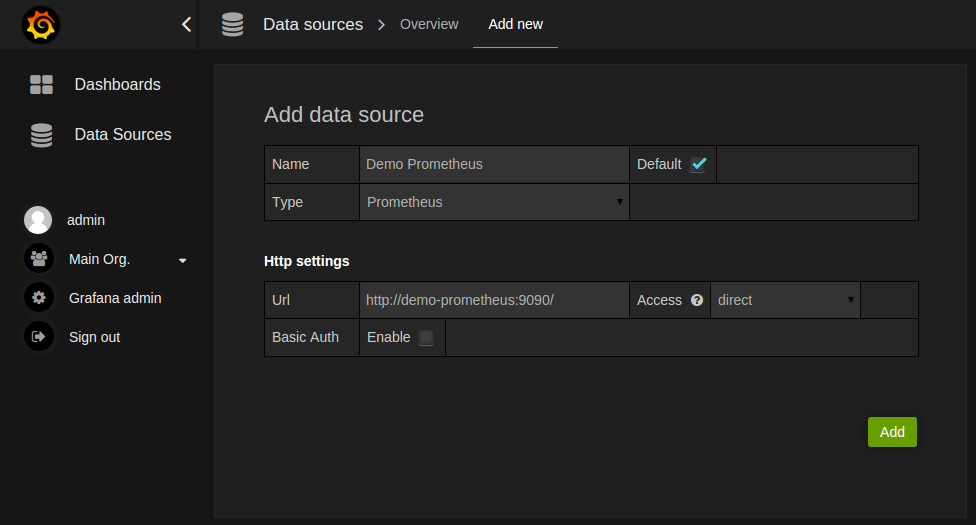
Prometheus的数据源(data source)
- 点击侧边栏中的Grafana图标 -> DataSources -> Add New
- 选择Prometheus类型.
- 设置Prometheus的对外URL(比如 http://IP:9090).
- 点击Add添加
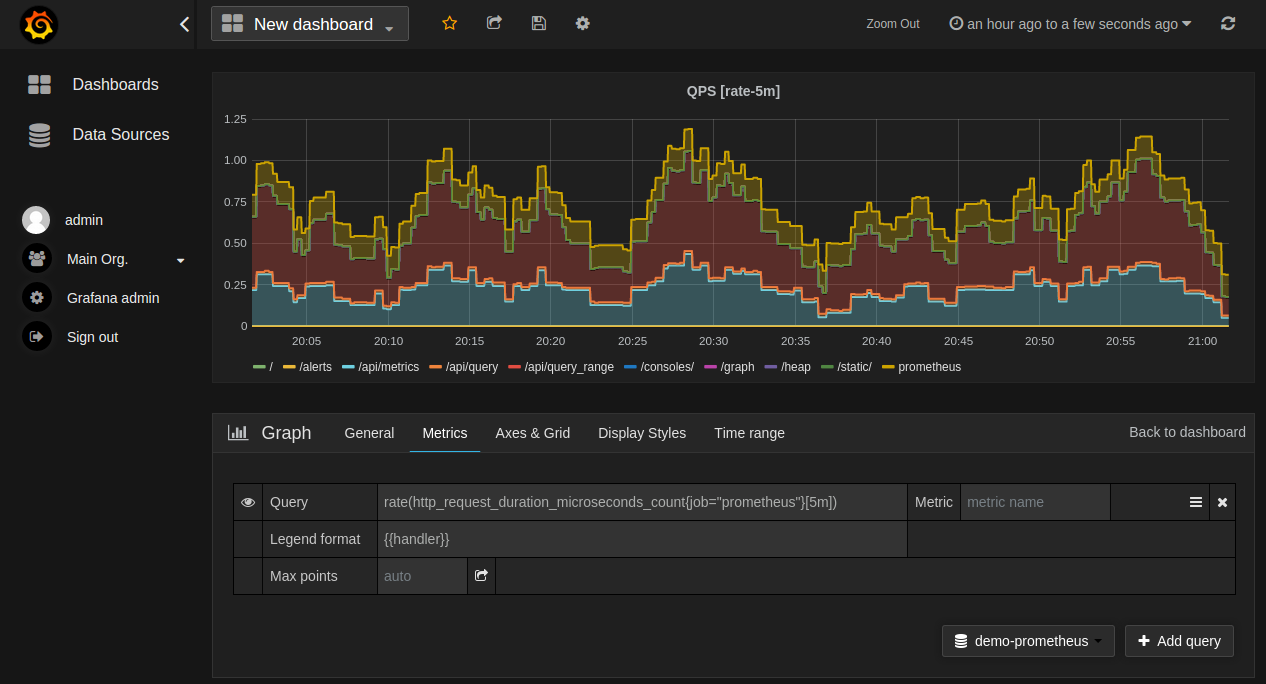
Prometheus图表展示
- 点击graph标题 --> Edits.
- 在Metrics标签下选择你上一步刚增加的Prometheus数据库。
- 在Query字段中输入Prometheus表达式,会自动补全。
- 自定义图表横坐标中指标的名称: Legend format。
导入Dashboards
Grafana.com上有很多别人分享的优化的dashboards,我们可以直接从上面找到node exporter对应的dashboard来使用。下载对应的json文件,然后导入。
其它
在Grafana上如何为选择合适的图表来展示Prometheus对应的数据类型(单调递增的Counter,可降可升的Gauge,用于柱状图展示的Histogram),提供滑动窗口求和的Summary。

 浙公网安备 33010602011771号