


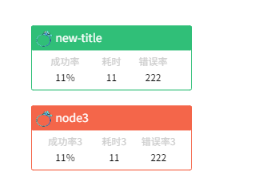
通过canvas自定义实例


<template>
  <div id="container"></div>
</template>
<script>
import G6 from '@antv/g6'
export default {
  name: 'Home',
  data() {
    return {
      icon_Map: {
        b:'https://img.alicdn.com/imgextra/i4/O1CN01aG16y424E11XsURUd_!!6000000007358-2-tps-206-240.png'
      }
    };
  },
  mounted() {
    this.initFunc();
  },
  methods: {
    initFunc() {
      G6.registerNode('card-node', {
        draw: (cfg, group) => {
          const color = cfg.error ? '#f4664A' : '#30BF78';
          const x = -200 / 2 ;
          const y = -80 / 2 ;
          const keyShape = group.addShape('rect', {
            attrs: {
              x,
              y,
              width: 200,
              height: 80,
              stroke: color,
              fill: '#fff',
              radius:2
            },
            name:'card-node-keyshape'
          });
          /*eslint-disable-next-line */
          const titleRect = group.addShape('rect', {
            attrs: {
              x,
              y,
              width: 200,
              height: 30,
              stroke: color,
              fill: color,
              radius:2
            },
            name:'card-node-title-back'
          });
          /*eslint-disable-next-line */
          const image = group.addShape('image', {
            attrs: {
              x: x + 6,
              y: y + 6,
              width: 20,
              height: 20,
              img: this.icon_Map[cfg.nodeType],
              cursor: 'pointer'
            },
            name:'card-node-icon'
          });
          /*eslint-disable-next-line */
          const title = group.addShape('text', {
            attrs: {
              x: x + 30,
              y: y + 8,
              text: cfg.title,
              fontSize: 14,
              fill: '#fff',
              textBaseline: 'top'
            },
            name:'card-node-title'
          });
          let panelx =x + 42;
          const subGroup = group.addGroup();
          cfg.panels?.forEach((panel,i)=> {
            const panelTitle = subGroup.addShape('text', {
              attrs: {
                x: panelx,
                y: y + 50,
                text: panel.title,
                fill: '#ccc',
                textAlign: 'center'
              },
              name:`card-node-panel-title-${i}`
            });
            subGroup.addShape('text', {
              attrs: {
                x:  panelx,
                y: y + 70,
                text: panel.value,
                fill: '#000',
                textAlign: 'center'
              },
              name:`card-node-panel-title-${i}`
            });
            const titleBBox = panelTitle.getBBox();
            panelx = titleBBox.maxX + 40;
          });
          return keyShape;
        },
        update: (cfg, item) =>{
          const group = item.getContainer();
          const titleShape = group.find(ele=>ele.get('name')=== 'card-node-title')
          titleShape.attr({
            text: cfg.title
          })
        }

      }, 'rect');

      const container = document.getElementById('container');
      const width = container.scrollWidth;
      const height = container.scrollHeight || 500;
      const graph = new G6.Graph({
        container,
        width,
        height,
        modes: {
          default: ['drag-canvas', 'drag-node']
        },
        fitCenter: true,
        defaultNode: {
          type: 'card-node'
        }
      });

      const data = {
        nodes: [
          {
            title: 'node2',
            error: false, // 改为布尔值
            nodeType: 'b',
            id: 'node2',
            nodeLevel: 0,
            panels: [
              { title: '成功率', value: '11%' },
              { title: '耗时', value: '11' },
              { title: '错误率', value: '222' }
            ],
            x: 100,
            y: 200
          },
          {
            title: 'node3',
            error: true, // 改为布尔值
            nodeType: 'b',
            id: 'node3',
            nodeLevel: 0,
            panels: [
              { title: '成功率3', value: '11%' },
              { title: '耗时3', value: '11' },
              { title: '错误率3', value: '222' }
            ],
            x: 100,
            y: 300
          }
        ]
      };

      graph.data(data);
      graph.render();
      graph.updateItem(graph.getNodes()[0], {
        title: 'new-title'
      })
    }
  }
};
</script>
<style lang="scss" scoped>

</style>
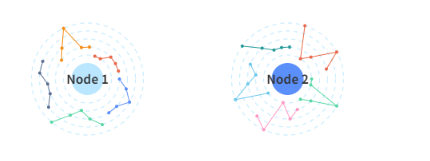
<template>
  <div id="container"></div>
</template>
<script>
import G6 from '@antv/g6'
export default {
  name: 'Demo',
  data() {
    return {
      icon_Map: {
        b:'https://img.alicdn.com/imgextra/i4/O1CN01aG16y424E11XsURUd_!!6000000007358-2-tps-206-240.png'
      }
    };
  },
  mounted() {
    this.initFunc();
  },
  methods: {
    initFunc() {
      G6.registerNode('ListNode', {
        draw: (cfg, group) => {

          const keyShape = group.addShape('circle', {
            attrs: {
              x: 0,
              y: 0,
              r: 70,
              opacity: 0
            },
            name: 'card-node-keyshape'
          });
          const rGap = 10;
          let currentR = 30;
          for(let i=0;i<5;i++){
            group.addShape('circle',{
              attrs:{
                x:0,
                y:0,
                r:currentR,
                stroke:'#bae7ff',
                lineDash: [5,5]
              },
            })
            currentR+=rGap;
          }
          group.addShape('circle', {
            attrs: {
              x: 0,
              y: 0,
              r: 20,
              fill:cfg.centerColor
            },
          })
          group.addShape('text',{
            attrs:{
              x:0,
              y:0,
              text:cfg.label,
              fill:'#333',
              textAlign:'center',
              textBaseline:'middle',
              fontWeight:600
            },
            name:'card-node-label'
          })
          const alphaGap = Math.PI * 2 / 25; //360/25
          let pointCount = 0;
          cfg.details.forEach((detail)=>{
            const {color, values} =detail;
            const positions = [];
            values.forEach((value)=>{
              const r = value + 20;
              const alpha = alphaGap * pointCount;
              pointCount ++;
              const x = r * Math.cos(alpha);
              const y = r * Math.sin(alpha);
               /*eslint-disable-next-line */
              const point = group.addShape('circle', {
                attrs: {
                  x,
                  y,
                  r: 2,
                  fill: color,
                },
                name: 'line-chart-point'
              });

              positions.push({
                x,
                y
              });
            })
            group.addShape('path', {
              attrs: {
                path: positions.map((pos,i)=> [i === 0 ? 'M' : 'L', pos.x, pos.y]),
                stroke: color,
                lineWidth:1,
              }
            })
          })
          return keyShape;
        },
        afterDraw: (cfg, group) => {
          const textShape = group.find(ele=>ele.get('name')=== 'card-node-label');
          const rate = 1.01;
          textShape.animate(radio=>{
            const currentFontSize = textShape.attr('fontSize');
            const scale = radio< 0.5 ? rate : (1/rate);
            const targetFontSize = currentFontSize * scale;
            return { fontSize: targetFontSize };
          },{
            duration: 1000,
            repeat: true,
          })
        }
      }, 'circle');

      const container = document.getElementById('container');
      const width = container.scrollWidth;
      const height = container.scrollHeight || 500;
      const graph = new G6.Graph({
        container,
        width,
        height,
        fitCenter: true,
        defaultNode: {
          type: 'ListNode'
        }
      });

      const data = {
        nodes: [
          {
            id: 'node1',
            label: 'Node 1',
            x: 150,
            y: 150,
            centerColor: '#bae7ff',
            details: [
              { cat: 'pv', values: [20, 30, 40, 30, 30], color: '#5b8ff9' },
              { cat: 'dal', values: [40, 30, 20, 30, 50], color: '#5AD8A6' },
              { cat: 'uv', values: [40, 30, 30, 40, 40], color: '#5D7092' },
              { cat: 'sal', values: [20, 30, 50, 20, 20], color: '#f68D16' },
              { cat: 'cal', values: [10, 10, 20, 20, 20], color: '#E8684A' },
            ]
          },
          {
            id: 'node2',
            label: 'Node 2',
            x: 400,
            y: 150,
            centerColor: '#5b8ff9',
            details: [
              { cat: 'pv', values: [10, 10, 50, 20, 10], color: '#5ad8a6' },
              { cat: 'dal', values: [20, 30, 10, 50, 40], color: '#ff99c3' },
              { cat: 'uv', values: [10, 50, 30, 20, 30], color: '#6dc8ec' },
              { cat: 'sal', values: [50, 30, 20, 20, 20], color: '#269a99' },
              { cat: 'cal', values: [50, 10, 20, 50, 30], color: '#E8684A' },
            ]
          },
        ]
      };

      graph.data(data);
      graph.render();
      //绑定动画
      graph.on('line-chart-point:mouseenter',e=>{
        const {target} = e;
        target.animate({
          r: 5
        },{
          duration: 200,
          repeat: false,
        })
      })
      graph.on('line-chart-point:mouseleave',e=>{
        const {target} = e;
        target.animate({
          r: 2
        },{
          duration: 200,
          repeat: false,
        })
      })
    }

  }
};
</script>
<style lang="scss" scoped>

</style>
自定义边
贝塞尔曲线科普:
A-B线段 取一个点D
B-C线段 取一个点E
AD:DB = BE:EC
D-E线段 取一个点F
DF:FE = AD:DB = BE:EC 比例一致 这样比例的点有无数个。连接起来就是贝塞尔曲线
相当于A为启动C为重点
常用P0 P1 P2表示
P0就是起始点,P2就是终点
<template>
    <div id="container">
    </div>
</template>

<script>
import G6 from '@antv/g6'

export default {
  data() {
    return {
      msg: 'Welcome to Your Vue.js App'
    }
  },
  mounted(){
    this.initFunc();
  },
  methods:{
    initFunc(){
        const lineDashAnimate = (path) =>{
            const lineDash = [6,4,2,4]
            path.attr('lineDash', lineDash)
            let index = 0;
            path.stopAnimate();
            path.animate(ratio=>{
                index ++;
                if(index > 16){
                    index = 0;
                }
                return {
                    lineDashOffset: index
                }
            },{
                duration: 3000,
                repeat: true
            })
        }
        G6.registerEdge(
        'custom-polyline',
        {
            getPath(points) {
                const [startPoint,endPoint]=points;
                const x = (startPoint.x + endPoint.x)/2
                const y1 = startPoint.y;
                const y2 = endPoint.y;
                const path= [
                    ['M', startPoint.x, startPoint.y],
                    ['L', x, y1],
                    ['L', x, y2],
                    ['L', endPoint.x, endPoint.y],
                ];
                return path;
            },
            afterDraw(cfg, group){
                /**di */
                const keyShape = group.find(ele=>ele.get('name')=== 'edge-shape');
                const style = keyShape.attr();
                const halo = group.addShape('path', {
                    attrs: {
                        ...style,
                        lineWidth: 10,
                        opacity:0.3
                    },
                    name: 'edge-halo'
                });
                halo.hide()
                const {endLabel, endPoint = {x:0,y:0}, labelCfg = {}} = cfg;
                const {style: labelStyle, refX=0,refY=0} = labelCfg
                if(endLabel){
                    group.addShape('text', {
                        attrs: {
                            ...labelStyle,
                            text: endLabel,
                            x: endPoint.x- refX,
                            y: endPoint.y- refY,
                            fontSize:12,
                            fill:'#000',
                            textAlign:'right',
                            textBaseline:'middle'
                        },
                        name: 'end-edge-label'
                    })
                }
            },
            afterUpdate(cfg, item){
                const group = item.getContainer();
                const keyShape = group.find(ele=>ele.get('name')=== 'edge-shape');
                const halo = group.find(ele=>ele.get('name')=== 'edge-halo');
                const path = keyShape.attr('path');
                //将路径实时更新
                halo.attr('path', path)

                const {endLabel, endPoint = {x:0,y:0}, labelCfg = {}} = cfg;
                const {refX=0,refY=0} = labelCfg
                const endLabelShape = group.find(ele=>ele.get('name')=== 'end-edge-label');
                if(!endLabelShape){
                    endLabelShape.hide()
                }else{
                    endLabelShape.show()
                    endLabelShape.attr({
                        text: endLabel,
                        x: endPoint.x - refX,
                        y: endPoint.y + refY
                    })
                }
            },
            setState(name, value, item){
                const group = item.getContainer();
                if(name === 'hover'){
                    const halo = group.find(ele=>ele.get('name')=== 'edge-halo');
                    if(value){
                        halo.show()
                    }else{
                        halo.hide()
                    }
                }else if(name === 'selected'){
                    const keyShape = group.find(ele=>ele.get('name')=== 'edge-shape');
                    if(value){
                        lineDashAnimate(keyShape)
                    }else{
                        keyShape.stopAnimate();
                        keyShape.attr('lineDash', undefined);
                    }
                }
            }
        },
        'polyline',
        );
        const container = document.getElementById('container')
        const width = container.scrollWidth
        const height = container.scrollHeight || 500

        const data = {
            nodes: [
                {
                    id: '7',
                    x: 150,
                    y: 100,
                    size: 40,
                },
                {
                    id: '8',
                    x: 300,
                    y: 200,
                    size: 40,
                },
            ],
            edges: [
                {
                    source: '7',
                    target: '8',
                    label:"xxx",
                    endLabel:"yyy"
                },
            ],
        };

        const graph = new G6.Graph({
          container,
          width,
          height,
          fitCenter: true,
          modes: {
            default: ['drag-canvas', 'drag-node', 'click-select']
          },
          defaultNode: {
            type: 'circle',
            size:40,
            style: {
              fill: '#DEE9FF',
              stroke: '#5B8FF9'
            },
            linkPoints: {
              left: true,
              right:true,
              size:5
            },
            anchorPoints:[
                [0, 0.5],
                [1, 0.5]
            ]
          },
          defaultEdge: {
            type: 'custom-polyline',
            style: {
              color: '#F6BD16'
            },
            labelCfg: {
                position:'start',
                refX: 10
            }
          }
        })

        graph.data(data)
        graph.render()

        graph.on('edge:mouseenter', e => {
            graph.setItemState(e.item, 'hover', true)
        })

        graph.on('edge:mouseleave', e => {
            graph.setItemState(e.item, 'hover', false)
        })

        const clearEdgeState = () =>{
            const selectedEdges = graph.findAllByState('edge', 'selected')
            selectedEdges.forEach(edge => {
                graph.setItemState(edge, 'selected', false)
            })
        }

        graph.on('node:click', e=> {
            clearEdgeState()
            const edges = e.item.getEdges();
            edges.forEach(edge => {
                graph.setItemState(edge, 'selected', true)
            })
        })

        graph.on('canvas:click', e=> {
            clearEdgeState()
        })
    }
  }
}
</script>

使用类JSX语法定义G6节点
在G6 3.7.0及以后的版本中,用户使用类似JSX语法来定义节点。只需要使用G6.registerNode 自定义节点时,
将第二个参数设置为字符串或一个返回值string 的function 。
基础语法
<[group|shape] [key]="value" style={{ [key]: value }}>
<[more tag] /> ...
<text>value</text>
</[group|shape]>
推荐用法
1 最外层包裹group标签,保证节点里面图形树结构完整
2 字符串最好使用单引号包裹,以免遇到解析错误
3 style中随node变化的变量推荐使用${}的模板语法加入
4 图形内的相对定位推荐使用marginTop和marginLeft进行设置,x与y会破坏层级关系定位
5 如果涉及到需要横向排列的元素,在上一个元素使用next:inline 来实现下一个元素跟随在上个元素后方
支持的标签
使用类 JSX 语法来定义 G6 节点时,支持使用以下的标签:
<group /><rect /><circle /><text /><path /><line /><points /><polygon /><polyline /><image />
使用标签的形式来定义节点,所有的样式属性都写到style里面,name、keyShape等和style同级
特别说明:使用类HTML语法定义节点时,style里面属性不支持function,因此使用类HTML语法定义节点时,目前不支持marker标签
<template>
    <div id="container">
    </div>
</template>

<script>
import G6 from '@antv/g6'

export default {
  data() {
    return {
    }
  },
  mounted(){
    this.initFunc();
  },
  methods:{
    initFunc(){
        G6.registerNode('card-node', {
            draw: (cfg, group) => {
              const color = cfg.error ? '#f4664A' : '#30BF78';
              const x = -200 / 2 ;
              const y = -80 / 2 ;
              const keyShape = group.addShape('rect', {
                attrs: {
                  x,
                  y,
                  width: 200,
                  height: 80,
                  stroke: color,
                  fill: '#fff',
                  radius:2
                },
                name:'card-node-keyshape'
              });
              /*eslint-disable-next-line */
              const titleRect = group.addShape('rect', {
                attrs: {
                  x,
                  y,
                  width: 200,
                  height: 30,
                  stroke: color,
                  fill: color,
                  radius:2
                },
                name:'card-node-title-back'
              });
              /*eslint-disable-next-line */
              const title = group.addShape('text', {
                attrs: {
                  x: x + 30,
                  y: y + 8,
                  text: cfg.title,
                  fontSize: 14,
                  fill: '#fff',
                  textBaseline: 'top'
                },
                name:'card-node-title'
              });
              let panelx =x + 42;
              const subGroup = group.addGroup();
              cfg.panels?.forEach((panel,i)=> {
                const panelTitle = subGroup.addShape('text', {
                  attrs: {
                    x: panelx,
                    y: y + 50,
                    text: panel.title,
                    fill: '#ccc',
                    textAlign: 'center'
                  },
                  name:`card-node-panel-title-${i}`
                });
                subGroup.addShape('text', {
                  attrs: {
                    x:  panelx,
                    y: y + 70,
                    text: panel.value,
                    fill: '#000',
                    textAlign: 'center'
                  },
                  name:`card-node-panel-title-${i}`
                });
                const titleBBox = panelTitle.getBBox();
                panelx = titleBBox.maxX + 40;
              });
              return keyShape;
            },
            update: (cfg, item) =>{
              const group = item.getContainer();
              const titleShape = group.find(ele=>ele.get('name')=== 'card-node-title')
              titleShape.attr({
                text: cfg.title
              })
            }
        }, 'rect');


        G6.registerNode('jsx1',{
            jsx: (cfg, group) => `
                <rect style={{
                    width:100,
                    height:100,
                    fill: 'rgba(24,144,255,0.15)',
                    radius: 6
                }}>
                    <rect style={{
                        width:100,
                        height:20,
                        fill: '#1890ff',
                        radius: [6,6,0,0]
                    }}>
                         <text style={{
                            fill: '#fff',
                            textAlign: 'center',
                            textBaseline: 'middle',
                            marginLeft: 50,
                            fontWeight:'bold'
                        }}>${cfg.id}</text>
                    </rect>
                    <text style={{
                        fill: 'red',
                        marginLeft: 8
                    }}>Full</text>
                    <text style={{
                        fill: '#333',
                        marginLeft: 8
                    }}>${cfg.metric}</text>
                    <text style={{
                        fill: '#1890ff',
                        marginLeft: ${cfg.cpuUsage * 84 /100}
                    }}>${cfg.cpuUsage}%</text>
                    <rect style={{
                        width: 84,
                        height: 10,
                        fill: '#fff',
                        stroke: '#1890ff',
                        marginLeft: 8,
                        marginTop: 4
                    }}>
                        <rect style={{
                            width: ${cfg.cpuUsage * 84 /100},
                            height: 10,
                            fill: '#1890ff',
                            marginLeft: 8,
                        }}>
                        </rect>
                    </rect>
                </rect>
            `
        })

        G6.registerNode('jsx2',{
            jsx: (cfg, group) => `
                <rect style={{
                    width:150,
                    height:75,
                    fill: '#fff',
                    stroke: '${cfg.color}',
                    radius: 8
                }}>
                    <rect style={{
                        width:150,
                        height:20,
                        fill: '${cfg.color}',
                        radius: [8,8,0,0]
                    }}>
                         <text style={{
                            fill: '#fff',
                            textAlign: 'center',
                            textBaseline: 'middle',
                            marginLeft: 75,
                            fontWeight:'bold'
                        }}>${cfg.id}</text>
                    </rect>
                    <text style={{
                        marginLeft: 6,
                        marginTop: 6
                    }}>描述:${cfg.description}</text>
                    <text style={{
                        marginLeft: 6,
                        marginTop: 6
                    }}>创建者:${cfg.meta.creatorName}</text>
                    <circle style={{
                        r: 12,
                        stroke: '${cfg.color}',
                        fill: '#fff',
                        marginLeft: 75,
                        marginTop: 24
                    }}>
                        <image name="img-shape" style={{ img: 'https://img.alicdn.com/imgextra/i4/O1CN01aG16y424E11XsURUd_!!6000000007358-2-tps-206-240.png', width: 12, height: 12,marginLeft: 70,marginTop:-5 }} />
                    </circle>
                </rect>
            `,
            afterDraw: (cfg, group) => {
                const imgShape = group.find(ele=>ele.get('name')==='img-shape')
                imgShape.animate(radio => {
                    return {
                        opacity: Math.abs(1 - radio)
                    }
                },{
                    repeat: true,
                    duration: 3000
                })
            }
        })

        const container = document.getElementById('container');
        const width = container.scrollWidth;
        const height = container.scrollHeight || 500;
        const graph = new G6.Graph({
            container,
            width,
            height,
            fitCenter: true,
            modes: {
                default: ['drag-canvas', 'drag-node', 'click-select']
            },
            defaultNode: {
                type: 'ListNode'
            }
        });

        const data={
            nodes: [
                {
                    x:150,
                    y:150,
                    description: "ant_type_name",
                    label: 'Type / ReferType',
                    color: '#2196f3',
                    meta : {
                        creatorName: 'a_creator'
                    },
                    id: 'node1',
                    type: 'jsx1',
                    metric: 'cpu use',
                    cpuUsage: 80
                },
                {
                    x:350,
                    y:150,
                    description: "node2_name",
                    label: 'JSX Node',
                    color: '#2196f3',
                    meta : {
                        creatorName: 'a_creator'
                    },
                    id: 'node2',
                    type: 'jsx2'
                }
            ],
            edges: [
                {
                    source: 'node1',
                    target: 'node2'
                }
            ]
        }

        graph.data(data);
        graph.render();
    }
  }
}
</script>

@antv/g6-react-node
能直接使用React定义节点
日常所遇,随手而记。

 浙公网安备 33010602011771号