


add_axes frameon
add_axes:增加一个绘图区域。frameon设置是否覆盖下面的图层
import matplotlib.pyplot as plt
fig = plt.figure()
x = [1, 2, 3, 4, 5, 6, 7]
y = [10, 30, 40, 20, 50, 80, 60]
axprops = dict(xticks=[], yticks=[])
left, bottom, width, height = 0.1, 0.1, 0.8, 0.8
ax1 = fig.add_axes([left, bottom, width, height],**axprops)
ax1.plot(x, y, 'r')
ax1.set_title('area1')
left, bottom, width, height = 0.2, 0.2, 0.25, 0.25
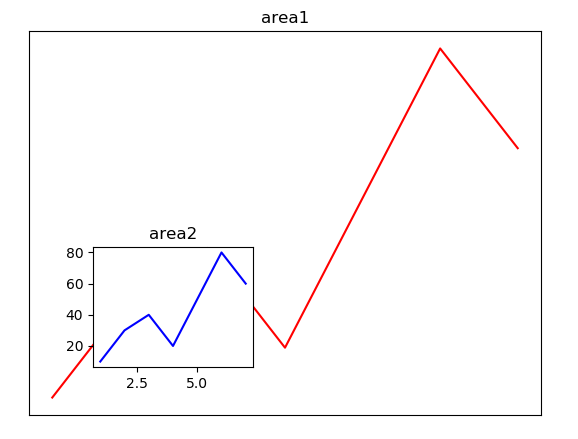
ax2 = fig.add_axes([left, bottom, width, height],frameon=False) #叠加图层时frameon必须设置成False,不然会覆盖下面的图层
ax2.plot(x,y, 'b')
ax2.set_title('area2')
plt.show()
输出:

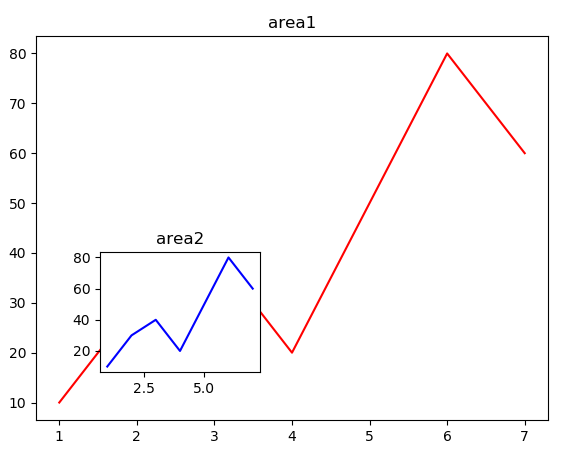
删除frameon=False:
删除**axprops:

 浙公网安备 33010602011771号