
【DW·智慧海洋(捕鱼作业分析)打卡】task02_数据分析 (刺网/围网/拖网)
开源地址见Github:https://github.com/datawhalechina/team-learning
2.2 EDA内容介绍
- 数据总体了解
- 读取数据集并了解数据集的大小,原始特征维度;
- 通过info了解数据类型;
- 粗略查看数据集中各特征的基本统计量
- 缺失值和唯一值
- 查看数据缺失值情况
- 查看唯一值情况
- 数据特性和特征分布
- 三类渔船轨迹的可视化
- 坐标序列可视化
- 三类渔船速度和方向序列可视化
- 三类渔船速度和方向的数据分布
- 总结
2.3 代码示例
2.3.1 载入各种数据科学以及可视化库
import numpy as np
import pandas as pd
from matplotlib import pyplot as plt
win_file_path = 'E:\\competition-data\\017_wisdomOcean\\'

#读取github的数据
df = pd.read_csv(win_file_path + 'DF.csv')
df.head(1)
| Unnamed: 0 | ID | lat | lon | speed | direction | time | type | time_array | dist_array | coord_speed | |
|---|---|---|---|---|---|---|---|---|---|---|---|
| 0 | 0 | 4924 | 44.878993 | -121.048498 | 0.38 | 103 | 2019-11-13 23:59:30 | 围网 | -1.088487 | 19.788529 | -18.179848 |
from tqdm import tqdm
import multiprocessing as mp
import os
import pickle
import random
common_path = 'E:/competition-data/017_wisdomOcean'

def read_train_file(filename=None):
    # 替换数据存放的路径
    Path = common_path + "/hy_round1_train_20200102/"
    return pd.read_csv(Path + filename,encoding="utf-8")

def read_test_file(filename=None):
    # 替换数据存放的路径
    Path = common_path + "/hy_round1_testA_20200102/"
    return pd.read_csv(Path + filename,encoding="utf-8")
class Load_Save_Data():
    def __init__(self,file_name=None):
        self.filename = file_name

    def load_data(self,Path=None):
        if Path is None:
            assert self.filename is not None,"Invalid Path...."
        else:
            self.filename = Path
        with open(self.filename,"wb") as f:
            data = pickle.load(f)
        return data

    def save_data(self,data,path):
        if path is None:
            assert self.filename is not None,"Invalid path...."
        else:
            self.filename = path
        with open(self.filename,"wb") as f:
            pickle.dump(data,f)
# 定义读取数据的函数
def read_data(Path,Kind=""):
    """
    :param Path:待读取数据的存放路径
    :param Kind:'train' of 'test'
    """
    # 替换成数据存放的路径
    filenames = os.listdir(Path)
    print("\n@Read Data From"+Path+"..........")
    data_total = []
    for filename in tqdm(list(filenames)):
        if Kind == 'train':
            data_total.append(read_train_file(filename))
        else:
            data_total.append(read_test_file(filename))
    print("\n@End Read total Data........")
    # load_save = Load_Save_Data()
    # if Kind == "train":
    #     load_save.save_data(data_total,common_path + "/data_tmp/total_data.pkl")
    return data_total
# 训练数据读取

# 存放数据的绝对路径
train_path = common_path + "/hy_round1_train_20200102/"
data_train = read_data(train_path, Kind="train")
data_train = pd.concat(data_train)

# 测试数据读取

# 存放数据的绝对路径
test_path = common_path + "/hy_round1_testA_20200102/"
data_test = read_data(test_path, Kind="test")
data_test = pd.concat(data_test)
100%|█████████████████████████████████████████████████████████████████████████████| 7000/7000 [00:10<00:00, 674.20it/s]
100%|█████████████████████████████████████████████████████████████████████████████| 2000/2000 [00:02<00:00, 713.87it/s]


@Read Data FromE:/competition-data/017_wisdomOcean/hy_round1_train_20200102/..........

@End Read total Data........

@Read Data FromE:/competition-data/017_wisdomOcean/hy_round1_testA_20200102/..........

@End Read total Data........
2.3.5 总体了解数据
查看数据集的样本个数和原始特征维度
data_test.shape
(782378, 6)
data_train.shape
(2699638, 7)
print('data_train.columns')
data_train.columns
data_train.columns


Index(['渔船ID', 'x', 'y', '速度', '方向', 'time', 'type'], dtype='object')
print('data_test.columns')
data_test.columns
data_test.columns


Index(['渔船ID', 'x', 'y', '速度', '方向', 'time'], dtype='object')
查看一下具体的列名,赛题理解部分已经给出具体的特征含义,这里方便阅读再给一下
- 渔船ID:渔船的唯一识别,结果文件以此ID为标识
- x:渔船在平面坐标系下的x轴坐标
- y:渔船在平面坐标系下的y轴坐标
- 速度:渔船当前时刻的航速,单位节
- 方向:渔船当前时刻的航首向,单位度
- time:数据上报时刻,单位月日 时:分
- type:渔船label,作业类型
pd.options.display.max_info_rows = 2699639
data_train.info()
<class 'pandas.core.frame.DataFrame'>
Int64Index: 2699638 entries, 0 to 365
Data columns (total 7 columns):
 #   Column  Non-Null Count    Dtype
---  ------  --------------    -----
 0   渔船ID    2699638 non-null  int64
 1   x       2699638 non-null  float64
 2   y       2699638 non-null  float64
 3   速度      2699638 non-null  float64
 4   方向      2699638 non-null  int64
 5   time    2699638 non-null  object
 6   type    2699638 non-null  object
dtypes: float64(3), int64(2), object(2)
memory usage: 164.8+ MB
data_train.describe([0.01,0.025,0.05,0.5,0.75,0.9,0.99])
| 渔船ID | x | y | 速度 | 方向 | |
|---|---|---|---|---|---|
| count | 2.699638e+06 | 2.699638e+06 | 2.699638e+06 | 2.699638e+06 | 2.699638e+06 |
| mean | 3.496035e+03 | 6.277243e+06 | 5.271190e+06 | 1.784449e+00 | 1.151533e+02 |
| std | 2.020781e+03 | 2.698065e+05 | 2.544160e+05 | 2.478862e+00 | 1.168515e+02 |
| min | 0.000000e+00 | 5.000250e+06 | 3.345433e+06 | 0.000000e+00 | 0.000000e+00 |
| 1% | 6.900000e+01 | 5.258862e+06 | 4.618927e+06 | 0.000000e+00 | 0.000000e+00 |
| 2.5% | 1.710000e+02 | 5.817836e+06 | 4.920685e+06 | 0.000000e+00 | 0.000000e+00 |
| 5% | 3.470000e+02 | 6.024286e+06 | 4.985102e+06 | 0.000000e+00 | 0.000000e+00 |
| 50% | 3.502000e+03 | 6.246522e+06 | 5.229463e+06 | 3.200000e-01 | 8.100000e+01 |
| 75% | 5.243000e+03 | 6.365916e+06 | 5.379267e+06 | 3.290000e+00 | 2.170000e+02 |
| 90% | 6.290000e+03 | 6.592496e+06 | 5.602273e+06 | 4.910000e+00 | 2.930000e+02 |
| 99% | 6.928000e+03 | 7.056209e+06 | 6.111650e+06 | 1.009000e+01 | 3.560000e+02 |
| max | 6.999000e+03 | 7.133785e+06 | 7.667581e+06 | 1.001600e+02 | 3.600000e+02 |
data_train.head(3).append(data_train.tail(3))
| 渔船ID | x | y | 速度 | 方向 | time | type | |
|---|---|---|---|---|---|---|---|
| 0 | 0 | 6.152038e+06 | 5.124873e+06 | 2.59 | 102 | 1110 11:58:19 | 拖网 |
| 1 | 0 | 6.151230e+06 | 5.125218e+06 | 2.70 | 113 | 1110 11:48:19 | 拖网 |
| 2 | 0 | 6.150421e+06 | 5.125563e+06 | 2.70 | 116 | 1110 11:38:19 | 拖网 |
| 363 | 999 | 6.138413e+06 | 5.162715e+06 | 0.32 | 0 | 1031 12:28:01 | 拖网 |
| 364 | 999 | 6.138413e+06 | 5.162715e+06 | 0.32 | 0 | 1031 12:18:00 | 拖网 |
| 365 | 999 | 6.138413e+06 | 5.162715e+06 | 0.11 | 294 | 1031 12:07:59 | 拖网 |
2.3.6查看数据集中特征缺失值、唯一值等
查看缺失值
print(f'There are {data_train.isnull().any().sum()} columns in train dataset with missing values.')
There are 0 columns in train dataset with missing values.
查看训练集测试集中特征属性只有一值的特征
one_value_fea_train = [col for col in data_train.columns if data_train[col].nunique() <= 1]
one_value_fea_train
[]
one_value_fea_test = [col for col in data_test.columns if data_test[col].nunique() <= 1]
one_value_fea_test
[]
结论:
训练集和测试集都不存在为空的列
总结:
6列特征中0列有缺少数据,不存在有唯一值的列,有连续特征和分类特征
2.4 数据特性和特征分布
2.4.1 三类渔船轨迹可视化
data_train['type'].value_counts()
拖网    1681225
围网     626607
刺网     391806
Name: type, dtype: int64
data_train.head(1)
| 渔船ID | x | y | 速度 | 方向 | time | type | |
|---|---|---|---|---|---|---|---|
| 0 | 0 | 6.152038e+06 | 5.124873e+06 | 2.59 | 102 | 1110 11:58:19 | 拖网 |
# 分别从三个类别的数据文件中,随机读取某三个渔船的数据
def get_random_three_traj(type=None):
    """
    :param type: ["刺网", "围网", "拖网"]
    """
    select_data = data_train[data_train['type']==type]
    # print(select_data.head())
    data_arrange = np.array(set(select_data['渔船ID'])).tolist()
    index = random.sample(data_arrange,3)
    # print('random index:', index)
    return select_data[select_data['渔船ID']==index[0]],\
           select_data[select_data['渔船ID']==index[1]],\
           select_data[select_data['渔船ID']==index[2]]
plt.rcParams['font.sans-serif'] = ['SimSun']    # 指定默认字体为新宋体。
plt.rcParams['axes.unicode_minus'] = False
# 每个类别中随机三个渔船的轨迹进行可视化
def visualize_three_traj():
    fig,axes = plt.subplots(nrows=3,ncols=3,figsize=(20,15))
    plt.subplots_adjust(wspace=0.2,hspace=0.2)
    # 对于每一个类别,随机选出刺网的三条轨迹进行可视化
    # lables = ["ciwang","weiwang","tuowang"]
    lables = ["刺网", "围网", "拖网"]
    for i,file_type in (enumerate(lables)):
        data1, data2, data3 = get_random_three_traj(type=file_type)
        for j, datax in enumerate([data1, data2, data3]):
            x_data = datax["x"].loc[-1:].values
            y_data = datax["y"].loc[-1:].values
            axes[i][j - 1].scatter(x_data[0], y_data[0], label="start", c="red", s=10, marker="8")
            axes[i][j - 1].plot(x_data, y_data, label=lables[i])
            axes[i][j - 1].scatter(x_data[len(x_data) - 1], y_data[len(y_data) - 1], label="end", c="green", s=10,
                                   marker="v")
            axes[i][j - 1].grid(alpha=2)
            axes[i][j - 1].legend(loc="best")

    plt.show()


visualize_three_traj()
   渔船ID             x             y    速度   方向           time type
0  1007  6.180241e+06  5.192755e+06  0.22    0  1120 23:48:26   刺网
1  1007  6.180241e+06  5.192755e+06  0.22    0  1120 23:38:23   刺网
2  1007  6.180241e+06  5.192755e+06  0.11  113  1120 23:28:25   刺网
3  1007  6.180241e+06  5.192755e+06  0.00    0  1120 23:18:25   刺网
4  1007  6.180241e+06  5.192755e+06  0.00  127  1120 23:08:24   刺网
random index: [5396, 3595, 6682]
   渔船ID             x             y    速度   方向           time type
0  1000  6.843713e+06  5.480538e+06  2.00  216  1106 23:42:30   围网
1  1000  6.843821e+06  5.480323e+06  2.32  315  1106 23:32:30   围网
2  1000  6.842746e+06  5.479941e+06  6.80   71  1106 23:22:31   围网
3  1000  6.840892e+06  5.479191e+06  6.48   71  1106 23:12:29   围网
4  1000  6.839541e+06  5.478246e+06  7.07  328  1106 23:02:29   围网
random index: [2315, 4160, 4732]
   渔船ID             x             y    速度   方向           time type
0     0  6.152038e+06  5.124873e+06  2.59  102  1110 11:58:19   拖网
1     0  6.151230e+06  5.125218e+06  2.70  113  1110 11:48:19   拖网
2     0  6.150421e+06  5.125563e+06  2.70  116  1110 11:38:19   拖网
3     0  6.149612e+06  5.125907e+06  3.29   95  1110 11:28:19   拖网
4     0  6.148803e+06  5.126252e+06  3.18  108  1110 11:18:19   拖网
random index: [4849, 4987, 393]
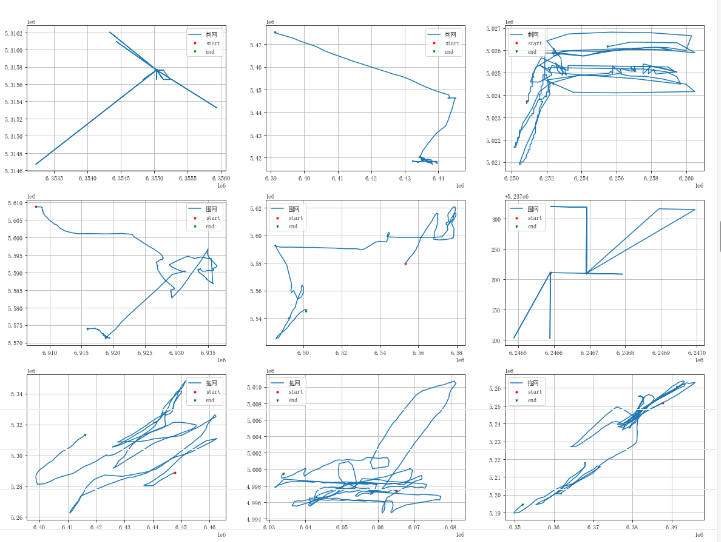
总结:
经过多次打印输出
- 可以看到不同轨迹虽然有不同的变化,但是仍然不具有很强的区分性。
- 刺网的轨迹偏向于具有规则多边形的情形。(一般成立,部分特征很明显)
- 围网的部分轨迹偏向于围成一个圈的情形。 (不好说, 或者是口袋装)
- 拖网的轨迹偏向于点到点,没有拐角的情形。(不好说,也可能比较混乱)
- 整体上来说,不同类别的轨迹仍然不具有很强的区别分性。
2.4.2 坐标序列可视化
随机挑选一位幸运渔船数据进行预测
# 随机选取某条数据,观察x坐标序列和y坐标序列的变化情况
def visualize_one_traj_x_y():
    fig,axes = plt.subplots(nrows=2,ncols=1,figsize=(10,8))
    plt.subplots_adjust(wspace=0.5,hspace=0.5)

    data1 = (get_random_three_traj(type="围网"))[0]
    print(data1)
    x = data1["x"].loc[-1:].values
    x = x / 10000

    y = data1["y"].loc[-1:].values
    y = y / 10000
    print(type(x))
    arr1 = np.arange(len(x))
    arr2 = np.arange(len(y))

    axes[0].plot(arr1,x,label="x")
    axes[1].plot(arr2,y,label="y")
    axes[0].grid(alpha=3)
    axes[0].legend(loc="best")
    axes[1].grid(alpha=3)
    axes[1].legend(loc="best")
    plt.show()


visualize_one_traj_x_y()
   渔船ID             x             y    速度   方向           time type
0  1000  6.843713e+06  5.480538e+06  2.00  216  1106 23:42:30   围网
1  1000  6.843821e+06  5.480323e+06  2.32  315  1106 23:32:30   围网
2  1000  6.842746e+06  5.479941e+06  6.80   71  1106 23:22:31   围网
3  1000  6.840892e+06  5.479191e+06  6.48   71  1106 23:12:29   围网
4  1000  6.839541e+06  5.478246e+06  7.07  328  1106 23:02:29   围网
random index: [6148, 5058, 6958]
     渔船ID             x             y    速度   方向           time type
0    6148  6.236677e+06  5.225194e+06  0.11    0  1113 23:46:15   围网
1    6148  6.236677e+06  5.225194e+06  0.11    0  1113 23:36:18   围网
2    6148  6.236677e+06  5.225194e+06  0.11    0  1113 23:26:15   围网
3    6148  6.236677e+06  5.225194e+06  0.00  112  1113 23:16:13   围网
4    6148  6.236677e+06  5.225194e+06  0.11    0  1113 23:06:14   围网
..    ...           ...           ...   ...  ...            ...  ...
394  6148  6.204933e+06  5.068960e+06  8.42   71  1111 00:49:58   围网
395  6148  6.202473e+06  5.068347e+06  8.90   71  1111 00:39:56   围网
396  6148  6.199913e+06  5.067845e+06  8.31   71  1111 00:29:57   围网
397  6148  6.197453e+06  5.067234e+06  9.01   81  1111 00:19:55   围网
398  6148  6.194891e+06  5.066625e+06  5.50   50  1111 00:09:58   围网

[399 rows x 7 columns]
<class 'numpy.ndarray'>
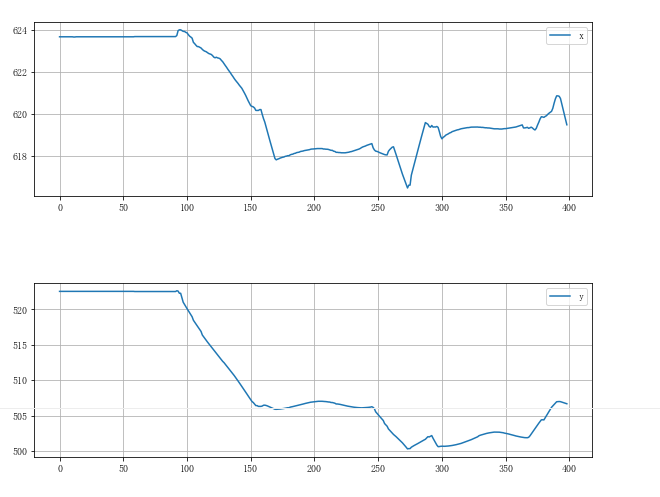
总结:
- 通过对坐标x和坐标y序列的可视化,发现两个序列存在同时不变的情况,也就是速度数据一直在该序列中一直接近于0,因此可以判断存在POI点。
POI:"POI"是"Point of Interest"的缩写,表示加油站、邮局等重要位置信息点。
# 每类轨迹,随机选取某个渔船,可视化速度序列和方向序列
def visualize_three_traj_speed_direction():
    fig,axes = plt.subplots(nrows=3,ncols=2,figsize=(20,15))
    plt.subplots_adjust(wspace=0.3,hspace=0.3)
    # 随机选出刺网的三条轨迹进行可视化
    file_types = ["刺网", "围网", "拖网"]
    speed_types = ["ciwang_speed","weiwang_speed","tuowang_speed"]
    doirections = ["ciwang_direction","weiwang_direction","tuowang_direction"]
    colors = ['pink', 'lightblue', 'lightgreen']
    for i,file_name in tqdm(enumerate(file_types)):
        datax = (get_random_three_traj(type=file_name))[0]
        x_data = datax["速度"].loc[-1:].values
        y_data = datax["方向"].loc[-1:].values
        axes[i][0].plot(range(len(x_data)), x_data, label=speed_types[i], color=colors[i])
        axes[i][0].grid(alpha=2)
        axes[i][0].legend(loc="best")
        axes[i][1].plot(range(len(y_data)), y_data, label=doirections[i], color=colors[i])
        axes[i][1].grid(alpha=2)
        axes[i][1].legend(loc="best")

    plt.show()


visualize_three_traj_speed_direction()
3it [00:00, 3.76it/s]

总结:
-
不同轨迹速度的数据分布,均存在连续的低值,因此强化了对POI (key site)点存在的判断。
-
每个类别的渔船方向变化很快,可以判定为渔船在海上漂泊造成,因此此特征对于类别的判断不具有很强的区分性。
-
无明显特征或者规律可以用于进行区分.
2.4.4 三类渔船速度和方向的数据分布
# 对某一特征进行数据统计
def get_data_cummulation(type=None,path=None,kind=None,columns=None):
    """
    :param type:"ciwang","weiwang" or "tuowang"
    :param path:存放数据路径
    :param kind: '速度' or  '方向'
    :param columns:与kind对应,'speed' or 'direction'
    """

    return data_train[data_train['type']==type][kind]
# 分别得到速度和方向的分布数据
def get_speed_and_direction_distribution_data(type=None):
    """
    :param type:"ciwang","weiwang" or "tuowang"
    """
    path = "./data_tmp/"
    data_speed_df = get_data_cummulation(type=type, path=path,kind="速度",columns="speed")
    data_direction_df = get_data_cummulation(type=type,path=path,kind="方向",columns="direction")
    return data_speed_df,data_direction_df
import seaborn as sns
# 可视化速度和方向的数据分布
df_speeds = []
df_directions = []


def plot_speed_direction1_distribution():
    plt.subplots(nrows=1, ncols=2, figsize=(15, 6))
    plt.subplots_adjust(wspace=0.3, hspace=0.5)

    file_types = ["刺网", "围网", "拖网"]
    lables = ["target==cw", "target==ww", "target==tw"]
    colors = ["red", "green", "blue"]

    for i, filenames in enumerate(file_types):
        df11, df21 = get_speed_and_direction_distribution_data(file_types[i])
        plt.subplot(1,2,1)
        ax1 = sns.kdeplot(df11.values / 1000000, color=colors[i],shade=True)
        plt.subplot(1,2,2)
        ax3 = sns.kdeplot(df21.values / 1000000, color=colors[i],shade=True)
        df_speeds.append(df11)
        df_directions.append(df21)
    ax1.legend(lables)
    ax1.set_xlabel("Speed")
    ax3.set_xlabel("Direction")
    ax3.legend(lables)
    plt.show()
plot_speed_direction1_distribution()
D:\Anaconda3\lib\site-packages\ipykernel_launcher.py:17: MatplotlibDeprecationWarning: Adding an axes using the same arguments as a previous axes currently reuses the earlier instance.  In a future version, a new instance will always be created and returned.  Meanwhile, this warning can be suppressed, and the future behavior ensured, by passing a unique label to each axes instance.
D:\Anaconda3\lib\site-packages\ipykernel_launcher.py:19: MatplotlibDeprecationWarning: Adding an axes using the same arguments as a previous axes currently reuses the earlier instance.  In a future version, a new instance will always be created and returned.  Meanwhile, this warning can be suppressed, and the future behavior ensured, by passing a unique label to each axes instance.

# 使用分位图对速度和方向的数据分布进行可视化
def plot_speed_direction2_distribution():
    fig,axes = plt.subplots(nrows=1, ncols=2, figsize=(15, 6))
    plt.subplots_adjust(wspace=0.3, hspace=0.5)
    colors_box = ['pink', 'lightblue', 'lightgreen']

    bplot1 = axes[0].boxplot([df_speeds[0].values,df_speeds[1].values,df_speeds[2].values]
                       , vert=True
                       , patch_artist=True
                       , labels=["cw", "ww", "tw"])
    bplot2 = axes[1].boxplot([df_directions[0].values, df_directions[1].values, df_directions[2].values]
                       , vert=True
                       , patch_artist=True
                       , labels=["cw", "ww", "tw"])

    for blpot in (bplot1,bplot2):
        for patch,color in zip(blpot["boxes"],colors_box):
            patch.set_facecolor(color)

    axes[0].set_title("speed")
    axes[1].set_title("direction")
    plt.show()


plot_speed_direction2_distribution()

总结
- 无论是分布图,还是分位图,都可以发现不同类型轨迹的速度数据分布存在很大的差异。
- 无论是分布图,还是分位图,都可以发现不同类型轨迹的方向数据分布差异不是特别明显。
总结
通过以上的数据分析,我们可以得到以下结论
-
每个特征中不存在缺失值和唯一值。
-
存在异常轨迹,该轨迹只含有几个点。
-
虽然不同类别的轨迹有不同的变化倾向,但是整体来说,不具有很强的区分性。
-
通过对坐标序列的分析,发现存在POI点。
-
通过对不同类别的速度数据分布可视化,发现速度具有很强的区分性。
-
通过对不同类别的方向数据分布可视化,发现方向的区分性不是特别强。
作业:
- 请尝试用Task1中的异常处理代码对异常数据进行删除之后,再分别绘制速度和方向的数据分布图、速度和方向的分位图。
基本逻辑同上, 不再重复
2.在前面我们已经进行了绘制速度和方向的数据分布图。由Task1的keperl.gl可知,不同地理位置和船舶类型的相关性较大。请尝试将相同类型船舶的轨迹给拼接起来并绘制经度和纬度的总体分布特征。
作业2的代码逻辑
相同类型船舶, 绘制经纬度图
win_file_path = 'E:\\competition-data\\017_wisdomOcean\\'
DF = pd.read_csv(win_file_path + 'DF.csv')
DF.head(1)
| Unnamed: 0 | ID | lat | lon | speed | direction | time | type | time_array | dist_array | coord_speed | |
|---|---|---|---|---|---|---|---|---|---|---|---|
| 0 | 0 | 4924 | 44.878993 | -121.048498 | 0.38 | 103 | 2019-11-13 23:59:30 | 围网 | -1.088487 | 19.788529 | -18.179848 |
def get_lat_lon_data(df, file_type):
    return df[df['type']==file_type]['lat'], df[df['type']==file_type]['lon']

# 相同类型船舶, 绘制经纬度图
def plot_same_type_lat_lon_distribution(df):
    plt.subplots(nrows=1, ncols=2, figsize=(15, 6))
    plt.subplots_adjust(wspace=0.3, hspace=0.5)

    file_types = ["刺网", "围网", "拖网"]
    lables = ["target==cw", "target==ww", "target==tw"]
    colors = ["red", "green", "blue"]

    for i, filenames in enumerate(file_types):
        df11, df21 = get_lat_lon_data(df, file_types[i])
        plt.subplot(1,2,1)
        ax1 = sns.kdeplot(df11.values , color=colors[i],shade=True)
        plt.subplot(1,2,2)
        ax3 = sns.kdeplot(df21.values , color=colors[i],shade=True)
    ax1.legend(lables)
    ax1.set_xlabel("纬度")
    ax3.set_xlabel("经度")
    ax3.legend(lables)
    plt.show()

plot_same_type_lat_lon_distribution(DF)
D:\Anaconda3\lib\site-packages\ipykernel_launcher.py:15: MatplotlibDeprecationWarning: Adding an axes using the same arguments as a previous axes currently reuses the earlier instance.  In a future version, a new instance will always be created and returned.  Meanwhile, this warning can be suppressed, and the future behavior ensured, by passing a unique label to each axes instance.
  from ipykernel import kernelapp as app
D:\Anaconda3\lib\site-packages\ipykernel_launcher.py:17: MatplotlibDeprecationWarning: Adding an axes using the same arguments as a previous axes currently reuses the earlier instance.  In a future version, a new instance will always be created and returned.  Meanwhile, this warning can be suppressed, and the future behavior ensured, by passing a unique label to each axes instance.

参考文献
你不逼自己一把,你永远都不知道自己有多优秀!只有经历了一些事,你才会懂得好好珍惜眼前的时光!

 浙公网安备 33010602011771号