

linux 搭建elk7.5.1集群并且安装x-pack
一、安装前准备
1、组件介绍:
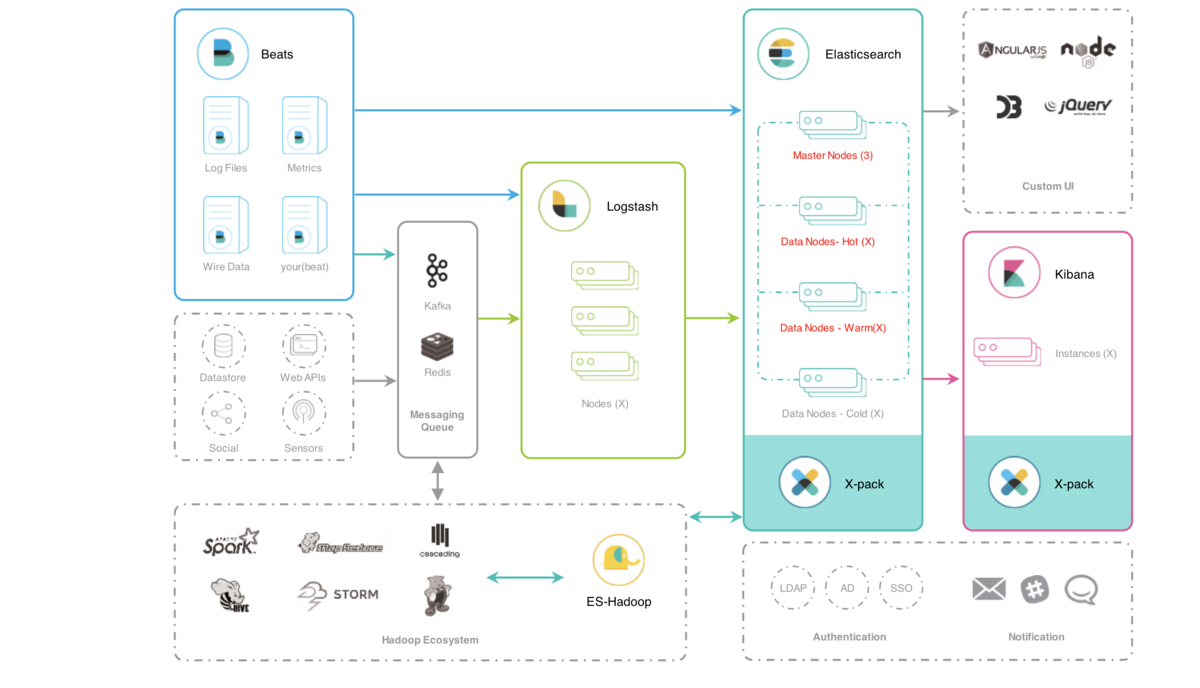
*Filebeat是一个日志文件托运工具,在你的服务器上安装客户端后,filebeat会监控日志目录或者指定的日志文件,追踪读取这些文件(追踪文件的变化,不停的读)*Redis是非关系型数据库,是存储热数据使用的。*Logstash是一根具备实时数据传输能力的管道,负责将数据信息从管道的输入端传输到管道的输出端;与此同时这根管道还可以让你根据自己的需求在中间加上滤网,Logstash提供里很多功能强大的滤网以满足你的各种应用场景*ElasticSearch它提供了一个分布式多用户能力的全文搜索引擎,基于RESTful web接口*Kibana是ElasticSearch的用户界面Elastic的技术架构可以简单,也可以高级,它是很具有扩展性的,最简单的技术架构就是使用Beats进行数据的收集,Beats是一种抽象的称呼,具体的可以是使用FileBeat收集数据源为文件的数据或者使用TopBeat来收集系统中的监控信息,可以说类似Linux系统中的TOP命令,当然还有很多的Beats的具体实现,再使用logstash进行数据的转换和导入到Elasticsearch中,最后使用Kibana进行数据的操作以及数据的可视化等操作。
当然,在生产环境中,我们的数据可能在不同的地方,例如关系型数据库Postgre,或者MQ,再或者Redis中,我们可以统一使用Logstash进行数据的转换,同时,也可以根据数据的热度不同将ES集群架构为一种冷温热架构,利用ES的多节点,将一天以内的数据称谓热数据,读写频繁,就存放在ES的热节点中,七天以内的数据称之为温数据,就是偶尔使用的数据存放在温节点中,将极少数会用到的数据存放在冷节点中。
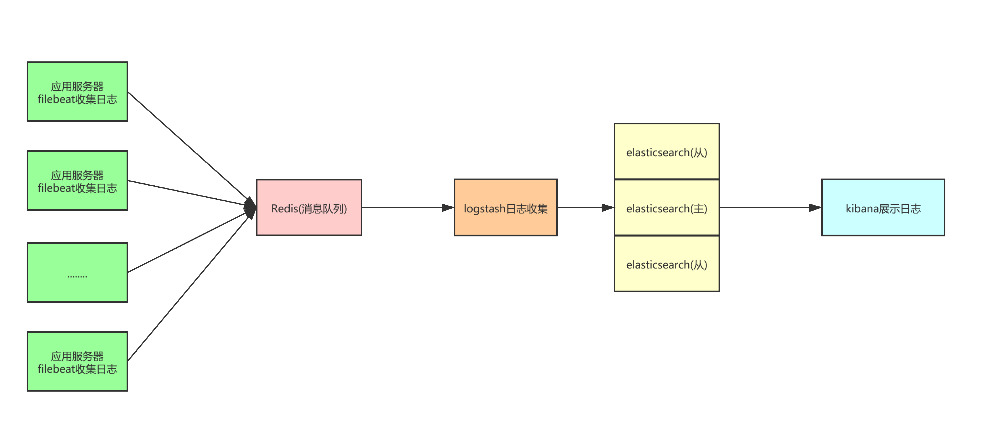
3、本次架构
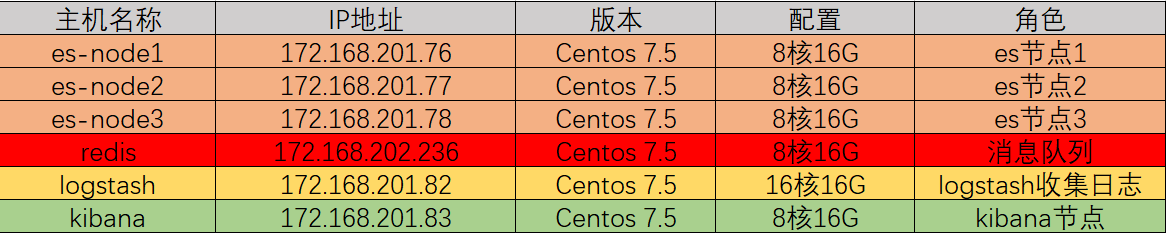
4、环境准备的机器
主机角色,配置(内存不要低于8核16G):
5、软件版本下载
注意:这边根据实际情况
|
1
2
3
4
5
|
jdk 1.8.0_171 #jdk安装这边就不说了elasticsearch-7.5.1-x86_64.rpmkibana-7.5.1-x86_64.rpmlogstash-7.5.1-x86_64.rpmfilebeat-7.5.1-x86_64.rpm |
安装包下载:
|
1
2
3
4
|
wget https://artifacts.elastic.co/downloads/elasticsearch/elasticsearch-7.5.1-x86_64.rpmwget https://artifacts.elastic.co/downloads/kibana/kibana-7.5.1-x86_64.rpmwget https://artifacts.elastic.co/downloads/logstash/logstash-7.5.1.rpmwget https://artifacts.elastic.co/downloads/beats/filebeat/filebeat-7.5.1-x86_64.rpm |
这边要说明一下,由于elk是国外的网站,所以下载特别的慢,建议使用迅雷下载。
三、安装elasticsearch
1、安装elasticsearch
|
1
|
rpm -ivh elasticsearch-7.5.1-x86_64.rpm |
2、配置elasticsearch.yml
|
1
2
3
4
5
6
7
8
9
10
11
12
13
14
15
16
17
18
|
#配置JVM参数,最大不要超过32G,并且留一半内存给操作系统,默认是1g[root@es-node1 config]# vim jvm.options-Xms4g-Xmx4g #配置elastic信息,其他节点需要修改node.name和network.host的值[root@es-node1 config]# cd /etc/elasticsearch[root@es-node1 config]# cp elasticsearch.yml elasticsearch.yml-bak[root@es-node1 config]# vim elasticsearch.yml[root@es-node1 config]# grep "^[a-z]" elasticsearch.ymlcluster.name: my-esnode.name: node-1 #当前节点名path.data: /data/espath.logs: /var/log/elasticsearchnetwork.host: 172.168.201.76 #本地ip地址http.port: 9200discovery.seed_hosts: ["172.168.201.76","172.168.201.77","172.168.201.78"] #集群使用,如果单台的话,就直接是 ["172.168.201.76"]cluster.initial_master_nodes: ["node-1","node-2","node-3"] # 集群使用,如果是单台的话则是["node-1"] |
如果是挂存储的时候(NFS方式),则:(参考:https://www.cnblogs.com/zhangqigao/p/8818783.html)
|
1
2
3
|
[192.168.201.76@~ ]mount -t nfs 172.168.201.20:/data/esnode01 /data[192.168.201.77@~ ]mount -t nfs 172.168.201.20:/data/esnode02 /data[192.168.201.78@~ ]mount -t nfs 172.168.201.20:/data/esnode03 /data |
在存储的机器上,赋予所有权限
|
1
|
[172.168.201.20@~] chmod 777 /data/* |
如果不挂存储,则在本地创建data目录:
|
1
2
3
4
|
[root@es-node1 ~]# mkdir -pv /data/es/mkdir: 已创建目录 "/data"mkdir: 已创建目录 "/data/es/"[root@es-node1 ~]# chown -R elastic:elastic /data/es/ |
3、启动服务
|
1
2
3
|
~]# systemctl daemon-reload~]# systemctl start elasticsearch~]# systemctl status elasticsearch |
如需加入开机启动的话:
|
1
|
~]#systemctl enable elasticsearch |
检查是否启动:
|
1
2
3
4
5
6
|
[elastic@es-node1 elasticsearch]$ netstat -tnlpProto Recv-Q Send-Q Local Address Foreign Address State PID/Program name tcp 0 0 172.168.201.76:9200 0.0.0.0:* LISTEN 2072/java #9200是http协议的RESTful接口 tcp 0 0 172.168.201.76:9300 0.0.0.0:* LISTEN 2072/java #9300是tcp通讯端口,集群间和TCPClient都走的它 tcp 0 0 0.0.0.0:22 0.0.0.0:* LISTEN - tcp6 0 0 :::22 :::* LISTEN - |
4、配置集群中的另外节点node-2 和 node 3
其他节点配置和node-1是一模一样的,只需要改动配置文件中的节点名和本地IP地址即可:
如:node-2和node-3节点配置修改地方:
|
1
2
3
4
5
6
7
|
#节点node-2的修改:node.name: node-2 #节点名修改为node-2network.host: 192.168.201.77 #本机ip地址#节点node-3的修改:node.name: node-3 #节点名修改为node-3network.host: 192.168.201.78 #本机ip地址 |
然后启动方式跟node-1是一样的。
在浏览器中访问: http://172.9.201.76:9200
|
1
2
3
4
5
6
7
8
9
10
11
12
13
14
|
name "node-76"cluster_name "my-es"cluster_uuid "FhxctUHqTz6eJZCkDuXwPQ"versionnumber "7.5.1"build_flavor "default"build_type "rpm"build_hash "65b6179"build_date "2019-05-15T20:06:13.172855Z"build_snapshot falselucene_version "7.7.0"minimum_wire_compatibility_version "5.6.0"minimum_index_compatibility_version "5.0.0"tagline "You Know, for Search" |
5、ES的集群的相关查询
查询集群的状态的方法(第1种):
|
1
|
~]# curl -XGET 'http://192.168.201.76:9200/_cat/nodes' //随意一台es中可执行,也可更换其中的 ip(这里可22或23) |

这边还需注意的是:如果三个节点中有一个节点挂不上,则清理一下 数据文件夹。即:rm -fr /data/es/data下的数据,然后再重启es
四、搭建Kibana
1、安装kibana
|
1
|
[root@shtw-kibana01 ~]# rpm -ivh kibana-7.5.1-x86_64.rpm |
2、配置kibana
说明:虽然我们搭建了三台es的集群,但是我们在kibana.yml的elasticsearch.hosts只能配置一台es的主机,所以我们这边一般配置master这一台。
|
1
2
3
4
5
6
7
|
[root@shtw-kibana01 ~]# cd /etc/kibana[root@shtw-kibana01 ~]# cp kibana.yml kibana.yml-bak[root@shtw-kibana01 ~]# vim kibana.ymlserver.port: 5601 #监听的端口server.host: "172.168.201.83" #监听的地址elasticsearch.hosts: ["http://172.168.201.76:9200"] #elasticsearch访问的URL地址i18n.locale: "zh-CN" #改成简体中文方式 |
3、启动kibana
|
1
2
|
systemctl start kibanasystemctl enable kibana #加入开启启动 |
查看kibana报错:
|
1
|
journalctl -xe |
我们可以看到启动后服务监听的地址,访问这个URL:172.9.201.83:5601
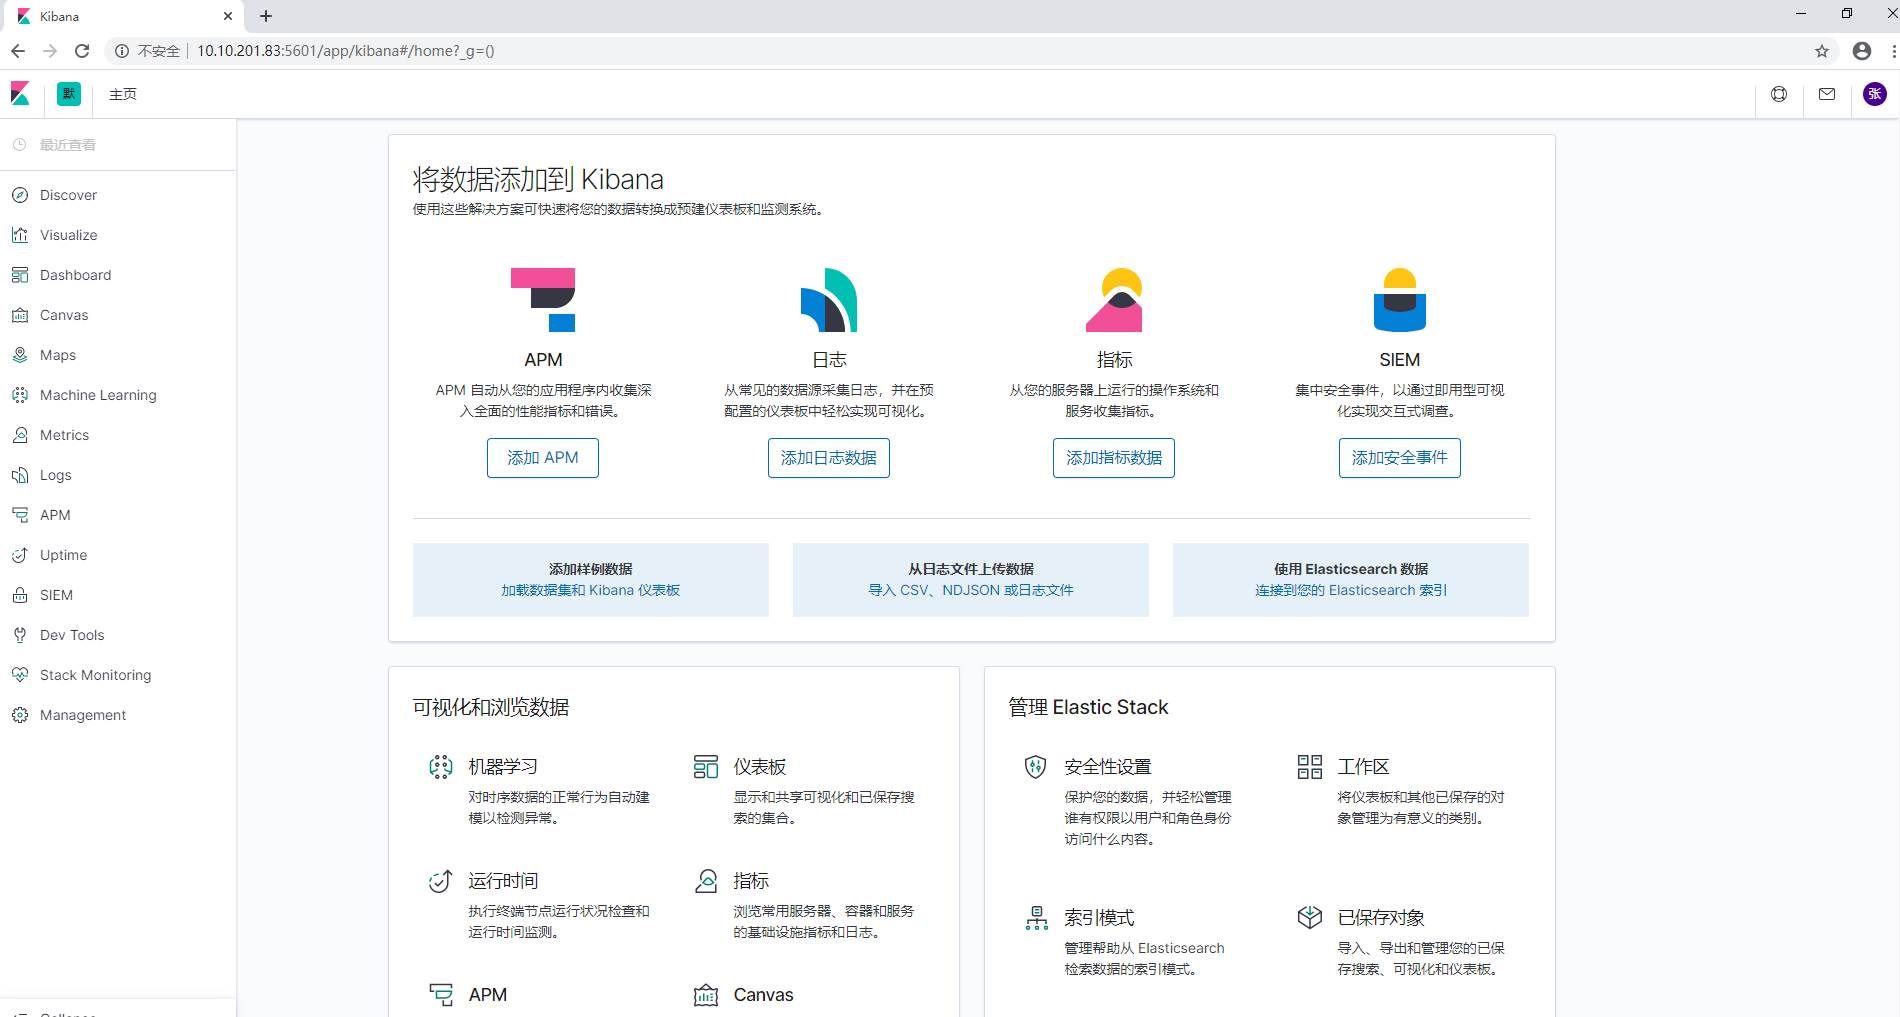
kibana主页面,大致意思就是告诉我们kibana可以做哪些事
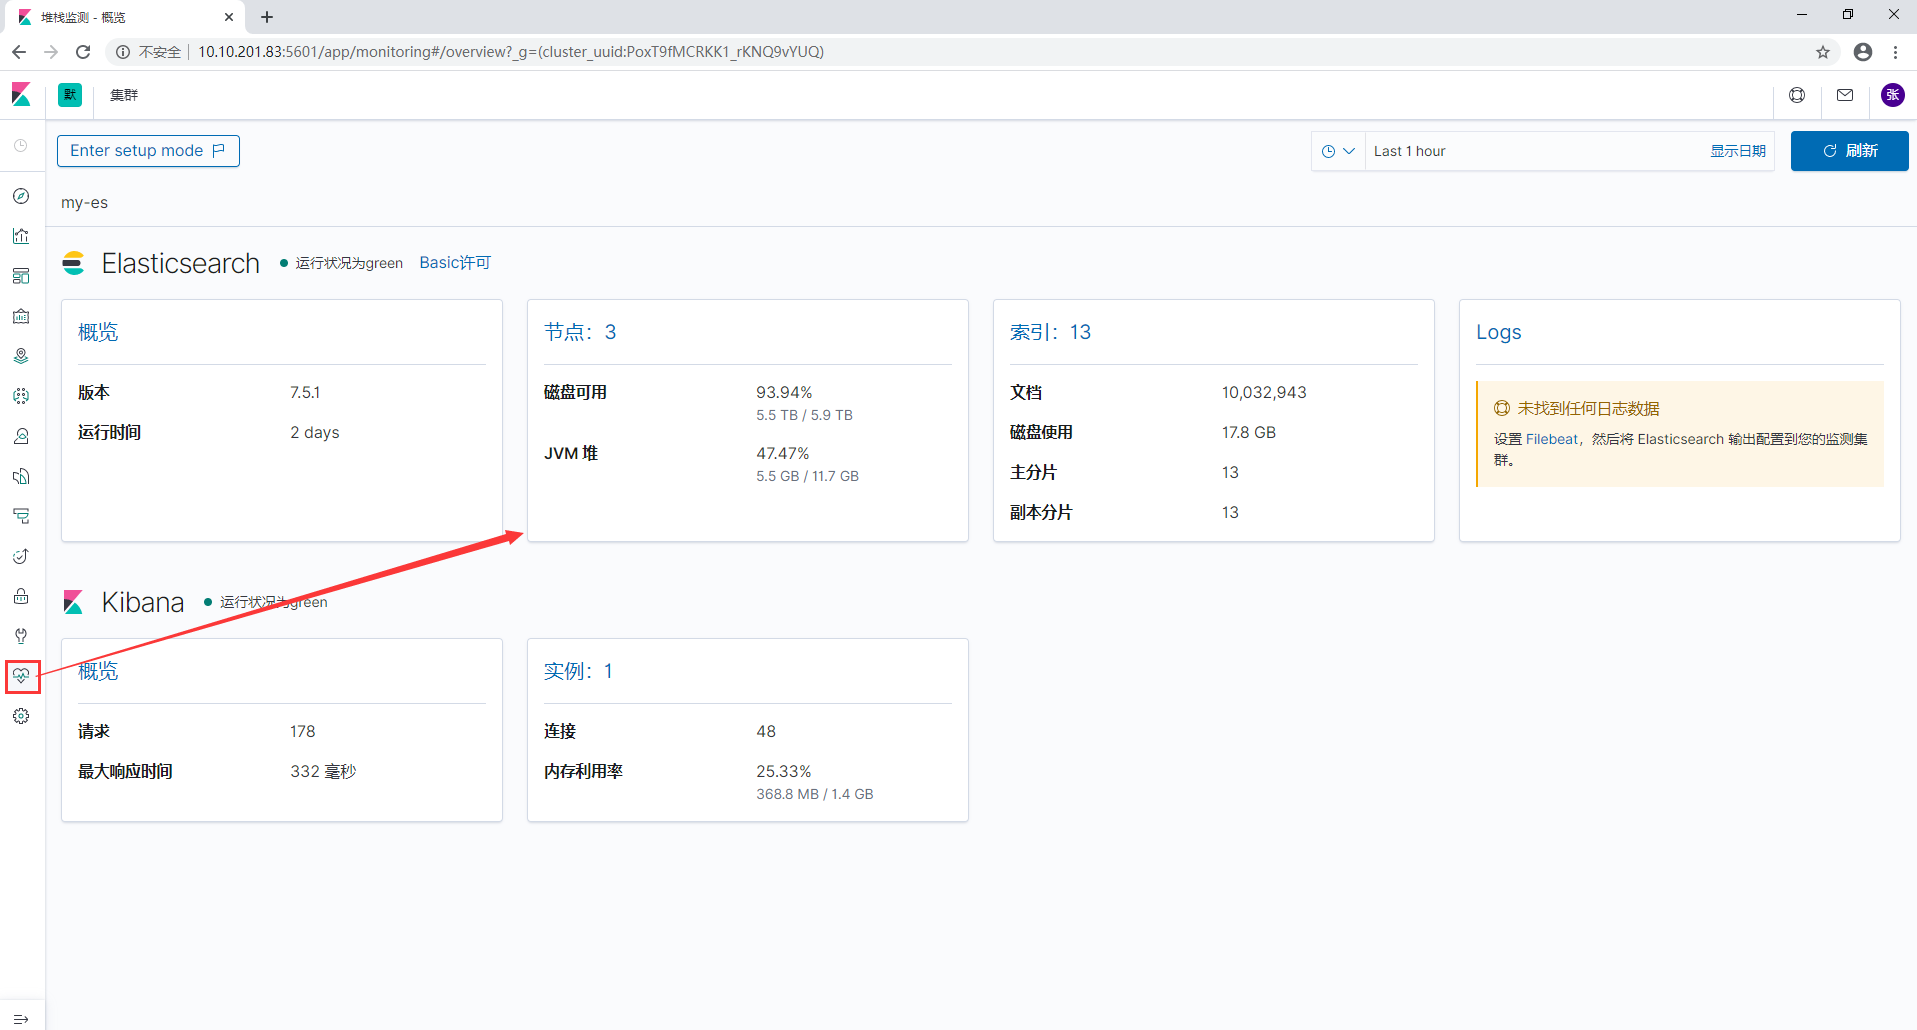
点击Monitoring标签可以开启监控设置
4、安装head
安装head同elasticsearch6 参考 https://www.cnblogs.com/minseo/p/9117470.html
五、配置SSL并启用X-pack
5.1、X-pack是什么?
X-Pack是Elastic Stack扩展功能,提供安全性,警报,监视,报告,机器学习和许多其他功能。 ES7.0+之后,默认情况下,当安装Elasticsearch时,会安装X-Pack,无需单独再安装。
自6.8以及7.1+版本之后,基础级安全永久免费。
基础版本安全功能列表如下:
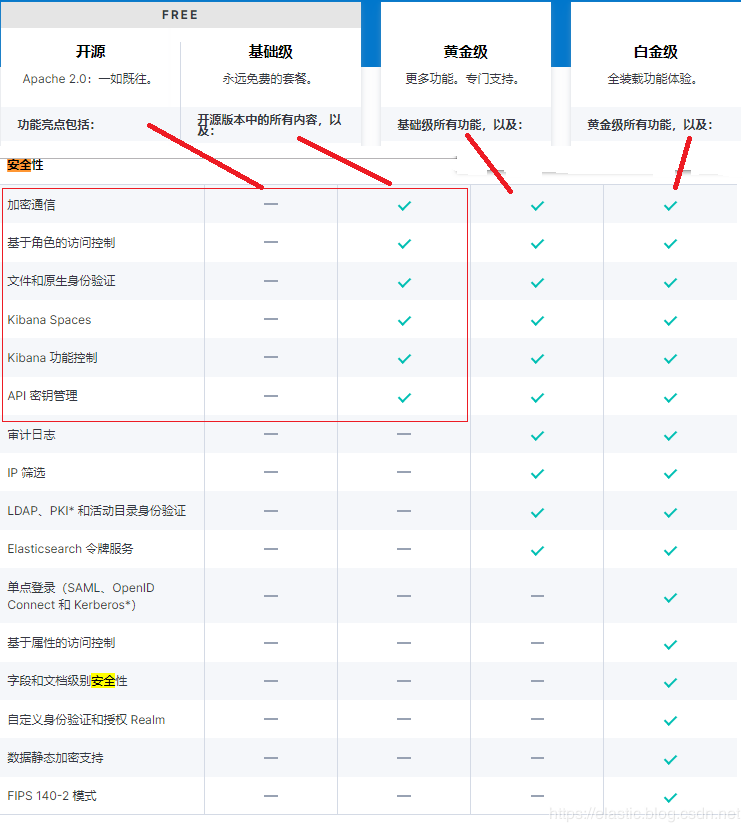
X-Pack安全配置的核心三步骤:
- 第一:设置:xpack.security.enabled: true。
- 第二:生成TLS证书。
- 第三:配置加密通信。
- 第四:设置密码。
5.2、单节点ES X-pack安全如何配置?
5.2.1、安全配置
默认情况下,拥有安全免费许可证时,Elasticsearch安全功能被禁用。 要启用安全功能,需要设置xpack.security.enabled。
在每个节点(包括node-1、node-2、node-3)的elasticsearch.yml配置文件中,新增:
|
1
|
xpack.security.enabled: true |
5.2.2、为节点间通信配置传输层安全性(TLS/SSL)
使用范围:配置传输层安全性适用于具有多个节点的集群以及需要外网通信访问的单节点ES。
使用环回地址127.0.0.1的单节点ES可以不用配置。
5.2.2.1、加密通信
Elasticsearch节点可能存储是机密的数据,而无处不在的网络攻击对这些数据垂涎欲滴。
网络攻击包括对数据的嗅探,对数据的操纵,以及试图获得对服务器的访问权限,进而访问存储数据的文件。
保护节点的安全有助于降低来自网络的攻击的风险。
5.2.2.2、生成节点证书
1、证书实现加密通信的原理
TLS需要X.509证书(X.509 证书是一个数字证书,它使用 X.509 公有密钥基础设施标准将公有密钥与证书中包含的身份相关联。X.509 证书由一家名为证书颁发机构 (CA) 的可信实体颁发。CA 持有一个或多个名为 CA 证书的特殊证书,它使用这种证书来颁发 X.509 证书。只有证书颁发机构才有权访问 CA 证书)才能对与之通信的应用程序执行加密和身份验证。 为了使节点之间的通信真正安全,必须对证书进行验证。
在Elasticsearch集群中验证证书真实性的推荐方法是信任签署证书的证书颁发机构(CA)。这样,只需要使用由同一CA签名的证书,即可自动允许该节点加入集群。
2、借助elasticsearch-certutil命令生成证书
|
1
2
3
4
5
6
7
8
9
10
11
12
13
|
[root@shtw-esnode01 ~]# cd /usr/share/elasticsearch/[root@shtw-esnode01 ~]# ./elasticsearch-certutil ca -out /etc/elasticsearch/elastic-certificates.p12 -pass ""[root@shtw-esnode01 ~]# chown -R elasticsearch:elasticsearch /etc/elasticsearch/elastic-certificates.p12[root@shtw-esnode01 ~]# ll /etc/elasticsearch/ -rw------- 1 elasticsearch elasticsearch 2524 Feb 27 14:45 elastic-certificates.p12-rw-rw---- 1 root elasticsearch 199 Feb 27 13:58 elasticsearch.keystore-rw-rw---- 1 root elasticsearch 3138 Feb 27 15:14 elasticsearch.yml-rw-rw---- 1 root elasticsearch 2276 Feb 27 14:09 jvm.options-rw-rw---- 1 root elasticsearch 17545 Dec 17 07:10 log4j2.properties-rw-rw---- 1 root elasticsearch 473 Dec 17 07:10 role_mapping.yml-rw-rw---- 1 root elasticsearch 197 Dec 17 07:10 roles.yml-rw-rw---- 1 root elasticsearch 0 Dec 17 07:10 users-rw-rw---- 1 root elasticsearch 0 Dec 17 07:10 users_roles |
将证书拷贝到其他节点,放入 /etc/elasticsearch 目录下
|
1
2
3
|
[elastic@es-node1 config]$ cd /etc/elasticsearch/[elastic@es-node1 config]$ scp elastic-certificates.p12 172.168.201.77:/etc/elasticsearch/[elastic@es-node1 config]$ scp elastic-certificates.p12 172.168.201.78:/etc/elasticsearch/ |
3、配置加密通信
启用安全功能后,必须使用TLS来确保节点之间的通信已加密。
在elasticsearch.yml中心新增配置如下:(其他节点相同配置)
|
1
2
3
4
|
xpack.security.transport.ssl.enabled: truexpack.security.transport.ssl.verification_mode: certificatexpack.security.transport.ssl.keystore.path: elastic-certificates.p12xpack.security.transport.ssl.truststore.path: elastic-certificates.p12 |
重启elasticsearch服务,这个时候发现登录用户还是不行,不要着急,这边还需要配置kibana使用用户名密码登录
5.2.3、设置集群密码
因为你上面已经做了SSL通信,所以只需要在第一台es(master)上设置用户名和密码就可以了,其他的2台es就会是相同的用户名密码
|
1
2
3
4
5
6
7
8
9
10
11
12
13
14
15
16
17
18
19
20
21
22
23
24
25
26
27
28
29
30
31
32
33
34
|
[elastic@es-node1 bin]$ cd /usr/share/elasticsearch/bin[elastic@es-node1 bin]$ ./elasticsearch-setup-passwords -h #查看命令帮助Sets the passwords for reserved users Commands--------auto - Uses randomly generated passwords #主要命令选项,表示系统将使用随机字符串设置密码interactive - Uses passwords entered by a user #主要命令选项,表示使用用户输入的字符串作为密码 Non-option arguments:command Option Description ------ ----------- -h, --help show help -s, --silent show minimal output-v, --verbose show verbose output[elastic@es-node1 bin]$ ./elasticsearch-setup-passwords auto #为了演示效果,这里我们使用系统自动创建Initiating the setup of passwords for reserved users elastic,kibana,logstash_system,beats_system.The passwords will be randomly generated and printed to the console.Please confirm that you would like to continue [y/N]y #选择y Changed password for user kibana #kibana角色和密码PASSWORD kibana = 4VXPRYIVibyAbjugK6Ok Changed password for user logstash_system #logstash角色和密码PASSWORD logstash_system = 2m4uVdSzDzpt9OEmNin5 Changed password for user beats_system #beast角色和密码PASSWORD beats_system = O8VOzAaD3fO6bstCGDyQ Changed password for user elastic #elasticsearch角色和密码PASSWORD elastic = 1TWVMeN8tiBy917thUxq |
可以先将以上用户和密码保存下来,具体的用户介绍见最后,这边最好保存在有道云笔记中,方便记录。
核心:
auto - 随机生成密码。
interactive - 自定义不同用户的密码。
注意:必须配置好xpack之后,才能设置密码。否则会报错。
配置kibana添加elasticsearch用户认证:
|
1
2
3
4
|
[root@kb-kibana1 ~]# vim /etc/kibana/kibana.yml[root@kb-kibana1 ~]# grep "^elastic" kibana.ymlelasticsearch.username: "elastic"elasticsearch.password: "1TWVMeN8tiBy917thUxq" #就是上一步创建的elastic的账号和密码 |
重启kibana,重启后打开kibana web页面:
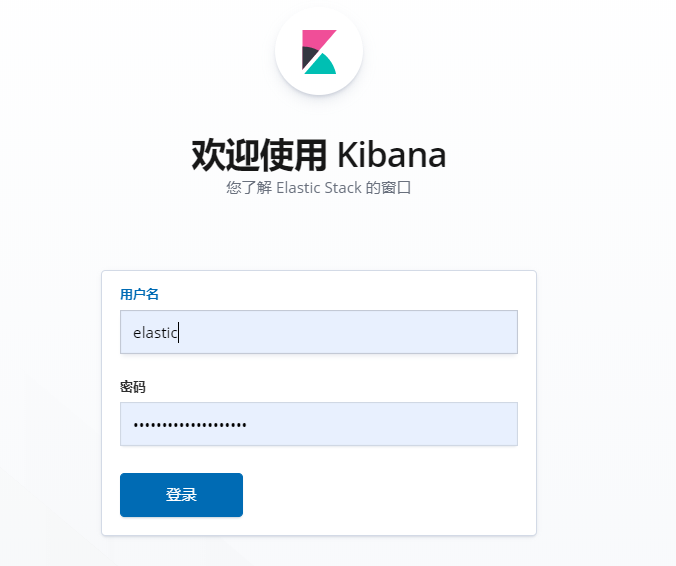
可以使用用户名和密码登录了(使用之前创建的用户名和密码登录即可),这里我们选择elastic用户登录
以上认证参考博客:https://blog.csdn.net/laoyang360/article/details/102877770
这边redis的安装我就不说了,参考:https://www.cnblogs.com/zhangqigao/p/12331543.html
定时清理es上的索引日志的脚本:
|
1
2
3
4
5
6
7
8
9
10
11
12
13
|
[root@shtw-esnode01 ~]# mkdir -p /script[root@shtw-esnode01 ~]# vim delelk.sh#!/bin/bash#定时清除elk索引,2天DATE=$(date -d "2 days ago" +%Y.%m.%d)echo "curl -XDELETE "http://10.10.201.76:9200/*-${DATE}" -u elastic:43tYibP5ldN88ND2Vxci"curl -XDELETE "http://192.168.201.76:9200/*-${DATE}" -u elastic:43tYibP5ldN88ND2Vxci[root@shtw-esnode01 ~]# chmod +x delelk.sh[root@shtw-esnode01 ~]# crontab -e0 0 * * * /script/delelk.sh >> /var/log/elk.log 2>&1 |
五、安装logstash收集日志
1、安装logstash
|
1
|
[root@shtw-logstash01 ~]# rpm -ivh logstash-7.5.1.rpm |
2、配置logstash
|
1
2
3
4
5
|
[root@shtw-logstash01 logstash]# cd /etc/logstash[root@shtw-logstash01 logstash]# vim logstash.ymlpath.data: /data/logstash #配置数据路径http.host: "172.9.201.82" #配置主机名path.logs: /var/log/logstash |
新增日志数据文件夹:
|
1
2
|
mkdir /data/logstash -pchown -R logstash:logstash /data/logstash |
3、配置conf文件
|
1
2
3
|
[~#]cd /etc/logstash/[~#]cp logstash-sample.conf logstash.conf[~#]vim logstash.conf |
配置如下:
# Sample Logstash configuration for creating a simple
# Beats -> Logstash -> Elasticsearch pipeline.
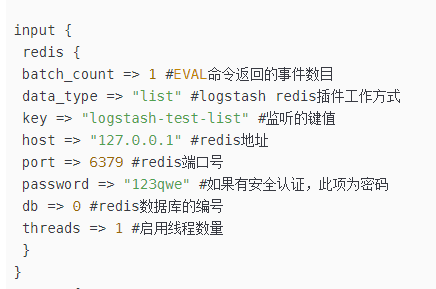
input {
redis {
host => "172.168.202.236"
port => "6379"
data_type => "list"
key => "elk"
type => "redis-input"
batch_count => 1
}
redis {
host => "172.168.202.236"
port => "6379"
data_type => "list"
key => "propertyCustomer" #这个key的值是在filebeat的那边设置的
type => "redis-input"
tags => ["propertyCustomer"] #设置tags
threads => 16
}
}
filter {
if [fields][level] == "error" and "[ip]" not in [message] {
throttle {
period => 600 #统计周期600秒
max_age => 1200 #最大有效周期1200秒
before_count => -1 #最小值
after_count => 5 #最大值
key => "%{[fields][host]}" #要统计的字段
add_tag => "throttled" #打tag
}
}
if "propertyCustomer" in [tags] {
grok {
match => { "message" => "\[ip\]|登陆过期|节点的权限|该流程已结束" }
add_tag => "dingding"
}
grok{
match => {
#截取log4j2的时间戳
"message" => "(?<itime_str>\[[0-9]{4}[-][0-9]{1,2}[-][0-9]{1,2}[ ][0-9]{1,2}[:][0-9]{1,2}[:][0-9]{1,2}[.][0-9]{1,3}\])"
}
}
grok{
match => {
#截取时间
"itime_str" => "(?<itime>[0-9]{4}[-][0-9]{1,2}[-][0-9]{1,2}[ ][0-9]{1,2}[:][0-9]{1,2}[:][0-9]{1,2}[.][0-9]{1,3})"
}
}
date{
match=>["itime","yyyy-MM-dd HH:mm:ss.SSS"]
target=>"timestamp"
}
ruby {
code => "event.set('@timestamp',event.get('timestamp'))"
}
mutate {
remove_field => ['itime_str','itime','timestamp']
}
}
}
output {
if "throttled" not in [tags] and "dingding" not in [tags] and [fields][level] == "error" and "propertyCustomer" in [tags] {
if [fields][app] == "rsp-ce" {
exec {
command => "/usr/local/elk/propertyCustomer/bin/alarm-ce.sh %{[fields][app]} %{[fields][env]} %{[fields][host]}"
}
} else if [fields][app] == "customer" or [fields][app] == "property" or [fields][app] == "estate" {
exec {
command => "/usr/local/elk/propertyCustomer/bin/alarm-estate.sh %{[fields][app]} %{[fields][env]} %{[fields][host]}"
}
} else if "案源状态" not in [message] {
exec {
command => "/usr/local/elk/propertyCustomer/bin/alarm.sh %{[fields][app]} %{[fields][env]} %{[fields][host]}"
}
}
}
if "propertyCustomer" in [tags] {
elasticsearch {
hosts => ["10.10.202.247:9200"]
index => "%{[fields][app]}-%{[fields][env]}-%{+yyyy.MM.dd}"
user => "elastic"
password => "tw.1234"
}
}
elasticsearch {
hosts => ["10.10.201.76:9200","10.10.201.77:9200","10.10.201.78:9200"]
index => "%{[fields][app]}-%{[fields][env]}-%{+yyyy.MM.dd}"
user => "elastic"
password => "43tYibP5ldN88ND2Vxci"
}
}
说明:
这边需要注意:output下需要执行执行shell脚本,:
|
1
2
3
|
exec { command => "/usr/local/elk/propertyCustomer/bin/alarm-ce.sh %{[fields][app]} %{[fields][env]} %{[fields][host]}" } |
则需要安装一个插件:logstash-output-exec-3.1.4.gem,安装步骤如下:
|
1
2
|
zip -r logstash-output-exec.zip logstash-output-exec-3.1.4.gemlogstash-plugin install file:///tmp/logstash-output-exec.zip |
logstash-output-exec-3.1.4.gem下载地址如下:链接:https://pan.baidu.com/s/14k0eIt2XZCtEpX6f1nNIiw 提取码:79ek
但是logstash要收取合格的日志,那么log4j.xml格式也要统一,如下:
<?xml version="1.0" encoding="UTF-8"?>
<!-- Configuration后面的status,这个用于设置log4j2自身内部的信息输出,可以不设置,当设置成trace时,
 你会看到log4j2内部各种详细输出。可以设置成OFF(关闭)或Error(只输出错误信息)
-->
<!--日志级别以及优先级排序: OFF > FATAL > ERROR > WARN > INFO > DEBUG > TRACE > ALL -->
<!--Configuration后面的status,这个用于设置log4j2自身内部的信息输出,可以不设置,当设置成trace时,你会看到log4j2内部各种详细输出-->
<!--monitorInterval:Log4j能够自动检测修改配置 文件和重新配置本身,设置间隔秒数-->
<Configuration status="WARN" monitorInterval="1800">
    <!-- 日志文件目录和压缩文件目录配置 -->
    <Properties>
        <!--app name-->
        <Property name="app">poolname</Property>
        <!-- ==============================================公共配置============================================== -->
        <!-- 设置日志文件的目录名称 -->
        <Property name="fileName">/poolname</Property>

        <!-- 日志默认存放的位置,可以设置为项目根路径下,也可指定绝对路径 -->
        <!-- 存放路径一:通用路径 -->
        <property name="basePath">/mnt/logs/${fileName}</property>
        <!-- 存放路径二:web工程专用,java项目没有这个变量,需要删掉,否则会报异常,这里把日志放在web项目的根目录下 -->
        <!-- <property name="basePath">${web:rootDir}/${fileName}</property> -->
        <!-- 存放路径三:web工程专用,java项目没有这个变量,需要删掉,否则会报异常,这里把日志放在tocmat的logs目录下 -->
        <!--<property name="basePath">${sys:catalina.home}/logs/${fileName}</property>-->

        <!-- 控制台默认输出格式,"%-5level":日志级别,"%l":输出完整的错误位置,是小写的L,因为有行号显示,所以影响日志输出的性能 -->
        <!--<property name="console_log_pattern">%d{yyyy-MM-dd HH:mm:ss.SSS} [%-5level] %l - %m%n</property>-->
        <property name="console_log_pattern">[%style{%d{yyyy-MM-dd HH:mm:ss.SSS}}{bright,blue}] [%style{%t}{bright,cyan}] [%highlight{%-5level}{STYLE=Logback}][%style{%logger{36}}{yellow}] - %msg%n%style{%throwable}{red}</property>
        <!-- 日志文件默认输出格式,不带行号输出(行号显示会影响日志输出性能);%C:大写,类名;%M:方法名;%m:错误信息;%n:换行 -->
        <!-- <property name="log_pattern">%d{yyyy-MM-dd HH:mm:ss.SSS} [%-5level] %C.%M - %m%n</property> -->
        <!-- 日志文件默认输出格式,另类带行号输出(对日志输出性能未知);%C:大写,类名;%M:方法名;%L:行号;%m:错误信息;%n:换行 -->
        <property name="log_pattern">[%d{yyyy-MM-dd HH:mm:ss.SSS}] [%level] [%C(%M)] [%L line] - %m%n</property>
        <!--        <property name="log_pattern">{"timestamp":"%d{yyyy-MM-dd HH:mm:ss.SSS}","logger":"%logger","level":"%level","className":"%C","method":"%M","line":"%L","server":"${sys:hostName}","message":"%enc{%msg}{JSON}","app":"${app}","ex":"%enc{%xEx}{JSON}"}%n</property>-->

        <!-- 日志默认切割的最小单位 -->
        <property name="every_file_size">20MB</property>
        <!-- 日志默认输出级别 -->
        <property name="output_log_level">DEBUG</property>

        <!-- ============================================Info级别日志============================================ -->
        <!-- Info日志默认存放路径(Info级别日志) -->
        <property name="info_fileName">${basePath}/info.log</property>
        <!-- Info日志默认压缩路径,将超过指定文件大小的日志,自动存入按"年月"建立的文件夹下面并进行压缩,作为存档 -->
        <property name="info_filePattern">${basePath}/gz/%d{yyyy-MM}/info-%d{yyyy-MM-dd}-%i.log.gz</property>
        <!-- Info日志默认同一文件夹下可以存放的数量,不设置此属性则默认为7个 -->
        <property name="info_max">100</property>
        <!-- 日志默认同类型日志,多久生成一个新的日志文件,这个配置需要和filePattern结合使用;
                如果设置为1,filePattern是%d{yyyy-MM-dd}到天的格式,则间隔一天生成一个文件
                如果设置为12,filePattern是%d{yyyy-MM-dd-HH}到小时的格式,则间隔12小时生成一个文件 -->
        <property name="info_timeInterval">1</property>
        <!-- 日志默认同类型日志,是否对封存时间进行调制,若为true,则封存时间将以0点为边界进行调整,
                如:现在是早上3am,interval是4,那么第一次滚动是在4am,接着是8am,12am...而不是7am -->
        <property name="info_timeModulate">true</property>

        <!-- ============================================Warn级别日志============================================ -->
        <!-- Warn日志默认存放路径(Warn级别日志) -->
        <property name="warn_fileName">${basePath}/warn.log</property>
        <!-- Warn日志默认压缩路径,将超过指定文件大小的日志,自动存入按"年月"建立的文件夹下面并进行压缩,作为存档 -->
        <property name="warn_filePattern">${basePath}/gz/%d{yyyy-MM}/warn-%d{yyyy-MM-dd}-%i.log.gz</property>
        <!-- Warn日志默认同一文件夹下可以存放的数量,不设置此属性则默认为7个 -->
        <property name="warn_max">100</property>
        <!-- 日志默认同类型日志,多久生成一个新的日志文件,这个配置需要和filePattern结合使用;
                如果设置为1,filePattern是%d{yyyy-MM-dd}到天的格式,则间隔一天生成一个文件
                如果设置为12,filePattern是%d{yyyy-MM-dd-HH}到小时的格式,则间隔12小时生成一个文件 -->
        <property name="warn_timeInterval">1</property>
        <!-- 日志默认同类型日志,是否对封存时间进行调制,若为true,则封存时间将以0点为边界进行调整,
                如:现在是早上3am,interval是4,那么第一次滚动是在4am,接着是8am,12am...而不是7am -->
        <property name="warn_timeModulate">true</property>

        <!-- ============================================Error级别日志============================================ -->
        <!-- Error日志默认存放路径(Error级别日志) -->
        <property name="error_fileName">${basePath}/error.log</property>
        <!-- Error日志默认压缩路径,将超过指定文件大小的日志,自动存入按"年月"建立的文件夹下面并进行压缩,作为存档 -->
        <property name="error_filePattern">${basePath}/gz/%d{yyyy-MM}/error-%d{yyyy-MM-dd}-%i.log.gz</property>
        <!-- Error日志默认同一文件夹下可以存放的数量,不设置此属性则默认为7个 -->
        <property name="error_max">100</property>
        <!-- 日志默认同类型日志,多久生成一个新的日志文件,这个配置需要和filePattern结合使用;
                如果设置为1,filePattern是%d{yyyy-MM-dd}到天的格式,则间隔一天生成一个文件
                如果设置为12,filePattern是%d{yyyy-MM-dd-HH}到小时的格式,则间隔12小时生成一个文件 -->
        <property name="error_timeInterval">1</property>
        <!-- 日志默认同类型日志,是否对封存时间进行调制,若为true,则封存时间将以0点为边界进行调整,
                如:现在是早上3am,interval是4,那么第一次滚动是在4am,接着是8am,12am...而不是7am -->
        <property name="error_timeModulate">true</property>

        <!-- ============================================控制台显示控制============================================ -->
        <!-- 控制台显示的日志最低级别 -->
        <property name="console_print_level">INFO</property>
    </Properties>

    <!--定义appender -->
    <Appenders>
        <!-- =======================================用来定义输出到控制台的配置======================================= -->
        <Console name="Console" target="SYSTEM_OUT">
            <!-- 设置控制台只输出level及以上级别的信息(onMatch),其他的直接拒绝(onMismatch)-->
            <ThresholdFilter level="${console_print_level}" onMatch="ACCEPT" onMismatch="DENY"/>
            <!-- 设置输出格式,不设置默认为:%m%n -->
            <PatternLayout pattern="${console_log_pattern}" disableAnsi="false"/>
        </Console>

        <!-- =======================================打印INFO级别的日志到文件======================================= -->
        <RollingFile name="InfoFile" fileName="${info_fileName}" filePattern="${info_filePattern}">
            <PatternLayout pattern="${log_pattern}"/>
            <Policies>
                <TimeBasedTriggeringPolicy interval="${info_timeInterval}" modulate="${info_timeModulate}"/>
                <SizeBasedTriggeringPolicy size="${every_file_size}"/>
            </Policies>
            <DefaultRolloverStrategy max="${info_max}" />
            <Filters>
                <ThresholdFilter level="WARN" onMatch="DENY" onMismatch="NEUTRAL"/>
                <ThresholdFilter level="INFO" onMatch="ACCEPT" onMismatch="DENY"/>
            </Filters>
        </RollingFile>

        <!-- =======================================打印WARN级别的日志到文件======================================= -->
        <RollingFile name="WarnFile" fileName="${warn_fileName}" filePattern="${warn_filePattern}" >
            <PatternLayout pattern="${log_pattern}"/>
            <Policies>
                <TimeBasedTriggeringPolicy interval="${warn_timeInterval}" modulate="${warn_timeModulate}"/>
                <SizeBasedTriggeringPolicy size="${every_file_size}"/>
            </Policies>
            <DefaultRolloverStrategy max="${warn_max}" />
            <Filters>
                <ThresholdFilter level="ERROR" onMatch="DENY" onMismatch="NEUTRAL"/>
                <ThresholdFilter level="WARN" onMatch="ACCEPT" onMismatch="DENY"/>
            </Filters>
        </RollingFile>

        <!-- =======================================打印ERROR级别的日志到文件======================================= -->
        <RollingFile name="ErrorFile" fileName="${error_fileName}" filePattern="${error_filePattern}" ignoreExceptions="true">
            <PatternLayout pattern="${log_pattern}"/>
            <Policies>
                <TimeBasedTriggeringPolicy interval="${error_timeInterval}" modulate="${error_timeModulate}"/>
                <SizeBasedTriggeringPolicy size="${every_file_size}"/>
            </Policies>
            <DefaultRolloverStrategy max="${error_max}" />
            <Filters>
                <ThresholdFilter level="FATAL" onMatch="DENY" onMismatch="NEUTRAL"/>
                <ThresholdFilter level="ERROR" onMatch="ACCEPT" onMismatch="DENY"/>
            </Filters>
        </RollingFile>

    </Appenders>

    <!-- 全局配置,默认所有的Logger都继承此配置 -->
    <Loggers>
        <!--建立一个默认的root的logger-->
        <root level="${output_log_level}">
            <appender-ref ref="Console"/>
            <appender-ref ref="InfoFile"/>
            <appender-ref ref="WarnFile"/>
            <appender-ref ref="ErrorFile"/>
        </root>
    </Loggers>
</Configuration>
然后java代码也需要加上:
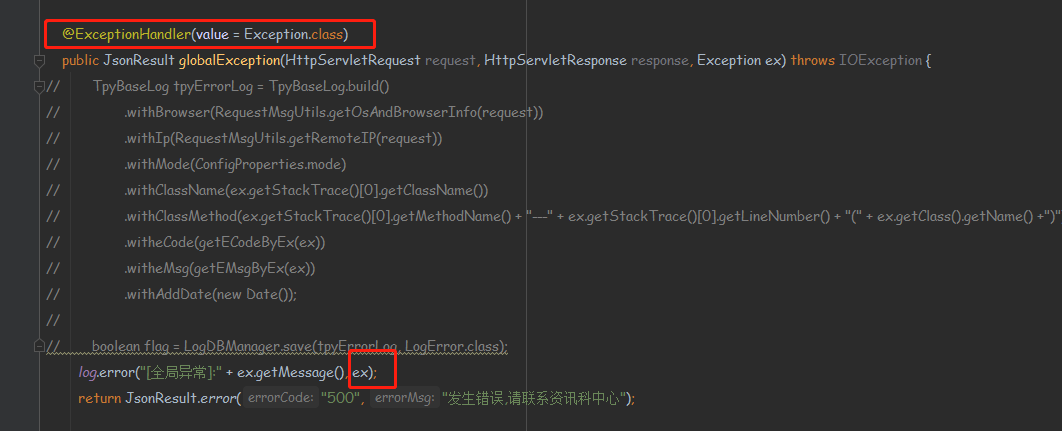
六、安装filebeat
在需要采集日志的地方安装filebeat
1、安装filebeat
|
1
|
[root@shtw-k2workflow01 ~]# rpm -ivh filebeat-7.5.1-x86_64.rpm |
2、配置filebeat
|
1
2
3
|
[root@shtw-k2workflow01 ~]# cd /etc/filebeat[root@shtw-k2workflow01 filebeat]# cp filebeat.yml filebeat.yml-bak[root@shtw-k2workflow01 filebeat]# vim filebeat.yml |
配置如下:
###################### Filebeat Configuration Example #########################

# This file is an example configuration file highlighting only the most common
# options. The filebeat.reference.yml file from the same directory contains all the
# supported options with more comments. You can use it as a reference.
#
# You can find the full configuration reference here:
# https://www.elastic.co/guide/en/beats/filebeat/index.html

# For more available modules and options, please see the filebeat.reference.yml sample
# configuration file.

#=========================== Filebeat inputs =============================

filebeat.inputs:

# Each - is an input. Most options can be set at the input level, so
# you can use different inputs for various configurations.
# Below are the input specific configurations.

- type: log
  enabled: true
  paths:
    - /mnt/logs/estate/info.log
  fields:
    level: info
    app: estate
    host: 10.10.202.116
    env: prod
  multiline.pattern: ^\[[0-9]{4}[-][0-9]{1,2}[-][0-9]{1,2}[ ][0-9]{1,2}[:][0-9]{1,2}[:][0-9]{1,2}[.][0-9]{1,3}\]
  multiline.negate: true
  multiline.match: after
- type: log
  enabled: true
  paths:
    - /mnt/logs/estate/warn.log
  fields:
    level: warn
    app: estate
    host: 10.10.202.116
    env: prod
  multiline.pattern: ^\[[0-9]{4}[-][0-9]{1,2}[-][0-9]{1,2}[ ][0-9]{1,2}[:][0-9]{1,2}[:][0-9]{1,2}[.][0-9]{1,3}\]
  multiline.negate: true
  multiline.match: after
- type: log
  enabled: true
  paths:
    - /mnt/logs/estate/error.log
  fields:
    level: error
    app: estate
    host: 10.10.202.116
    env: prod
  multiline.pattern: ^\[[0-9]{4}[-][0-9]{1,2}[-][0-9]{1,2}[ ][0-9]{1,2}[:][0-9]{1,2}[:][0-9]{1,2}[.][0-9]{1,3}\]
  multiline.negate: true
  multiline.match: after


#============================= Filebeat modules ===============================

filebeat.config.modules:
  # Glob pattern for configuration loading
  path: ${path.config}/modules.d/*.yml

  # Set to true to enable config reloading
  reload.enabled: false

  # Period on which files under path should be checked for changes
  #reload.period: 10s

#==================== Elasticsearch template setting ==========================

setup.template.settings:
  index.number_of_shards: 1
  #index.codec: best_compression
  #_source.enabled: false

#================================ General =====================================

# The name of the shipper that publishes the network data. It can be used to group
# all the transactions sent by a single shipper in the web interface.
#name:

# The tags of the shipper are included in their own field with each
# transaction published.
#tags: ["service-X", "web-tier"]

# Optional fields that you can specify to add additional information to the
# output.
#fields:
#  env: staging


#============================== Dashboards =====================================
# These settings control loading the sample dashboards to the Kibana index. Loading
# the dashboards is disabled by default and can be enabled either by setting the
# options here or by using the `setup` command.
#setup.dashboards.enabled: false

# The URL from where to download the dashboards archive. By default this URL
# has a value which is computed based on the Beat name and version. For released
# versions, this URL points to the dashboard archive on the artifacts.elastic.co
# website.
#setup.dashboards.url:

#============================== Kibana =====================================

# Starting with Beats version 6.0.0, the dashboards are loaded via the Kibana API.
# This requires a Kibana endpoint configuration.
#setup.kibana:

  # Kibana Host
  # Scheme and port can be left out and will be set to the default (http and 5601)
  # In case you specify and additional path, the scheme is required: http://localhost:5601/path
  # IPv6 addresses should always be defined as: https://[2001:db8::1]:5601
  #host: "localhost:5601"

  # Kibana Space ID
  # ID of the Kibana Space into which the dashboards should be loaded. By default,
  # the Default Space will be used.
  #space.id:

#============================= Elastic Cloud ==================================

# These settings simplify using Filebeat with the Elastic Cloud (https://cloud.elastic.co/).

# The cloud.id setting overwrites the `output.elasticsearch.hosts` and
# `setup.kibana.host` options.
# You can find the `cloud.id` in the Elastic Cloud web UI.
#cloud.id:

# The cloud.auth setting overwrites the `output.elasticsearch.username` and
# `output.elasticsearch.password` settings. The format is `<user>:<pass>`.
#cloud.auth:

#================================ Outputs =====================================

# Configure what output to use when sending the data collected by the beat.

#-------------------------- Elasticsearch output ------------------------------
#output.elasticsearch:
  # Array of hosts to connect to.
  #hosts: ["localhost:9200"]

  # Optional protocol and basic auth credentials.
  #protocol: "https"
  #username: "elastic"
  #password: "changeme"

#----------------------------- Logstash output --------------------------------
#output.logstash:
  # The Logstash hosts
  #hosts: ["localhost:5044"]

  # Optional SSL. By default is off.
  # List of root certificates for HTTPS server verifications
  #ssl.certificate_authorities: ["/etc/pki/root/ca.pem"]

  # Certificate for SSL client authentication
  #ssl.certificate: "/etc/pki/client/cert.pem"

  # Client Certificate Key
  #ssl.key: "/etc/pki/client/cert.key"
#------------------------------- Redis output ---------------------------------
#output.redis config
output.redis:
  hosts: ["192.168.202.247:6379"]
  key: propertyCustomer
  datatype: list
  loadbalance: true

#================================ Processors =====================================

# Configure processors to enhance or manipulate events generated by the beat.

processors:
  - add_host_metadata: ~
  - add_cloud_metadata: ~
  - add_docker_metadata: ~
  - add_kubernetes_metadata: ~

#================================ Logging =====================================

# Sets log level. The default log level is info.
# Available log levels are: error, warning, info, debug
#logging.level: debug

# At debug level, you can selectively enable logging only for some components.
# To enable all selectors use ["*"]. Examples of other selectors are "beat",
# "publish", "service".
#logging.selectors: ["*"]

#============================== X-Pack Monitoring ===============================
# filebeat can export internal metrics to a central Elasticsearch monitoring
# cluster.  This requires xpack monitoring to be enabled in Elasticsearch.  The
# reporting is disabled by default.

# Set to true to enable the monitoring reporter.
#monitoring.enabled: false

# Sets the UUID of the Elasticsearch cluster under which monitoring data for this
# Filebeat instance will appear in the Stack Monitoring UI. If output.elasticsearch
# is enabled, the UUID is derived from the Elasticsearch cluster referenced by output.elasticsearch.
#monitoring.cluster_uuid:

# Uncomment to send the metrics to Elasticsearch. Most settings from the
# Elasticsearch output are accepted here as well.
# Note that the settings should point to your Elasticsearch *monitoring* cluster.
# Any setting that is not set is automatically inherited from the Elasticsearch
# output configuration, so if you have the Elasticsearch output configured such
# that it is pointing to your Elasticsearch monitoring cluster, you can simply
# uncomment the following line.
#monitoring.elasticsearch:

#================================= Migration ==================================

# This allows to enable 6.7 migration aliases
#migration.6_to_7.enabled: true
3、启动filebeat
|
1
|
[root@shtw-k2workflow01 filebeat]# systemctl start filebeat |
等5s中去kibana中去查看索引,如图:
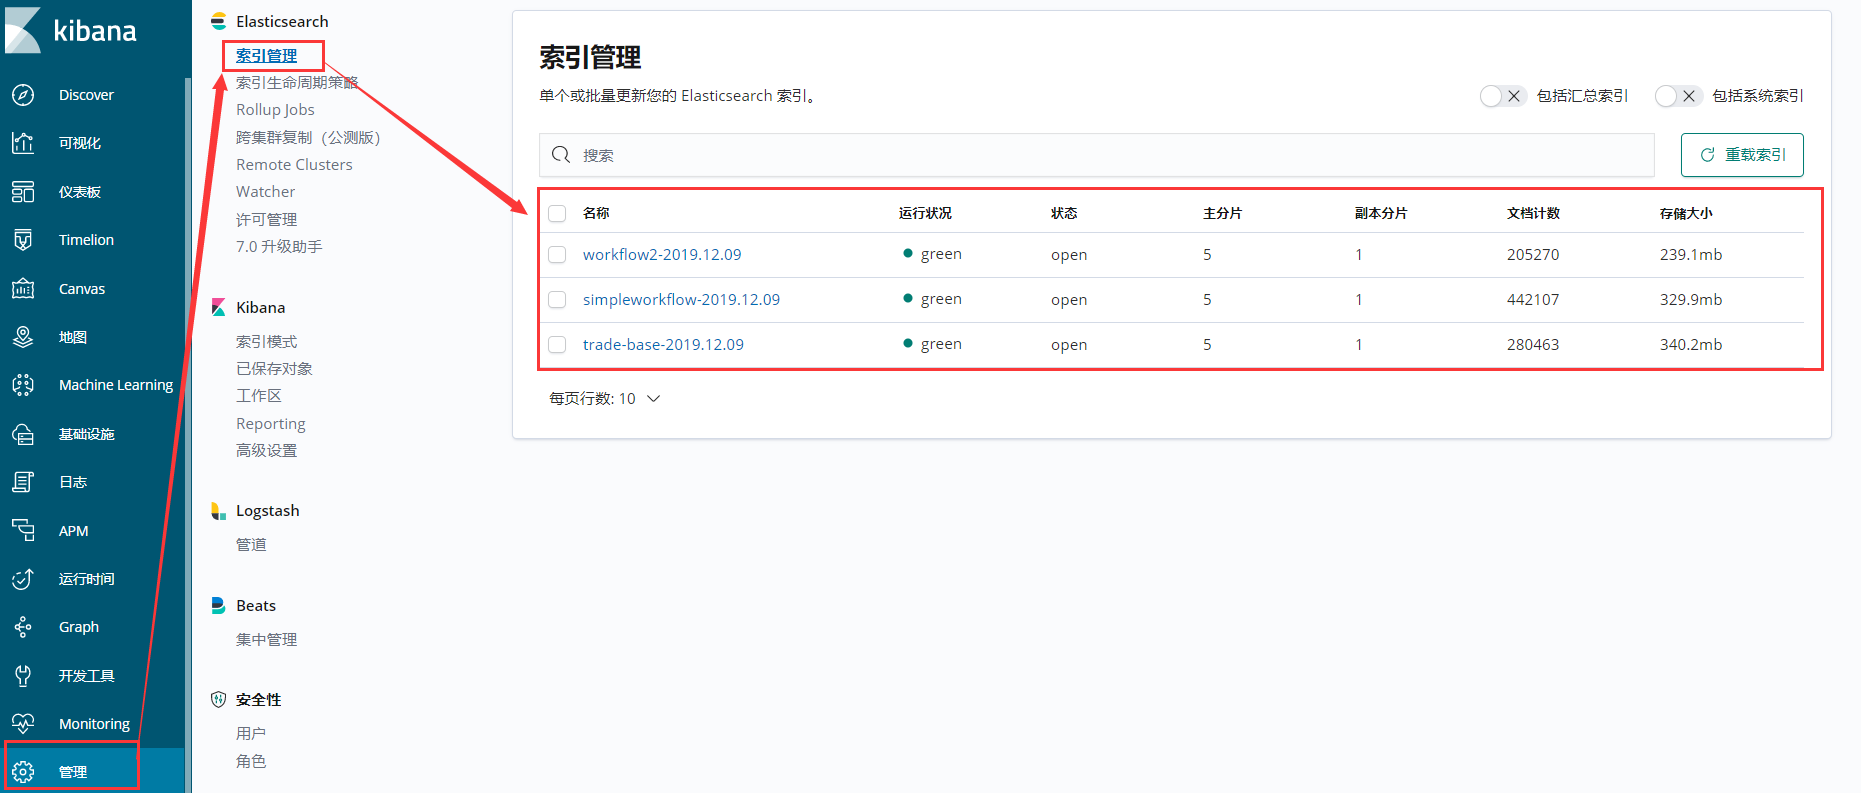
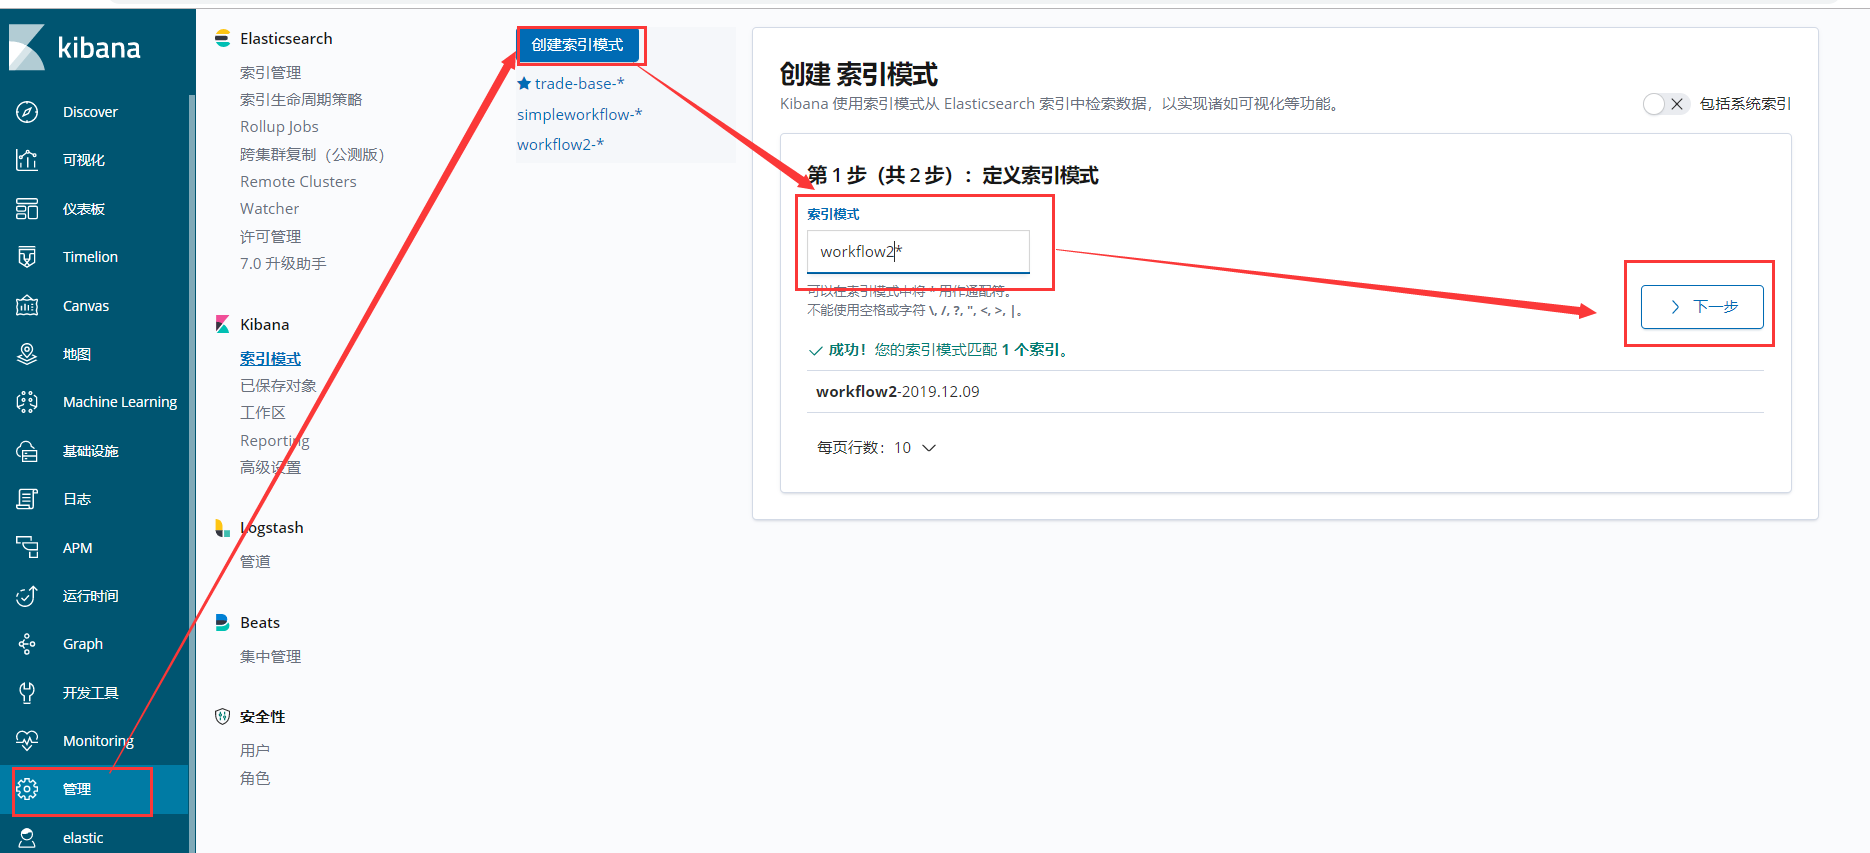
4、创建索引
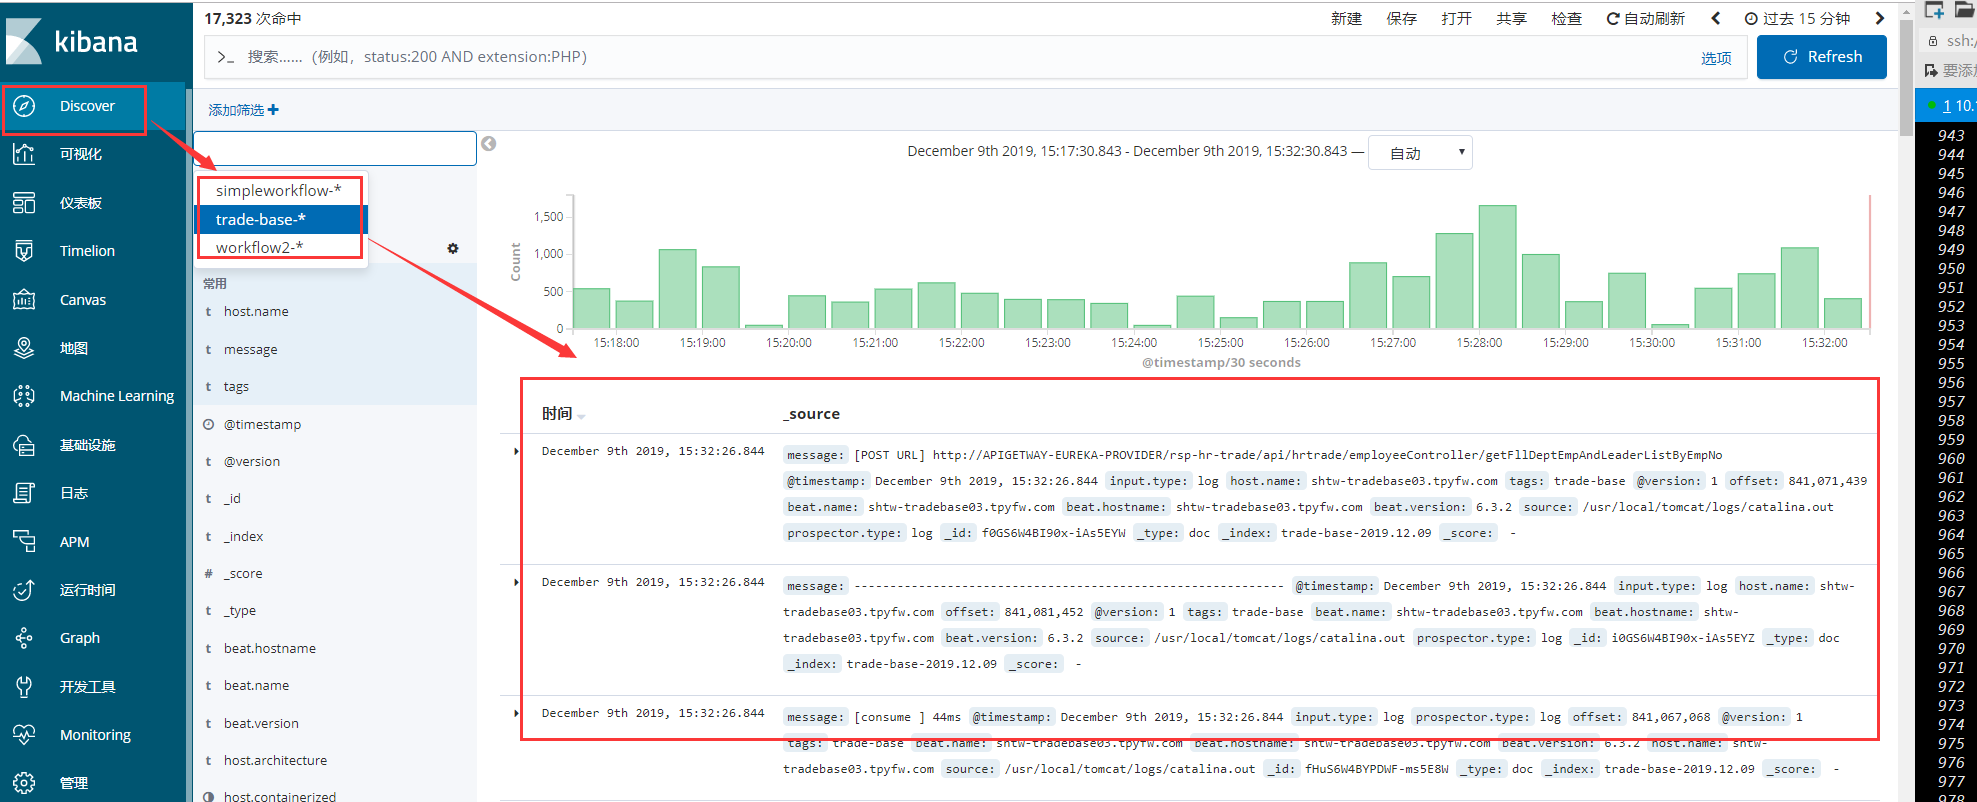
5、采集日志
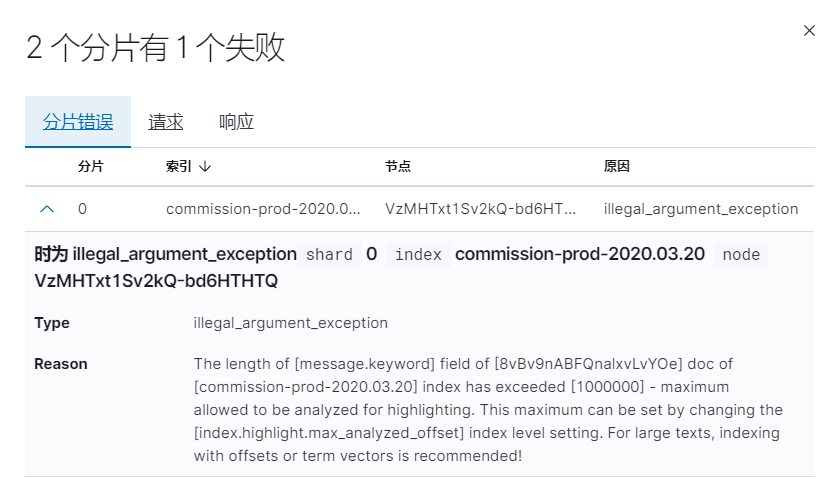
如果在查看日志的时候,会报分片索引偏移量超出问题,这个时候执行如下:
|
1
|
[root@172.168.201.76 ~]# curl -u elastic -p -XPUT "http://172.168.201.76:9200/_settings" -H 'Content-Type:application/json' -d' { "index" : {"highlight.max_analyzed_offset" : 100000000} }' |
七、权限控制
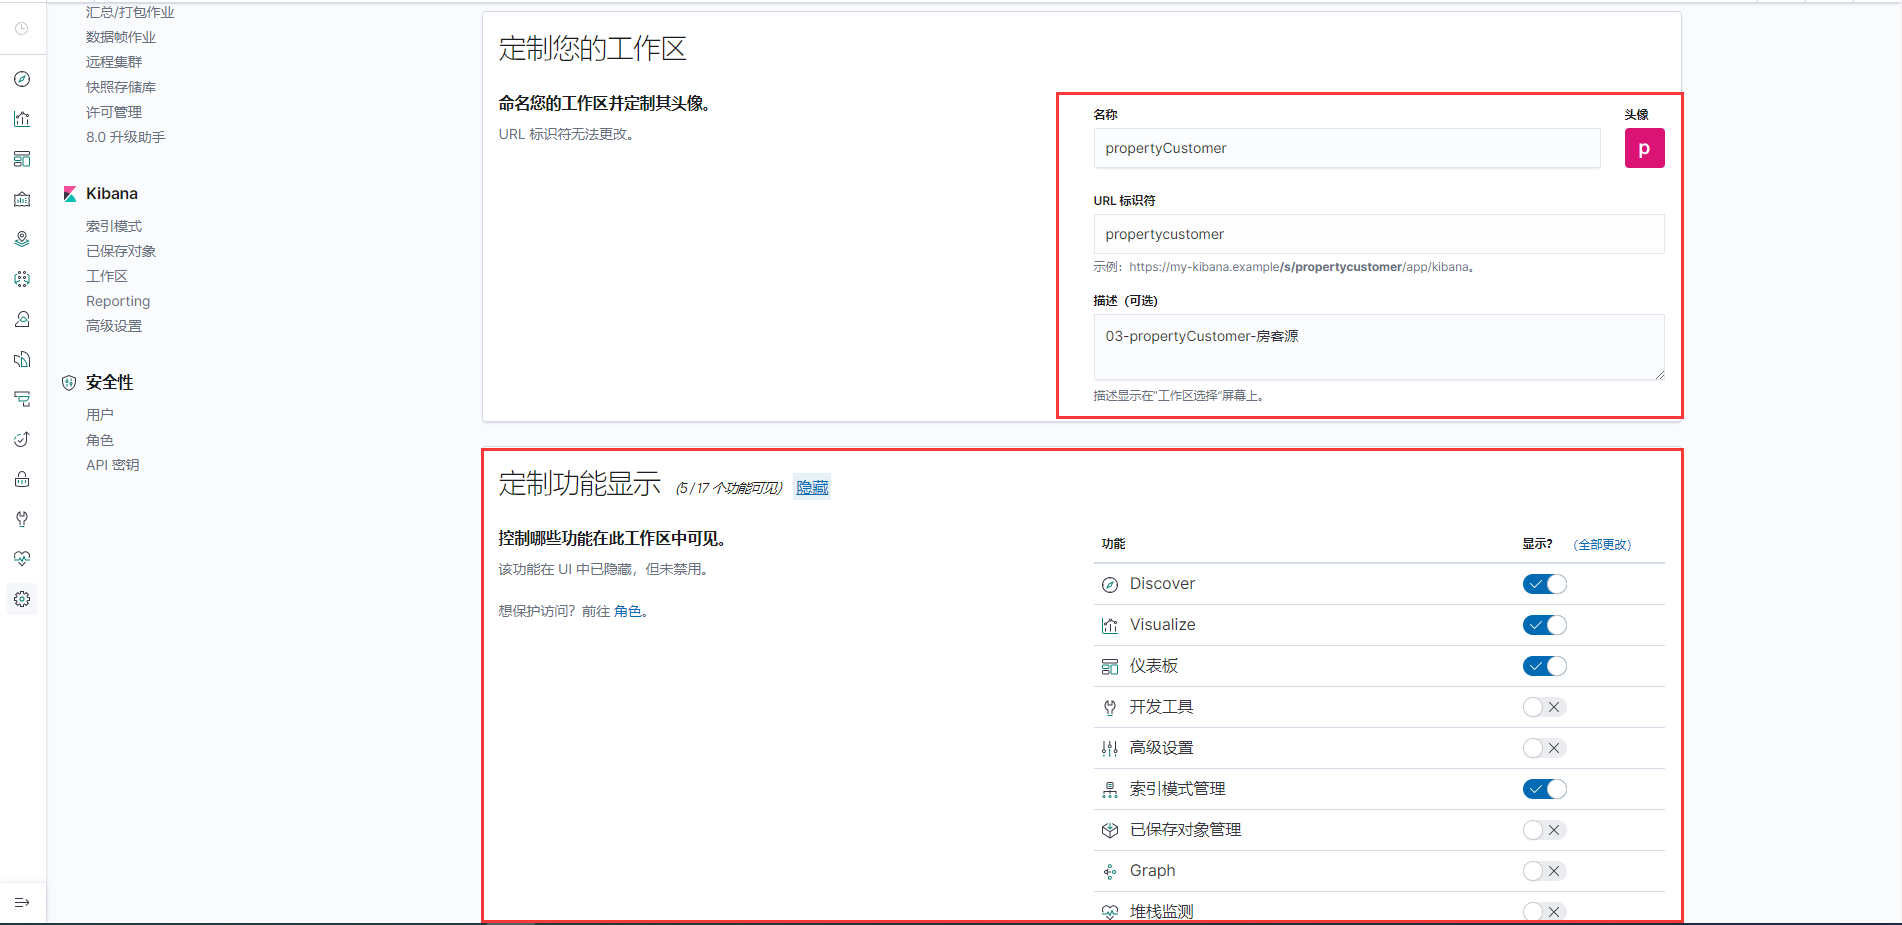
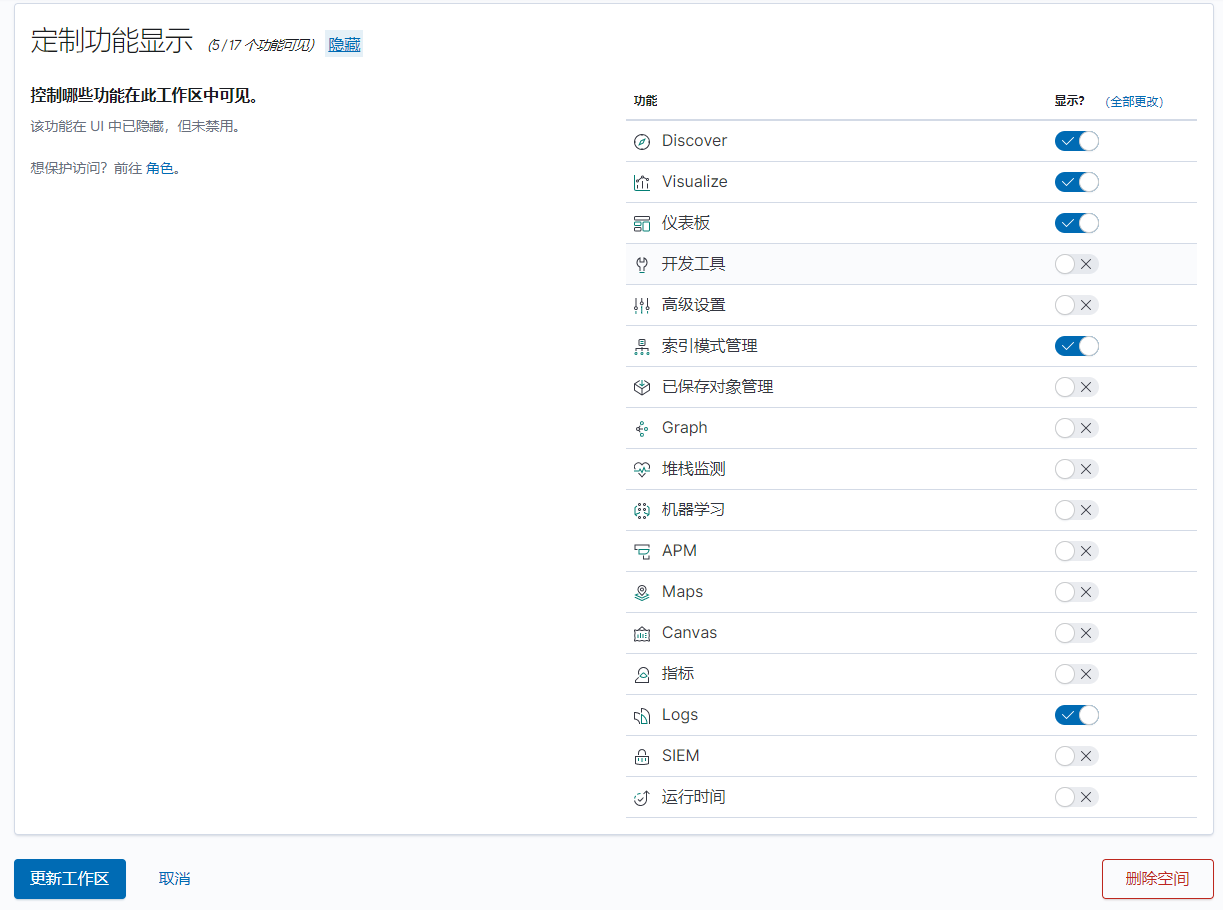
7.1、创建一个空间
mangement-> Kibana -> 工作区 -> 创建一个空间

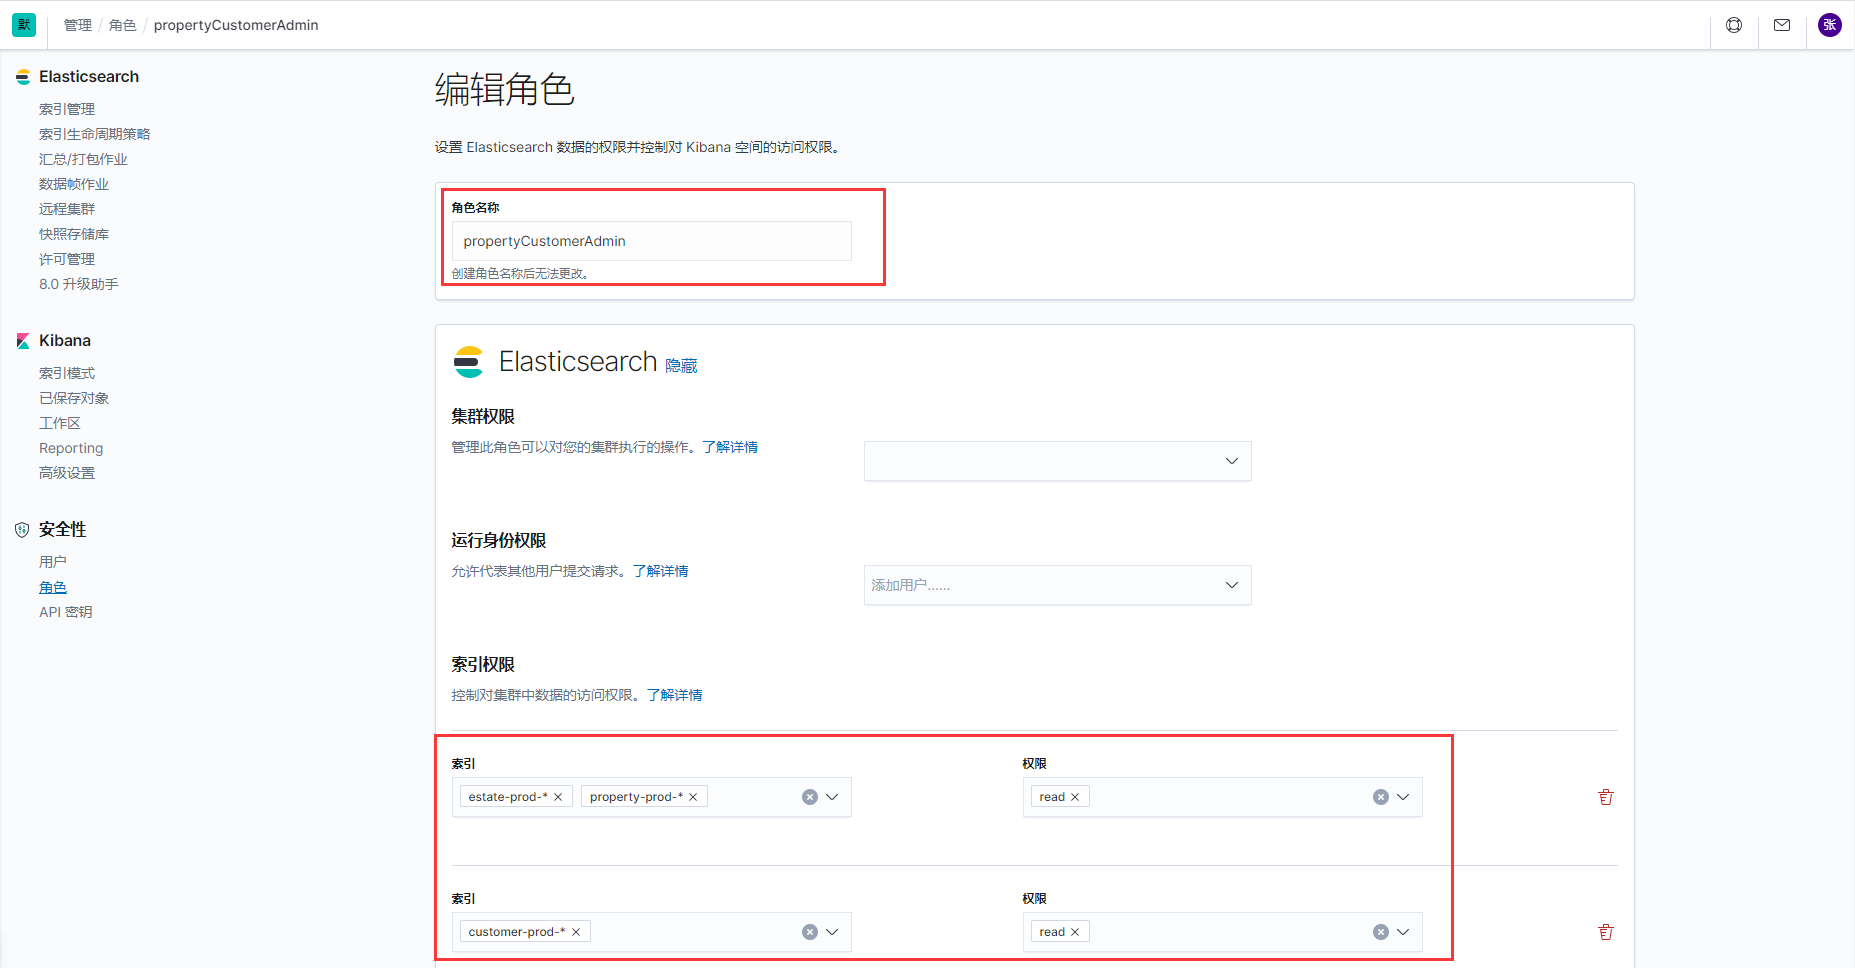
7.2、创建角色


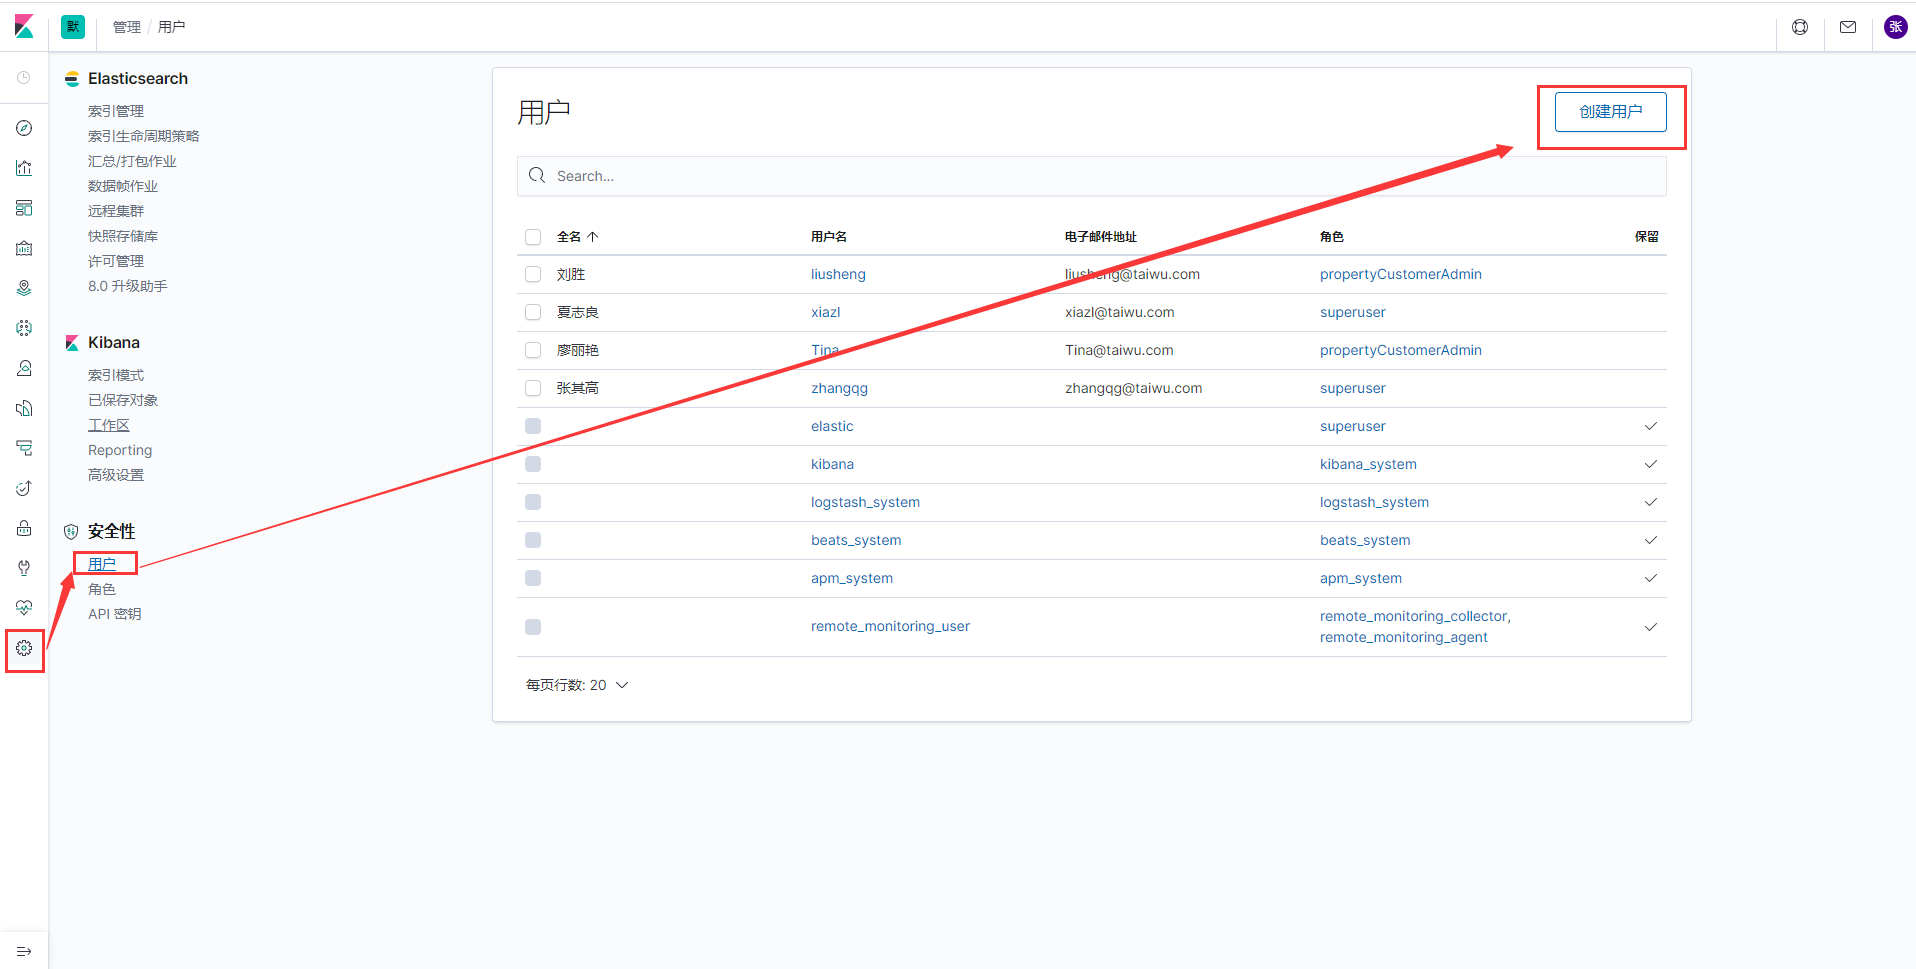
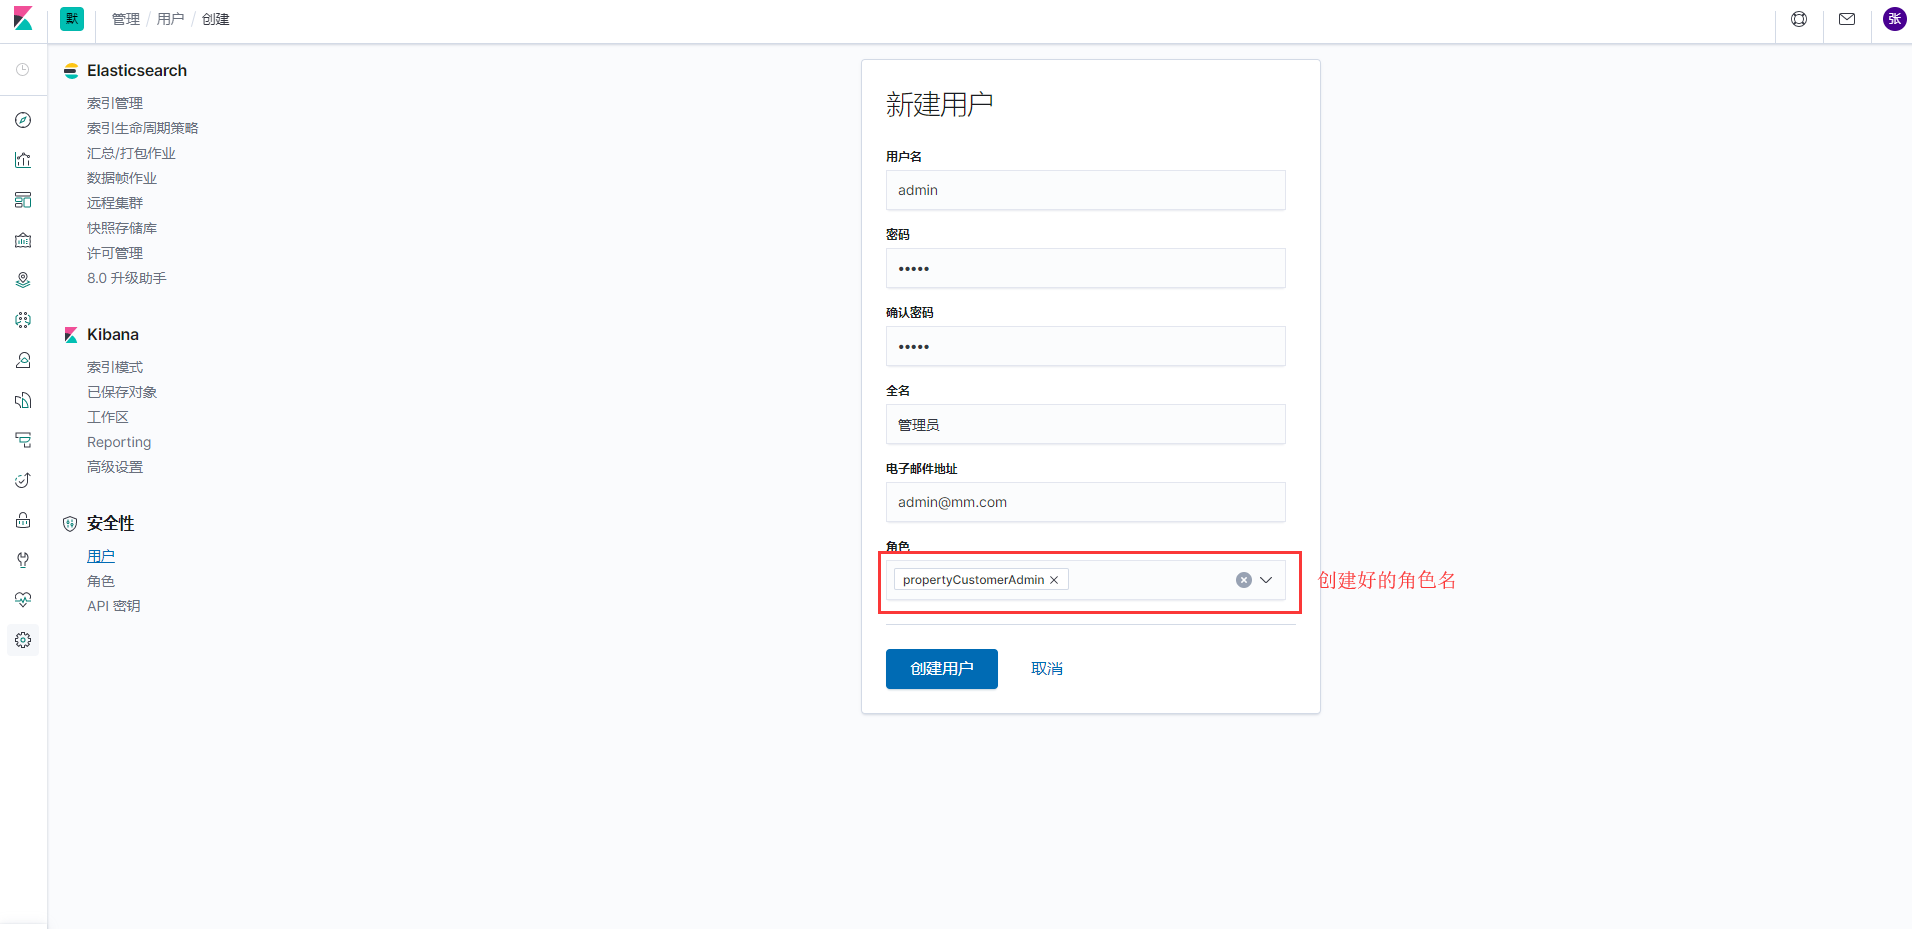
7.3、创建用户
搭建完毕,elk的路还是很长的,才走完万里长征第一步。
转载自 :https://www.cnblogs.com/zhangqigao/p/11913116.html

 浙公网安备 33010602011771号