GVEdit中使用graphviz
官方文档
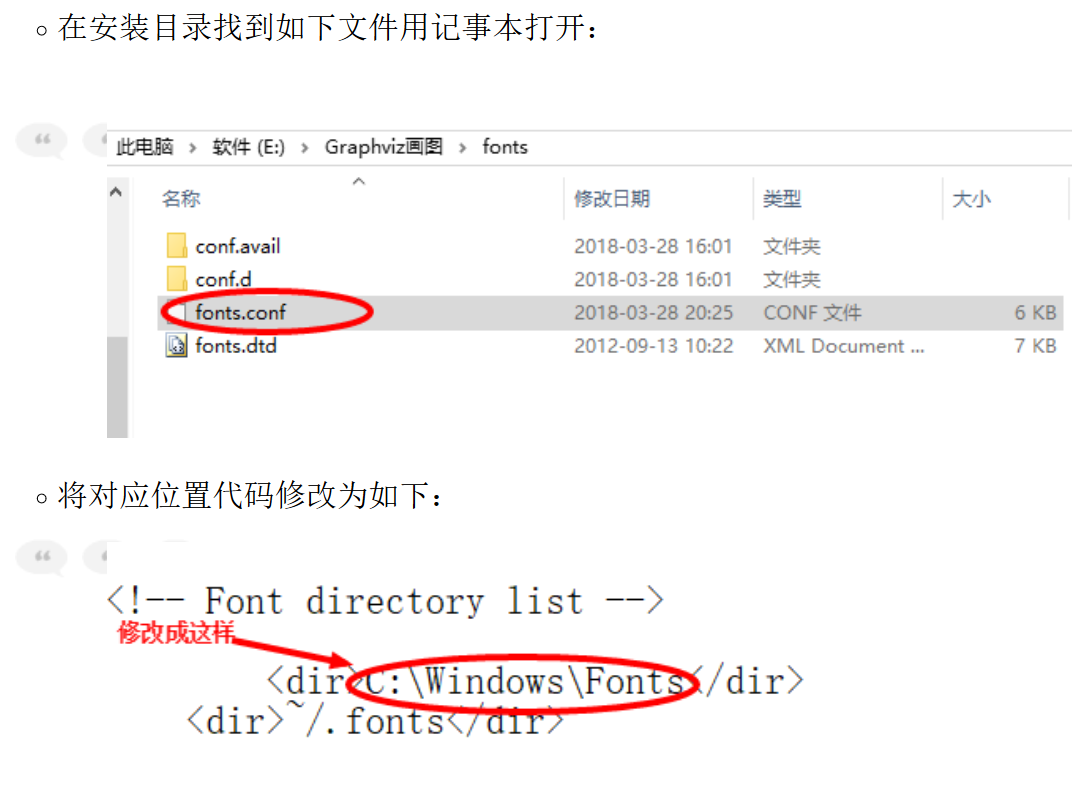
安装完graphviz后,文档在安装目录下,位置如下
E:\Gra2.38\share\graphviz\doc\html
中文乱码解决
将文件保存为utf-8编码
fontname="宋体";

dot语言语法
https://blog.csdn.net/jy692405180/article/details/52077979
https://blog.csdn.net/sd10086/article/details/52979462/
demo
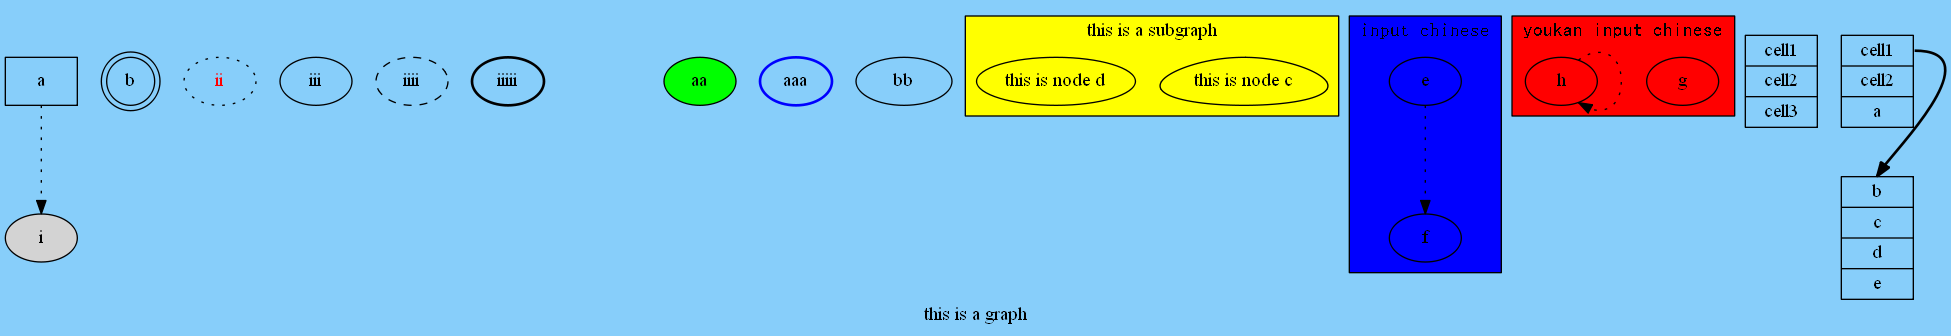
有向图
digraph graph1{            //digraph->  graph--
    label="this is a graph";
    a[shape="box"];
    b[shape="doublecircle"];
    i[style="filled"];
    ii[style="dotted",fontcolor="red"];
    iii[style="solid"];
    iiii[style="dashed"];
    iiiii[style="bold"];
    iiiiii[style="invis"];
    aa[style="filled",fillcolor="green"];//The premise of using "fillcolor" is that "style" is "filled"
    aaa[style="bold",color="blue"];
    bb[width=1,hight=20];

    edge [style="dotted"];        //node[] and edge[] are works for everything after that
    a->i;


    graph[bgcolor="lightskyblue"];
    rankdir="TB";            //LR RL TB BT
    //rotate=90;

    subgraph  cluster_sgh{            //subgraph顧﹍uster
    label="this is a subgraph";
    bgcolor=yellow;
    rankdir="LR";

    c[shape="egg",label="this is node c"];
    d[label="this is node d"];
    }

    subgraph  cluster_sgh2{
    fontname="FangSong";                //鐎涙ぞ缍
    label="input chinese";
    bgcolor=blue;
    e;f;
    e->f;
    }

    subgraph  cluster_sgh3{
    fontname="SimHei";                //姒涙垳缍
    label="youkan input chinese";
    bgcolor=red;
    g;h;
    h->h;
    }

/*
table1 [label=<
<table>
    <tr>
        <td port="one">1</td>
        <td>2</td>
    </tr>
    <tr>
        <td>3</td>
        <td>4</td>
    </tr>
</table>
>];

*/

example [ shape = record, label = "{<head>cell1 | cell2 | cell3}" ];

node [shape=record];
edge [style="bold"];
table1 [label="{<head>cell1|cell2|a}"];
table2 [label="{<head>b|c|d|e}"];
table1:head->table2:head;

}
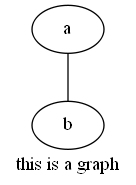
无向图
graph graph1{
    label="this is a graph";
    a;b;
    a--b;
}
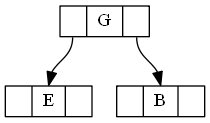
二叉树
digraph g {
    node [shape="record", height=.1];
    node0[label="<f0> |<f1> G|<f2>"];
    node1[label="<f0> |<f1> E|<f2>"];
    node2[label="<f0> |<f1> B|<f2>"];
    node0:f0 -> node1:f1;
    node0:f2 -> node2:f1;
}
二叉树2
digraph edge_settings {
    A -> B [color = "black", label = 0];
    B -> D [color = "black", label = 0];
    A -> C [color = "black", label = 1];
    B -> E [color = "black", label = 1];
    C -> F [color = "black", label = 0];
    C -> G [color = "black", label = 1];

    D -> H [color = "black", label = 0];
    D -> I [color = "black", label = 1];
    E -> J [color = "black", label = 0];
    E -> K [color = "black", label = 1];

    F -> L [color = "black", label = 0];
    F -> M [color = "black", label = 1];
    G -> N [color = "black", label = 0];
    G -> O [color = "black", label = 1];

}

横竖排
digraph g{
    node[shape="record"];
    a[label="{a|b|c}"];    //vertical column
    b[label="<f0>a|<f1>b|<f2>c"];    //horizontal

}

时序图
digraph g {
    rankdir="LR";
    {
        rank="same";
        a0 -> a1 -> a2;
    }
    {
        rank="same";
        b0 -> b1 -> b2;
    }
    a1 -> b1;
}


 浙公网安备 33010602011771号