
JavaScript手绘风格的图形库RoughJS使用指南
RoughJS是一个轻量级的JavaScript图形库(压缩后约9KB),可以让你在网页上绘制素描风格、手绘样式般的图形。RoughJS定义了绘制直线,曲线,圆弧,多边形,圆和椭圆的图元,同时它还支持绘制SVG路径。
这里是它的项目网站地址:https://roughjs.com/
RoughJS可以同时在Canvas和SVG上工作,这是一个非常实用的特性。

安装
最新的RoughJS库可以在Github中下载。
或者从npm下载:
npm install --save roughjs
使用
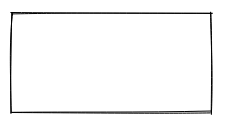
const rc = rough.canvas(document.getElementById('canvas'));
rc.rectangle(10, 10, 200, 200); // x, y, width, height
或者使用SVG
const rc = rough.svg(svg);
let node = rc.rectangle(10, 10, 200, 200); // x, y, width, height
svg.appendChild(node);
绘制线和椭圆
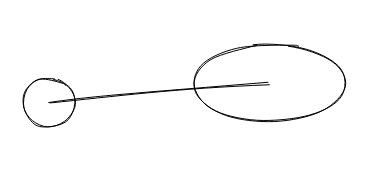
rc.circle(80, 120, 50); // centerX, centerY, diameter
rc.ellipse(300, 100, 150, 80); // centerX, centerY, width, height
rc.line(80, 120, 300, 100); // x1, y1, x2, y2
填充
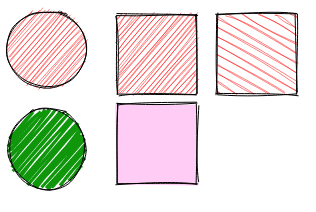
rc.circle(50, 50, 80, { fill: 'red' }); // fill with red hachure
rc.rectangle(120, 15, 80, 80, { fill: 'red' });
rc.circle(50, 150, 80, {
  fill: "rgb(10,150,10)",
  fillWeight: 3 // thicker lines for hachure
});
rc.rectangle(220, 15, 80, 80, {
  fill: 'red',
  hachureAngle: 60, // angle of hachure,
  hachureGap: 8
});
rc.rectangle(120, 105, 80, 80, {
  fill: 'rgba(255,0,200,0.2)',
  fillStyle: 'solid' // solid fill
});
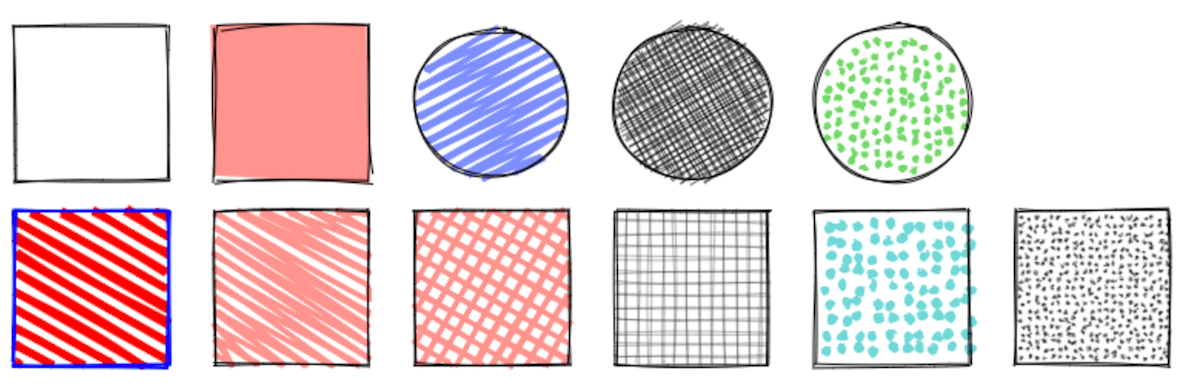
填充样式可以是:晕滃线(默认),实体,锯齿形,交叉影线或点。
素描风格
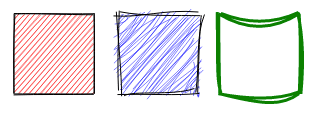
rc.rectangle(15, 15, 80, 80, { roughness: 0.5, fill: 'red' });
rc.rectangle(120, 15, 80, 80, { roughness: 2.8, fill: 'blue' });
rc.rectangle(220, 15, 80, 80, { bowing: 6, stroke: 'green', strokeWidth: 3 });
SVG路径
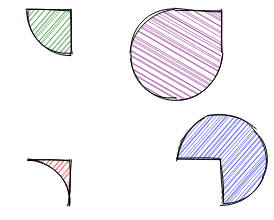
rc.path('M80 80 A 45 45, 0, 0, 0, 125 125 L 125 80 Z', { fill: 'green' });
rc.path('M230 80 A 45 45, 0, 1, 0, 275 125 L 275 80 Z', { fill: 'purple' });
rc.path('M80 230 A 45 45, 0, 0, 1, 125 275 L 125 230 Z', { fill: 'red' });
rc.path('M230 230 A 45 45, 0, 1, 1, 275 275 L 275 230 Z', { fill: 'blue' });
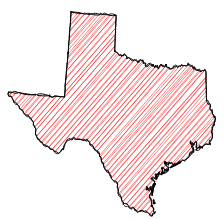
简化的SVG路径:
使用Web Workers
如果你的网页中导入了Workly(大小约1k),RoughJS自动将所有处理工作抛给Web Worker,同时释放UI主线程。有了Web Worker的支持,在使用RoughJs(如地图)创建复杂图形时,就非常有用了。你可以在这里阅读更多相关信息。
<script src="https://cdn.jsdelivr.net/gh/pshihn/workly/dist/workly.min.js"></script>
<script src="../../dist/rough.min.js"></script>
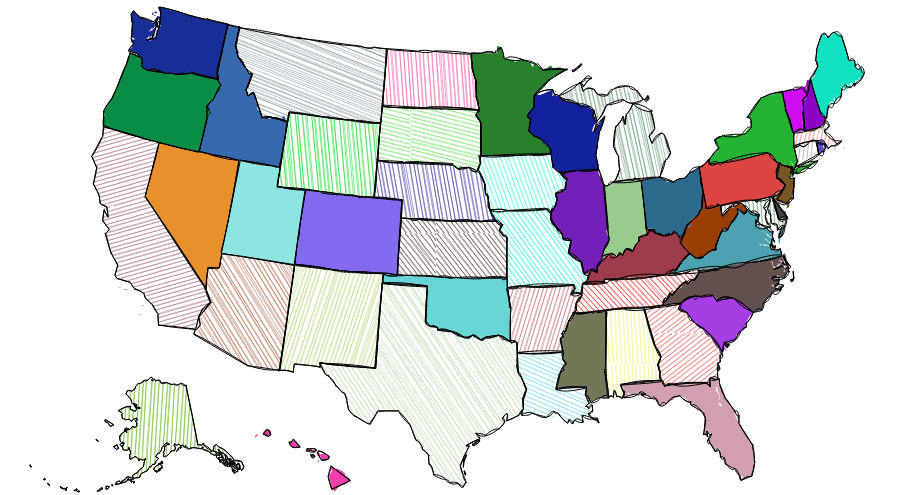
你可以在这里看到使用RoughJS生成地图的例子。
例子
你可以在这个页面中看到一些RoughJS使用例子。
简单的基本图形绘制
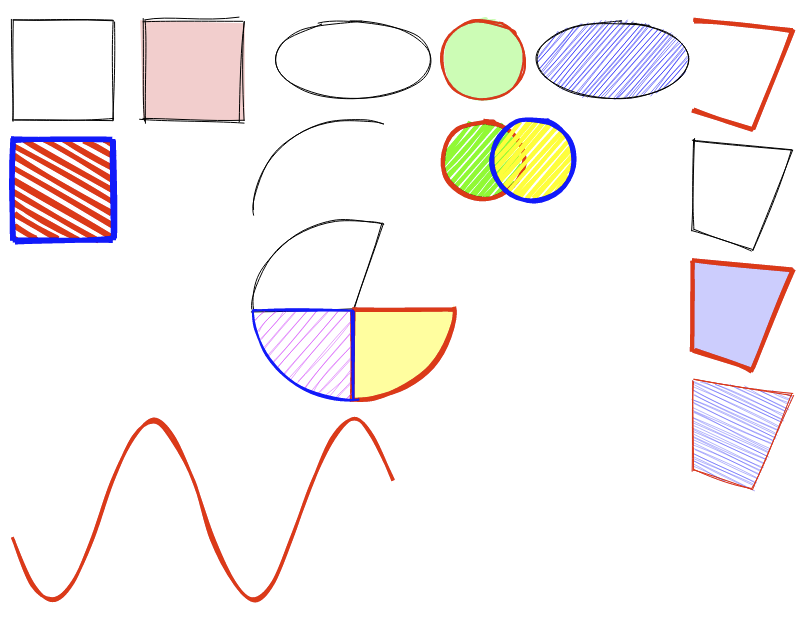
<canvas id="canvas" width="800" height="600"></canvas>
<script>
const rc = rough.canvas(document.getElementById('canvas'));

//line and rectangle
rc.rectangle(10, 10, 100, 100);
rc.rectangle(140, 10, 100, 100, {
  fill: 'rgba(255,0,0,0.2)',
  fillStyle: 'solid',
  roughness: 2
});
rc.rectangle(10, 130, 100, 100, {
  fill: 'red',
  stroke: 'blue',
  hachureAngle: 60,
  hachureGap: 10,
  fillWeight: 5,
  strokeWidth: 5
});

// ellipse and circle
rc.ellipse(350, 50, 150, 80);
rc.ellipse(610, 50, 150, 80, {
  fill: 'blue'
});
rc.circle(480, 50, 80, {
  stroke: 'red', strokeWidth: 2,
  fill: 'rgba(0,255,0,0.3)', fillStyle: 'solid'
});

//overlapping circles
rc.circle(480, 150, 80, {
  stroke: 'red', strokeWidth: 4,
  fill: 'rgba(0,255,0,1)', fillWeight: 4, hachureGap: 6
});
rc.circle(530, 150, 80, {
  stroke: 'blue', strokeWidth: 4,
  fill: 'rgba(255,255,0,1)', fillWeight: 4, hachureGap: 6
});

// linearPath and polygon
rc.linearPath([[690, 10], [790, 20], [750, 120], [690, 100]], {
  roughness: 0.7,
  stroke: 'red', strokeWidth: 4
});
rc.polygon([[690, 130], [790, 140], [750, 240], [690, 220]]);
rc.polygon([[690, 250], [790, 260], [750, 360], [690, 340]], {
  stroke: 'red', strokeWidth: 4,
  fill: 'rgba(0,0,255,0.2)', fillStyle: 'solid'
});
rc.polygon([[690, 370], [790, 385], [750, 480], [690, 460]], {
  stroke: 'red',
  hachureAngle: 65,
  fill: 'rgba(0,0,255,0.6)'
});

// arcs
rc.arc(350, 200, 200, 180, Math.PI, Math.PI * 1.6);
rc.arc(350, 300, 200, 180, Math.PI, Math.PI * 1.6, true);
rc.arc(350, 300, 200, 180, 0, Math.PI / 2, true, {
  stroke: 'red', strokeWidth: 4,
  fill: 'rgba(255,255,0,0.4)', fillStyle: 'solid'
});
rc.arc(350, 300, 200, 180, Math.PI / 2, Math.PI, true, {
  stroke: 'blue', strokeWidth: 2,
  fill: 'rgba(255,0,255,0.4)'
});

// draw sine curve
let points = [];
for (let i = 0; i < 20; i++) {
  // 4pi - 400px
  let x = (400 / 20) * i + 10;
  let xdeg = (Math.PI / 100) * x;
  let y = Math.round(Math.sin(xdeg) * 90) + 500;
  points.push([x, y]);
}
rc.curve(points, {
  roughness: 1.2, stroke: 'red', strokeWidth: 3
});
</script>
结合D3.js绘制柱形图
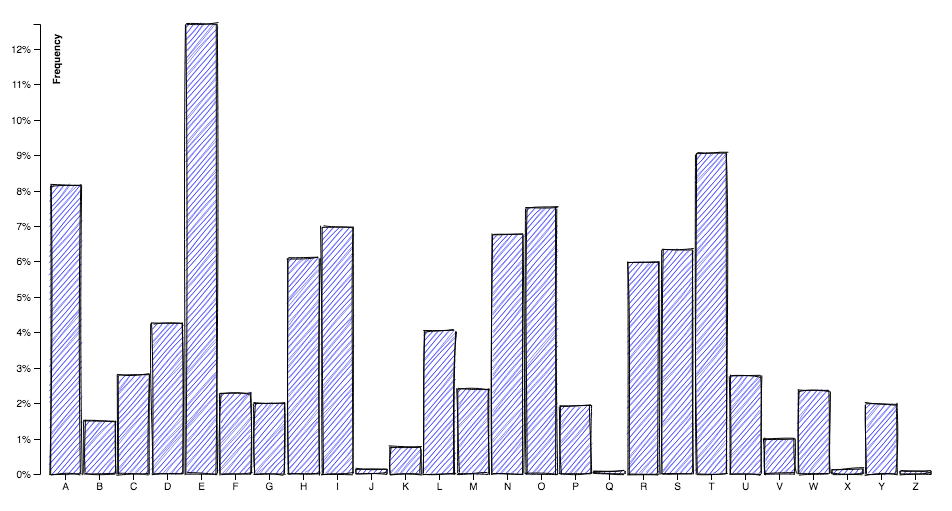
<script src="rough.min.js"></script>
<script src="https://d3js.org/d3.v4.min.js"></script>
<canvas id="canvas" width="960" height="500"></canvas>
<script>
var canvas = document.getElementById('canvas');
const rc = rough.canvas(canvas, {
  options: {
    fill: "blue",
    roughness: 0.8,
    bowing: 0.7
  }
});

var context = canvas.getContext("2d");
var margin = { top: 20, right: 20, bottom: 30, left: 40 },
  width = canvas.width - margin.left - margin.right,
  height = canvas.height - margin.top - margin.bottom;
var x = d3.scaleBand()
  .rangeRound([0, width])
  .padding(0.1);
var y = d3.scaleLinear()
  .rangeRound([height, 0]);
context.translate(margin.left, margin.top);

d3.tsv("data.tsv", function (d) {
  d.frequency = +d.frequency;
  return d;
}, function (error, data) {
  if (error) throw error;

  x.domain(data.map(function (d) { return d.letter; }));
  y.domain([0, d3.max(data, function (d) { return d.frequency; })]);

  var yTickCount = 10,
    yTicks = y.ticks(yTickCount),
    yTickFormat = y.tickFormat(yTickCount, "%");

  data.forEach(function (d) {
    rc.rectangle(x(d.letter), y(d.frequency), x.bandwidth(), height - y(d.frequency));
  });


  context.beginPath();
  x.domain().forEach(function (d) {
    context.moveTo(x(d) + x.bandwidth() / 2, height);
    context.lineTo(x(d) + x.bandwidth() / 2, height + 6);
  });
  context.strokeStyle = "black";
  context.stroke();

  context.textAlign = "center";
  context.textBaseline = "top";
  x.domain().forEach(function (d) {
    context.fillText(d, x(d) + x.bandwidth() / 2, height + 6);
  });

  context.beginPath();
  yTicks.forEach(function (d) {
    context.moveTo(0, y(d) + 0.5);
    context.lineTo(-6, y(d) + 0.5);
  });
  context.strokeStyle = "black";
  context.stroke();

  context.textAlign = "right";
  context.textBaseline = "middle";
  yTicks.forEach(function (d) {
    context.fillText(yTickFormat(d), -9, y(d));
  });

  context.beginPath();
  context.moveTo(-6.5, 0 + 0.5);
  context.lineTo(0.5, 0 + 0.5);
  context.lineTo(0.5, height + 0.5);
  context.lineTo(-6.5, height + 0.5);
  context.strokeStyle = "black";
  context.stroke();

  context.save();
  context.rotate(-Math.PI / 2);
  context.textAlign = "right";
  context.textBaseline = "top";
  context.font = "bold 10px sans-serif";
  context.fillText("Frequency", -10, 10);
  context.restore();
});
</script>
API
你可以非常欢乐地使用RoughJS,祝你好运!

 浙公网安备 33010602011771号