
一个go内存使用老是5G-10G的性能分析
内存问题定位过程详解
问题背景
- 项目运行在Docker中,内存占用一直保持在5G左右
- 需要找出内存具体用在哪里
定位步骤
第一步:添加内存监控
1.1 添加账户缓冲区监控
在 worker/ethereum/writer/account.go 中添加了内存监控功能:
// 每30秒输出一次缓冲区大小
memoryMonitorTicker := time.NewTicker(30 * time.Second)

// 监控内容:
// - Replace缓冲区大小和内存占用
// - Update缓冲区大小和内存占用
// - Channel缓冲区大小和内存占用
// - Go运行时内存统计(Alloc, HeapAlloc, HeapSys等)
		case <-memoryMonitorTicker.C:
			// 监控缓冲区大小
			replaceCount := getReplaceAccountsCount()
			updateCount := getUpdateAccountsCount()

			replaceChan := ctx.GetAccountReplaceChan()
			updateChan := ctx.GetAccountUpdateChan()
			replaceChanLen := 0
			updateChanLen := 0
			if replaceChan != nil {
				replaceChanLen = len(replaceChan)
			}
			if updateChan != nil {
				updateChanLen = len(updateChan)
			}

			// 估算内存使用(每个Account约300字节)
			replaceMemMB := float64(replaceCount) * 300 / 1024 / 1024
			updateMemMB := float64(updateCount) * 300 / 1024 / 1024
			replaceChanMemMB := float64(replaceChanLen) * 300 / 1024 / 1024
			updateChanMemMB := float64(updateChanLen) * 300 / 1024 / 1024
			bufferTotalMB := replaceMemMB + updateMemMB + replaceChanMemMB + updateChanMemMB

			// 获取Go运行时内存统计
			var m runtime.MemStats
			runtime.ReadMemStats(&m)
			allocMB := float64(m.Alloc) / 1024 / 1024
			sysMB := float64(m.Sys) / 1024 / 1024
			numGC := m.NumGC
			heapAllocMB := float64(m.HeapAlloc) / 1024 / 1024
			heapSysMB := float64(m.HeapSys) / 1024 / 1024
			heapInuseMB := float64(m.HeapInuse) / 1024 / 1024
			stackInuseMB := float64(m.StackInuse) / 1024 / 1024

			workerCommon.CustomPrintfInfo(ctx, "AccountWorker",
				"📊 内存监控 | 缓冲区: %.2fMB (Replace:%d, Update:%d, ReplaceChan:%d, UpdateChan:%d) | Go运行时: Alloc=%.2fMB, HeapAlloc=%.2fMB, HeapSys=%.2fMB, HeapInuse=%.2fMB, StackInuse=%.2fMB, Sys=%.2fMB, NumGC=%d",
				bufferTotalMB, replaceCount, updateCount, replaceChanLen, updateChanLen,
				allocMB, heapAllocMB, heapSysMB, heapInuseMB, stackInuseMB, sysMB, numGC)
结果:发现账户缓冲区只有2.10MB,不是主要问题。
1.2 添加Go运行时内存统计
在内存监控中添加了 runtime.MemStats:
			// 获取Go运行时内存统计
			var m runtime.MemStats
			runtime.ReadMemStats(&m)
			allocMB := float64(m.Alloc) / 1024 / 1024
			sysMB := float64(m.Sys) / 1024 / 1024
			numGC := m.NumGC
			heapAllocMB := float64(m.HeapAlloc) / 1024 / 1024
			heapSysMB := float64(m.HeapSys) / 1024 / 1024
			heapInuseMB := float64(m.HeapInuse) / 1024 / 1024
			stackInuseMB := float64(m.StackInuse) / 1024 / 1024

			workerCommon.CustomPrintfInfo(ctx, "AccountWorker",
				"📊 内存监控 | 缓冲区: %.2fMB (Replace:%d, Update:%d, ReplaceChan:%d, UpdateChan:%d) | Go运行时: Alloc=%.2fMB, HeapAlloc=%.2fMB, HeapSys=%.2fMB, HeapInuse=%.2fMB, StackInuse=%.2fMB, Sys=%.2fMB, NumGC=%d",
				bufferTotalMB, replaceCount, updateCount, replaceChanLen, updateChanLen,
				allocMB, heapAllocMB, heapSysMB, heapInuseMB, stackInuseMB, sysMB, numGC)
结果:发现堆内存6.2GB,系统内存9GB,但不知道具体用在哪里。
第二步:添加pprof性能分析
2.1 在main.go中启动pprof服务器
/*
Copyright © 2023 NAME HERE <EMAIL ADDRESS>
*/
package main

import (
	"fmt"
	"log"
	"net/http"
	_ "net/http/pprof"
	"os"
	"runtime"
	"runtime/pprof"
	"time"

	"github.com/octopus-net/web3_data_syncor/config"
	"github.com/octopus-net/web3_data_syncor/global"
	"github.com/octopus-net/web3_data_syncor/initialize"
	"github.com/octopus-net/web3_data_syncor/worker"
)

func main() {
	// 设置Go运行时使用所有可用的CPU核心
	runtime.GOMAXPROCS(runtime.NumCPU())

	config.InitializeConfig("config.yaml")

	// 初始化zap日志系统
	global.InitZap()

	// 启动pprof服务器(用于性能分析)
	startPprof()

	// 初始化数据库
	err := initialize.InitializeTables()
	if err != nil {
		fmt.Printf("Failed to initialize tables: %v\n", err)
		return
	}

	fmt.Printf("syncor start! Using %d CPU cores\n", runtime.NumCPU())
	fmt.Printf("pprof server started at http://localhost:6060/debug/pprof/\n")
	worker.Start()
}

// startPprof 启动pprof性能分析服务器
func startPprof() {
	// 注册自定义端点:保存heap profile到文件
	// 注意:不能使用 /debug/pprof/ 前缀,因为会与pprof的路由冲突
	// 使用 /debug/save-* 前缀来避免冲突
	http.HandleFunc("/debug/save-heap", saveHeapProfile)
	http.HandleFunc("/debug/save-allocs", saveAllocsProfile)

	// 在后台goroutine中启动pprof服务器
	go func() {
		// pprof默认会在 /debug/pprof/ 路径下提供以下端点:
		// - /debug/pprof/heap - 堆内存分析(实时查看)
		// - /debug/pprof/profile - CPU分析(需要30秒采样)
		// - /debug/pprof/goroutine - goroutine分析
		// - /debug/pprof/allocs - 内存分配分析(实时查看)
		// - /debug/pprof/block - 阻塞分析
		// - /debug/pprof/mutex - 互斥锁分析
		//
		// 自定义端点(保存文件):
		// - /debug/save-heap - 保存heap profile到文件
		// - /debug/save-allocs - 保存allocs profile到文件
		addr := "localhost:6060"
		log.Printf("pprof server starting at http://%s/debug/pprof/\n", addr)
		log.Printf("Custom endpoints: http://%s/debug/save-heap, http://%s/debug/save-allocs\n", addr, addr)
		if err := http.ListenAndServe(addr, nil); err != nil {
			log.Printf("pprof server failed to start: %v\n", err)
		}
	}()
}

// saveHeapProfile 保存heap profile到文件
func saveHeapProfile(w http.ResponseWriter, r *http.Request) {
	filename := fmt.Sprintf("heap_%s.pprof", time.Now().Format("20060102_150405"))
	f, err := os.Create(filename)
	if err != nil {
		http.Error(w, fmt.Sprintf("Failed to create file: %v", err), http.StatusInternalServerError)
		return
	}
	defer f.Close()

	if err := pprof.WriteHeapProfile(f); err != nil {
		http.Error(w, fmt.Sprintf("Failed to write heap profile: %v", err), http.StatusInternalServerError)
		return
	}

	w.Header().Set("Content-Type", "text/plain")
	fmt.Fprintf(w, "Heap profile saved to: %s\n", filename)
	log.Printf("Heap profile saved to: %s\n", filename)
}

// saveAllocsProfile 保存allocs profile到文件(内存分配分析)
func saveAllocsProfile(w http.ResponseWriter, r *http.Request) {
	filename := fmt.Sprintf("allocs_%s.pprof", time.Now().Format("20060102_150405"))
	f, err := os.Create(filename)
	if err != nil {
		http.Error(w, fmt.Sprintf("Failed to create file: %v", err), http.StatusInternalServerError)
		return
	}
	defer f.Close()

	profile := pprof.Lookup("allocs")
	if profile == nil {
		http.Error(w, "allocs profile not found", http.StatusInternalServerError)
		return
	}

	if err := profile.WriteTo(f, 0); err != nil {
		http.Error(w, fmt.Sprintf("Failed to write allocs profile: %v", err), http.StatusInternalServerError)
		return
	}

	w.Header().Set("Content-Type", "text/plain")
	fmt.Fprintf(w, "Allocs profile saved to: %s\n", filename)
	log.Printf("Allocs profile saved to: %s\n", filename)
}
提供的端点:
/debug/pprof/heap- 堆内存分析/debug/pprof/allocs- 内存分配分析/debug/pprof/goroutine- goroutine分析- 等等...
2.2 添加自定义端点保存profile文件
http.HandleFunc("/debug/save-heap", saveHeapProfile)
http.HandleFunc("/debug/save-allocs", saveAllocsProfile)
第三步:使用pprof分析内存
3.1 获取内存监控日志
从日志中看到:
📊 内存监控 | 缓冲区: 0.00MB | Go运行时:
Alloc=6212.31MB, HeapAlloc=6212.31MB, HeapSys=8977.94MB,
HeapInuse=6222.43MB, Sys=9007.08MB
分析:
- 账户缓冲区只有0MB,不是问题
- 堆内存6.2GB,系统内存9GB - 这是真正的问题
3.2 使用pprof分析堆内存
# 分析正在使用的内存(inuse_space)
go tool pprof -text -sample_index=inuse_space -nodecount=50 \
  http://localhost:6060/debug/pprof/heap
关键输出:
jayzhan@192 Downloads % go tool pprof http://localhost:6060/debug/pprof/heap
Fetching profile over HTTP from http://localhost:6060/debug/pprof/heap
Saved profile in /Users/jayzhan/pprof/pprof.web3_data_syncor.alloc_objects.alloc_space.inuse_objects.inuse_space.001.pb.gz
File: web3_data_syncor
Build ID: 9716bbc16f2c909e0c3715ab2d7143c0ca2ebef4
Type: inuse_space
Time: Dec 5, 2025 at 10:19am (CST)
Entering interactive mode (type "help" for commands, "o" for options)
(pprof) top
Showing nodes accounting for 2400.05MB, 99.36% of 2415.42MB total
Dropped 37 nodes (cum <= 12.08MB)
Showing top 10 nodes out of 15
      flat  flat%   sum%        cum   cum%
    1800MB 74.52% 74.52%     1800MB 74.52%  bufio.NewReaderSize (inline)
  600.05MB 24.84% 99.36%  2400.05MB 99.36%  github.com/gorilla/websocket.newConn
         0     0% 99.36%  2209.62MB 91.48%  github.com/TripleCWeb/go-utils.RunParallelTasksEx.func1
         0     0% 99.36%  2400.05MB 99.36%  github.com/ethereum/go-ethereum/rpc.DialOptions
         0     0% 99.36%  2400.05MB 99.36%  github.com/ethereum/go-ethereum/rpc.newClient
         0     0% 99.36%  2400.05MB 99.36%  github.com/ethereum/go-ethereum/rpc.newClientTransportWS.func1
         0     0% 99.36%  2400.05MB 99.36%  github.com/gorilla/websocket.(*Dialer).DialContext
         0     0% 99.36%  2400.05MB 99.36%  github.com/octopus-net/web3_data_syncor/utils.RetryFunc[go.shape.*uint8] (inline)
         0     0% 99.36%  1201.10MB 49.73%  github.com/octopus-net/web3_data_syncor/worker/ethereum.ProcessBlockTaskData.func1
         0     0% 99.36%  1008.52MB 41.75%  github.com/octopus-net/web3_data_syncor/worker/ethereum.ProcessBlockTaskData.func2
发现:
bufio.NewReaderSize 自己分配了 1800MB,而 websocket.newConn 自己分配 600MB 并调用它再分配 1800MB,因此总共占用 2400MB。
- 两者都与WebSocket连接相关
3.3 分析调用链
从pprof输出可以看到调用链:
GetClient
  -> rpc.DialOptions
    -> websocket.newConn
      -> bufio.NewReaderSize (1800MB)
结论:WebSocket连接的缓冲区占用了大量内存。
第四步:定位代码问题
4.1 查找WebSocket连接创建代码
使用codebase_search查找:
// worker/ethereum/common/ethclient.go
func getClient(ctx workerCommon.Context, rpcAddress string) {
    if u.Scheme == "ws" || u.Scheme == "wss" {
        readBufferSize := 100 * 1024 * 1024   // 100MB ❌
        writeBufferSize := 100 * 1024 * 1024  // 100MB ❌

        dialer := &websocket.Dialer{
            ReadBufferSize:  readBufferSize,
            WriteBufferSize: writeBufferSize,
        }
    }
}
发现问题:每个WebSocket连接的缓冲区设置为100MB(读取)+ 100MB(写入)= 200MB/连接
4.2 分析连接数量
查找代码中创建连接的位置:
-
ProcessBlockTaskData (block_task.go):
- 每个consumer创建2个连接(区块处理 + 日志处理)
- 10个consumer = 20个连接
-
aggregateTaskData (block_task.go):
- 每个consumer创建1个连接(余额查询)
- 10个consumer = 10个连接
-
subscriber (subscriber.go):
- 1个连接(订阅新区块)
总计:20-30个连接 × 200MB = 4-6GB内存
第五步:验证和优化
5.1 计算内存占用
- 单个连接:200MB(读取100MB + 写入100MB)
- 10个并发consumer,每个2-3个连接:20-30个连接
- 总内存:20-30 × 200MB = 4-6GB ✅ 与监控数据吻合
5.2 实施优化
将缓冲区从100MB减少到2MB:
// 优化后
readBufferSize := 2 * 1024 * 1024   // 2MB
writeBufferSize := 2 * 1024 * 1024  // 2MB
预期效果:
- 单个连接:从200MB减少到4MB(减少98%)
- 30个连接:从6GB减少到120MB(减少98%)
定位工具总结
使用的工具
-
内存监控日志 (
runtime.MemStats)- 快速了解总体内存使用情况
- 发现堆内存6.2GB,但不知道具体用在哪里
-
pprof性能分析 (
go tool pprof)- 精确定位内存占用最多的函数
- 发现
bufio.NewReaderSize占用1800MB
-
代码搜索 (
codebase_search)- 找到WebSocket连接创建代码
- 发现缓冲区设置为100MB
-
调用链分析 (pprof的cum列)
- 理解内存占用的调用路径
- 从GetClient -> DialOptions -> newConn -> NewReaderSize
定位流程图
内存监控日志
    ↓
发现堆内存6.2GB
    ↓
pprof分析堆内存
    ↓
发现bufio.NewReaderSize占用1800MB
    ↓
分析调用链:GetClient -> websocket.newConn
    ↓
查找GetClient代码
    ↓
发现WebSocket缓冲区设置为100MB
    ↓
计算:30个连接 × 200MB = 6GB ✅
    ↓
优化:减少到2MB
关键技巧
1. 分层定位
- 第一层:内存监控日志 - 快速定位总体问题
- 第二层:pprof分析 - 精确定位具体函数
- 第三层:代码分析 - 找到根本原因
2. pprof使用技巧
# 查看正在使用的内存(最重要)
go tool pprof -text -sample_index=inuse_space http://localhost:6060/debug/pprof/heap

# 查看累计分配的内存
go tool pprof -text -sample_index=alloc_space http://localhost:6060/debug/pprof/heap

# 在浏览器中查看(最直观)
go tool pprof -http=:8080 http://localhost:6060/debug/pprof/heap
3. 关注flat%和cum%
- flat%: 函数自身占用的内存
- cum%: 函数及其调用的子函数占用的总内存
从输出可以看到:
bufio.NewReaderSize: flat=1800MB (88.99%)  ← 这里直接占用1800MB
websocket.newConn:   flat=600MB (9.89%)   ← 这里直接占用600MB
GetClient:           cum=1800MB (98.88%)  ← 通过调用链间接占用
4. 验证假设
通过计算验证:
- 30个连接 × 200MB = 6GB ✅ 与监控数据吻合
- 说明定位准确
经验总结
- 先监控,后分析:先添加监控了解总体情况,再用pprof精确定位
- 关注top占用:pprof的top函数通常就是问题所在
- 结合代码分析:pprof只能告诉你"哪里",代码分析告诉你"为什么"
- 验证假设:通过计算验证定位的准确性
后续优化建议
如果内存仍然较高,可以:
- 连接池复用:避免频繁创建/关闭连接
- 减少并发数:ConsumerCount从10减少到5-8
- 批量处理优化:减少BatchBlockSize从100到50
- 定期检查:使用pprof定期检查内存使用情况
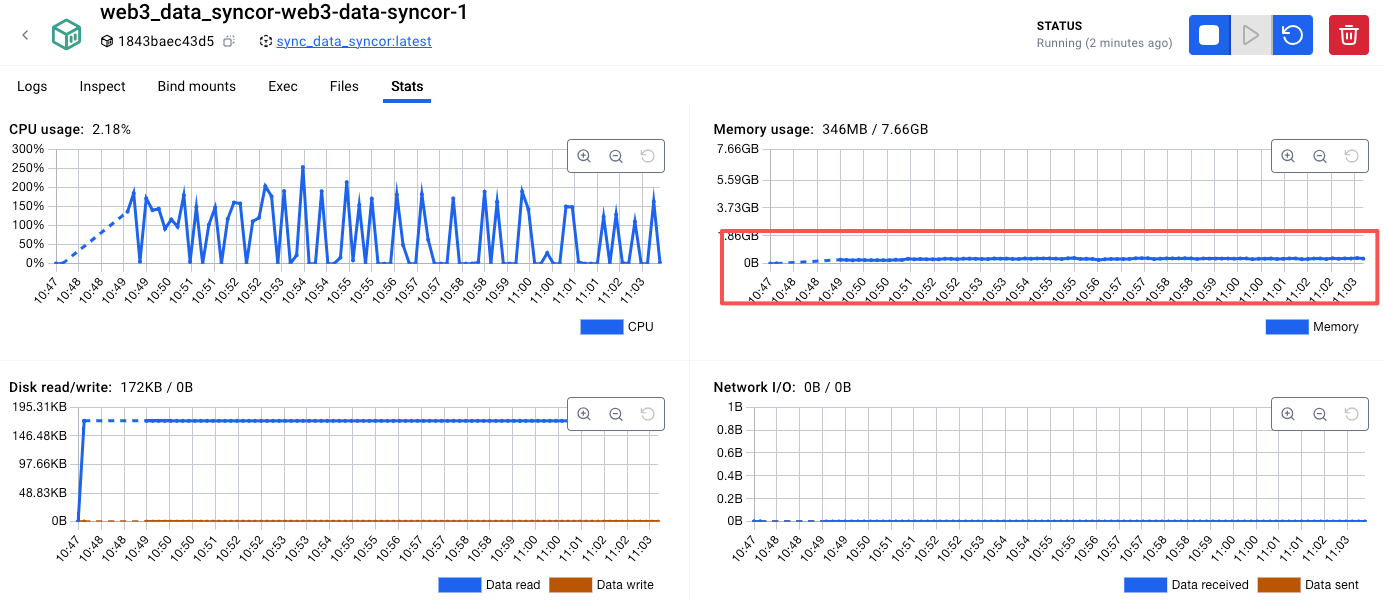
优化完成以后,内存就降下来了:

 浙公网安备 33010602011771号