
常见激活函数图与数学表达式汇总
1. Sigmoid
数学表达式
\[f(x) = \frac{1}{1+e^{-x}}
\]
图像

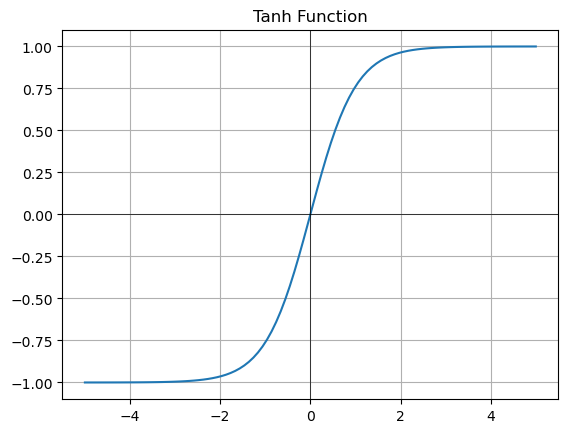
2. Tanh
数学表达式
\[f(x) = \frac{e^x - e^{-x}}{e^x + e^{-x}}
\]
图像
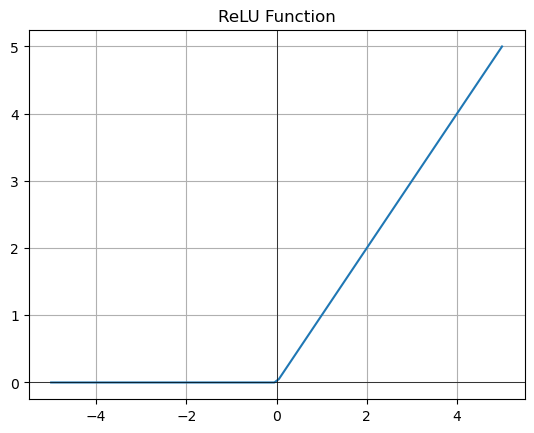
3. ReLU
数学表达式
\[f(x) = \max(0, x)
\]
图像
4. Leaky ReLU
数学表达式
\[f(x) = \begin{cases}
x, & x > 0 \\
\alpha x, & x \leq 0
\end{cases}
\]
其中,α 是一个小于1的参数,通常取0.01。
图像

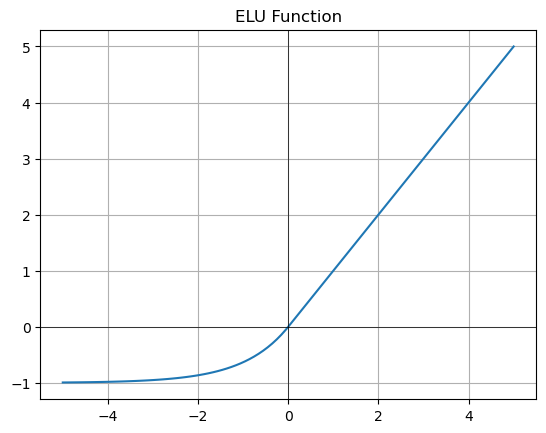
5. ELU
数学表达式
\[f(x) = \begin{cases}
x, & x > 0 \\
\alpha(e^x - 1), & x \leq 0
\end{cases}
\]
其中,α 是一个大于0的参数,通常取1。
图像
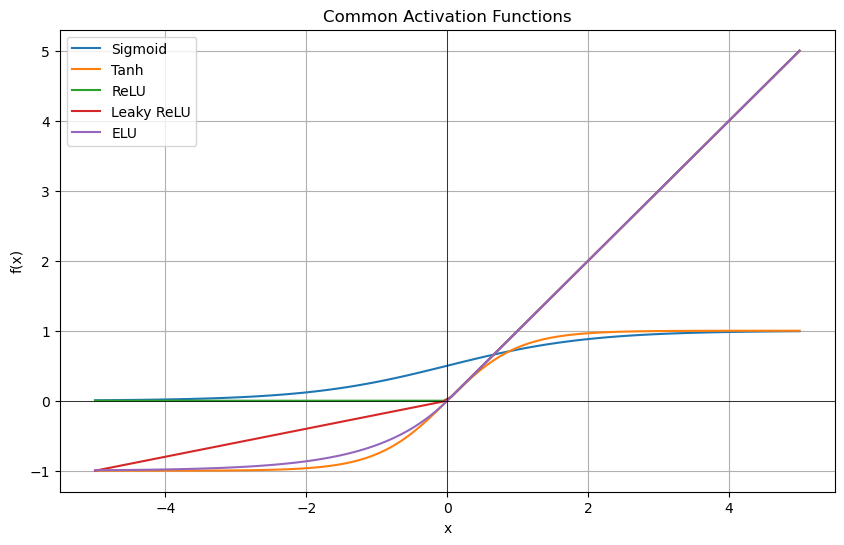
比较图
点击查看代码
import numpy as np
import matplotlib.pyplot as plt

def sigmoid(x):
    return 1 / (1 + np.exp(-x))

def tanh(x):
    return np.tanh(x)

def relu(x):
    return np.maximum(0, x)

def leaky_relu(x, alpha=0.01):
    return np.where(x > 0, x, alpha * x)

def elu(x, alpha=1.0):
    return np.where(x > 0, x, alpha * (np.exp(x) - 1))

# 创建输入数据
x = np.linspace(-5, 5, 100)

# 创建画布
plt.figure(figsize=(10, 6))

# 绘制每个激活函数的图像
plt.plot(x, sigmoid(x), label='Sigmoid')
plt.plot(x, tanh(x), label='Tanh')
plt.plot(x, relu(x), label='ReLU')
plt.plot(x, leaky_relu(x), label='Leaky ReLU')
plt.plot(x, elu(x), label='ELU')

# 标注坐标轴
plt.axhline(0, color='black',linewidth=1)
plt.axvline(0, color='black',linewidth=1)

# 添加图例和标题
plt.legend()
plt.title('Common Activation Functions')
plt.xlabel('x')
plt.ylabel('f(x)')

plt.grid(True)

plt.show()
运行环境
matplotlib                3.8.0           py311haa95532_0
numpy                     1.26.0          py311hdab7c0b_0
