Grafana + Prometheus + Mysqld_exporter 监控 Mysql
最近研究了对于Mysql的监控,感觉Prometheus还是挺强大的,有各种适配的度量导出工具,Mysqld_exporter也是旗下的一款工具,可以在Prometheus官网下载。
因为本机电脑用的操作系统是Windows,所以下载了win版本的Mysqld_exporter:
https://prometheus.io/download/
1.在mysql中为Mysqld_exporter创建用户:
CREATE USER 'exporter'@'localhost' IDENTIFIED BY 'root' WITH MAX_USER_CONNECTIONS 3;
GRANT PROCESS, REPLICATION CLIENT, SELECT ON *.* TO 'exporter'@'localhost';
在GitHub上也有详细说明:https://github.com/prometheus/mysqld_exporter
2.将下载的Mysqld_exporter的压缩包解压,创建.my.cnf文件,压缩包中未包含该文件,需要自己手动创建
[client]
host=localhost
port=3306
user=exporter
password=root
3.配置Promethus的config,Mysqld_exporter默认端口为9104:
- job_name: mysql
    static_configs:
    - targets: ['localhost:9104']
      labels:
          instance: mydb
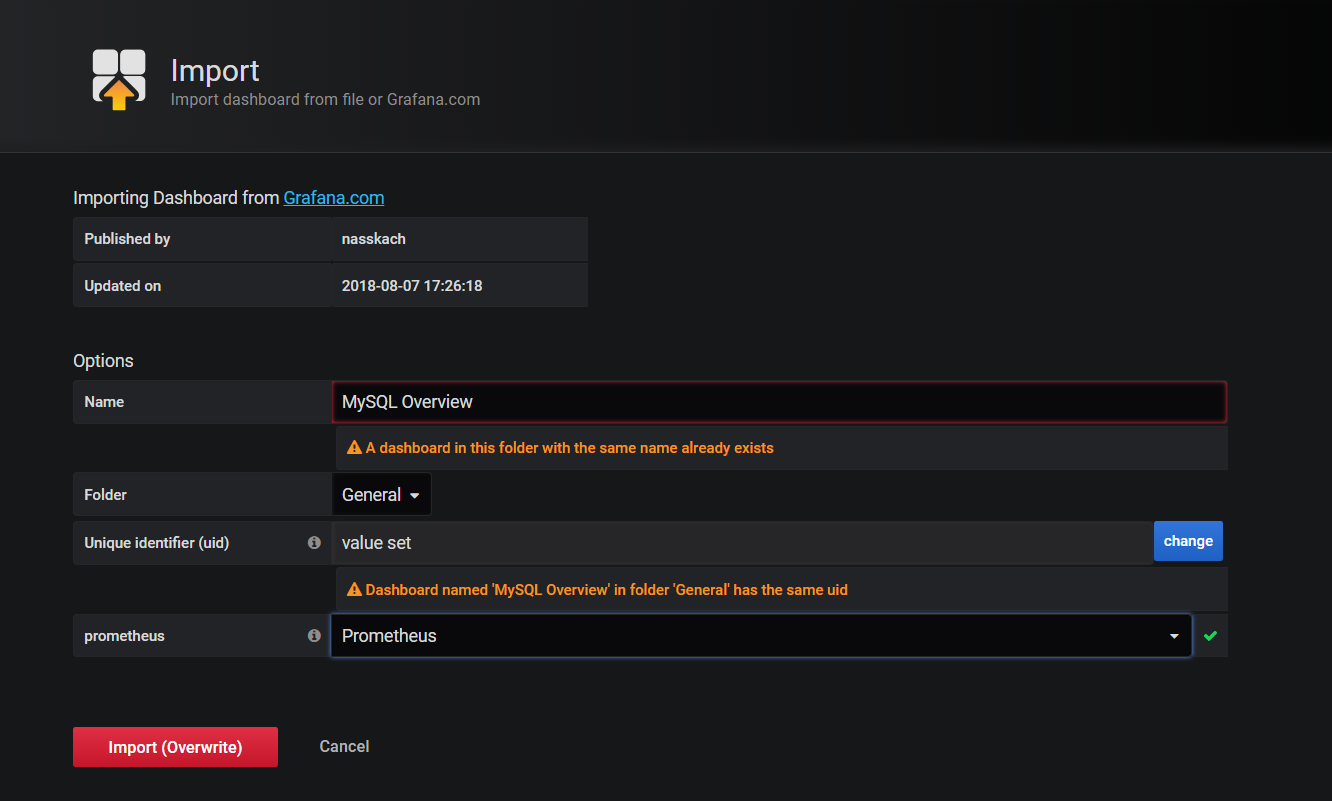
4.Grafana我使用的是模板是7362,直接Import就好,在Import之前应首先在Grafana创建Promethus的数据源
https://grafana.com/grafana/dashboards/7362
因为我之前已经导入过了,再重新导入会有提示,不用理会,覆盖就可以了

至此,对于Mysql的监控系统已搭建起来。
注意:度量导出器以及Prometheus最好限制为内网访问。


 浙公网安备 33010602011771号