
百度热搜爬虫分析
一、选题背景
如今,我们日常生活获取到的信息渠道有很多种。如视频、文章、报纸、音频。像获取新闻热点平台有:百度、今日头条、抖音、bilibili、新浪微博、网易新闻……百度热搜以数亿用户海量的真实数据为基础,通过专业的数据挖掘方法,计算关键词的热搜指数,旨在建立权威、全面、热门、时效的各类关键词排行榜,引领热词阅读时代。此次课题依据百度热搜指数进行爬取可视化分析。
二、爬虫方案设计
名称:百度热搜爬虫系统
2.1爬取内容与数据特征分析
爬取内容:热搜、小说、热搜指数。
数据特征分析:网页文本。
2.2主题式网络爬虫设计方案概述
方案概述:
- 利用request进行访问请求
- 解析网页内容,这里使用xtree.xpath进行网页解析。
- 数据存储,利用open()函数创建表格模板、wirtelines()函数进行输出存储。
- 查看网页结构。
- 查看网页爬取内容的位置。
- 取出数据。
- 遍历数据。
- 数据存储。
2.2.1 思路
- 查看网页结构。
- 查看网页爬取内容的位置。
- 取出数据。
2.2.2技术难点
- 异常处理。
- 网页内容读取,xtree第三方库用法。
- 数据遍历。
- 数据批量存储
- 整体系统设计。
三、技术难点
3.1主题页面的结构特征与分析

3.2 Htmls 页面解析
将关键词与url进行贴合成为访问的url。之后调用相对应关键词。
url ='https://top.baidu.com/board?tab={}'.format
(Baidu_hotdic["?"])
realtime()
页面解析:
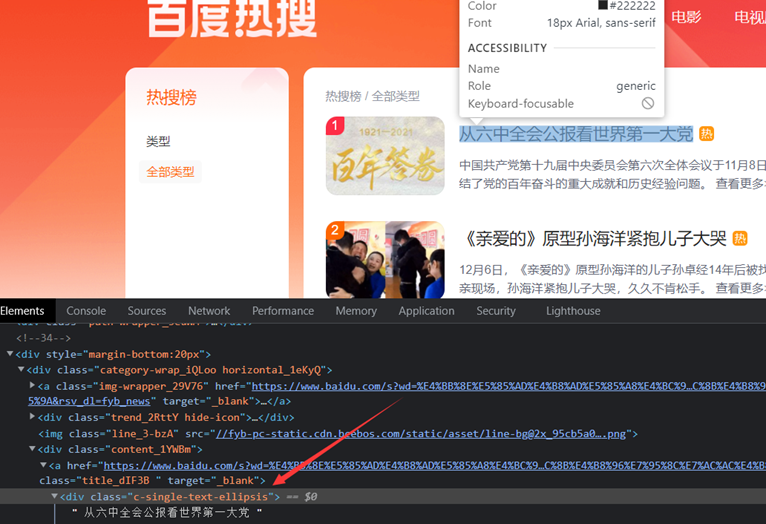
title:爬取的title名在<div class="c-single-text-ellipsis"> 从六中全会公报看世界第一大党 <!--39--></div>
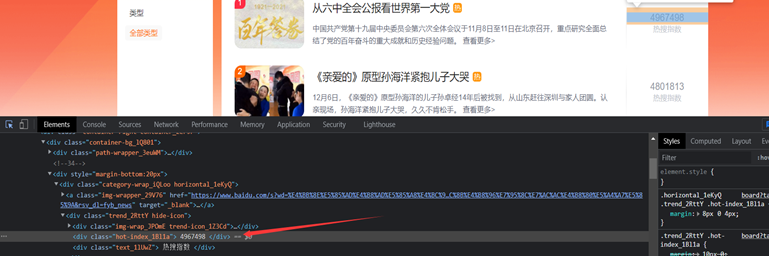
热度指数:<div class="hot-index_1Bl1a"> 4967498 </div>
3.3节点查找方法与遍历方法
查找节点:
标题:
hot_title=html.xpath('//[@id="sanRoot"]/main/div[2]/div/div[2]/div[{}]/div[2]/a/div[1])
热度指数:
hot_zhishu=html.xpath('//*[@id="sanRoot"]/main/div[2]/div/div[2]/div[{}]/div[1]/div[2])
遍历方法:
采用for循环把内容取出。
四、网络爬虫设计
4.1数据爬取与采集
代码分析:
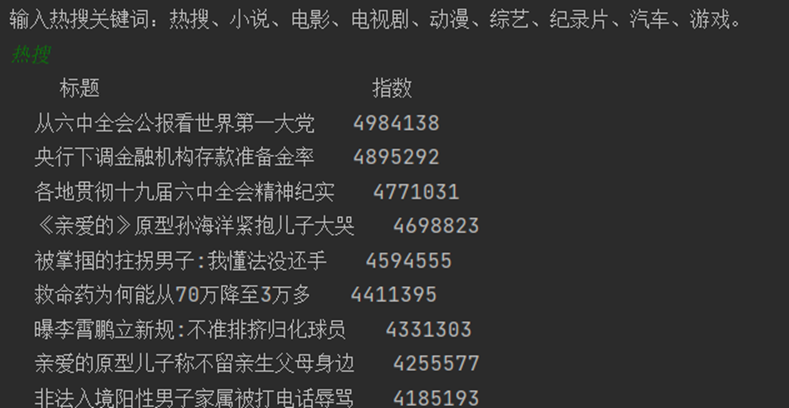
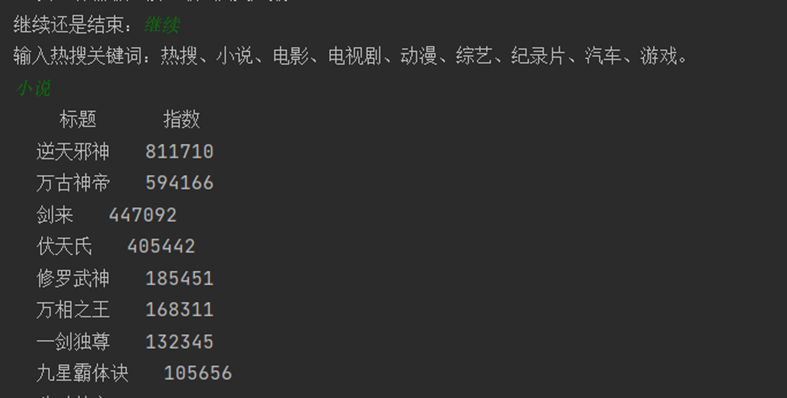
Main函数:
        代码分析:主函大概代码意思是,根据输入的关键词,将关键词与url进行贴合成为访问的url。之后调用相对应关键词的数据爬取方法。
        if __name__ == '__main__':
            while(True):
hot = input("输入热搜关键词:热搜、小说、电影、电视剧、动漫、综艺、纪录片、汽车、游戏。\n")
                if hot in "热搜":
                    url ='https://top.baidu.com/board?tab={}'.format
(Baidu_hotdic["热搜"])
                        realtime()
                elif hot in "小说":
                    url = 'https://top.baidu.com/board?tab={}'.format
(Baidu_hotdic["小说"])
                    novel()
                elif hot in "电影":
                    url = 'https://top.baidu.com/board?tab={}'.format
(Baidu_hotdic["电影"])
                    movie()
               elif hot in "电视剧":
                    url = 'https://top.baidu.com/board?tab={}'.format
(Baidu_hotdic["电视剧"])
                   teleplay()
                elif hot in "动漫":
                    url = 'https://top.baidu.com/board?tab={}'.format
(Baidu_hotdic["动漫"])
                   cartoon()
                elif hot in "综艺":
                    url = 'https://top.baidu.com/board?tab={}'.format
(Baidu_hotdic["综艺"])
                    variety()
                elif hot in "纪录片":
                    url = 'https://top.baidu.com/board?tab={}'.format
(Baidu_hotdic["纪录片"])
                    documentary()
                elif hot in "汽车":
                    url = 'https://top.baidu.com/board?tab={}'.format
(Baidu_hotdic["汽车"])
                    car()
                elif hot in "游戏":
                    url = 'https://top.baidu.com/board?tab={}'.format
(Baidu_hotdic["游戏"])
                    game()
                else:
                    print("搜索词错误!!!")

            choice = input("继续还是结束:")
            if choice in "继续":
            continue
            elif choice in "结束":
            break
            else:
            print("输入有误!")


功能代码:
def realtime():
    # 创建hot_realtime.csv
    file = open("hot_realtime.csv", "a")
    #定义表格模板并关闭表格
    file.write("hot_title" + "," + "hot_zhishu" + '\n')
    file = file.close()
    #请求访问
    req = requests.get(url=url,headers=headers)
    # print(req.text)
    #解析页面
    html = etree.HTML(req.text)
    count = 1
    print("\t标题\t\t\t\t\t\t", "指数")
    #for循环内容提取
    for i in range(1,31):
         #xpath()定位目标位置
        hot_title = html.xpath('//*[@id="sanRoot"]/main/div[2]
/div/div[2]/div[{}]/div[2]/a/div[1]/text()'.format(count))
#从列表中提取出内容转换成字符串类型
        for i in hot_title:
           hot_title = i
hot_zhishu = html.xpath('//*[@id="sanRoot"]/main
/div[2]/div/div[2]/div[{}]/div[1]/div[2]/text()'.format(count))
        for i in hot_zhishu:
            hot_zhishu = i
        #打开文件并保存数据
        with open("hot_realtime.csv", "a") as f:
             #将数据写入表格中
            f.writelines(hot_title + "," + hot_zhishu + '\n')
            f.close()
        count += 1
        print(hot_title,hot_zhishu)
4.2爬虫系统运行
4.2数据清洗与处理
数据导入:
import seaborn as sns
import matplotlib.pyplot as plt
import numpy as mp
from scipy.optimize import leastsq
import pandas as pd
realtime = pd.read_excel('hot_realtime.xlsx')
novel = pd.read_excel('hot_novel.xlsx')
数据清洗处理:
# 重复值处理
realtime = realtime.drop_duplicates('name')
# Nan处理
realtime = realtime.dropna(axis = 0)
#空白值处理
realtime = realtime.dropna()
# 删除无效行
realtime = realtime.drop([''], axis = 1)
realtime
# 重复值处理
novel = novel.drop_duplicates('name')
# Nan处理
novel = novel.dropna(axis = 0)
#空白值处理
novel = novel.dropna()
# 删除无效行
novel = novel.drop([''], axis = 1)
novel
4.3数据可视化分析
# 价格进行降序排列分析
x = novel['hot_title']
y = novel['hot_zhishu']
fig = plt.figure(figsize=(10, 4), dpi=80)
plt.rcParams['font.sans-serif']=['SimHei'] #用来正常显示中文标签
plt.rcParams['axes.unicode_minus']=False
plt.xticks(rotation=90)
plt.plot(x,y,'s-',color = 'purple',label="热度")#s-:方形
plt.legend(loc = "best")#图例
plt.title("小说热度趋势图",fontsize=18)
plt.xticks(fontsize=12)
plt.ylabel("热度指数",fontsize=12)#纵坐标名字
plt.show()

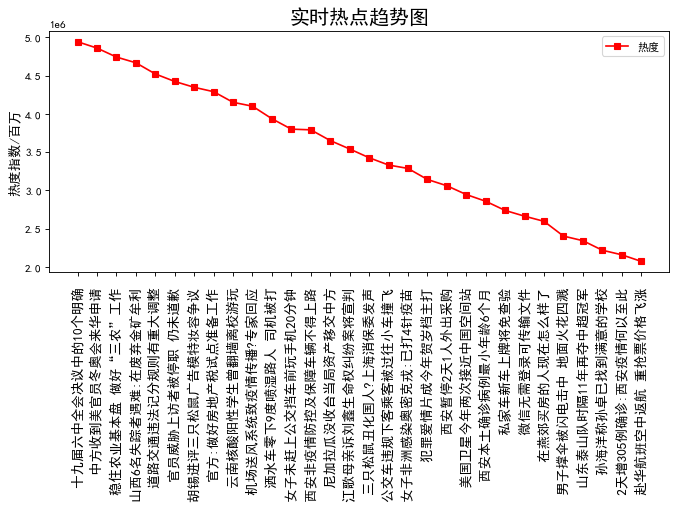
# 价格进行降序排列分析
x = realtime['hot_title']
y = realtime['hot_zhishu']
fig = plt.figure(figsize=(10, 4), dpi=80)
plt.rcParams['font.sans-serif']=['SimHei'] #用来正常显示中文标签
plt.rcParams['axes.unicode_minus']=False
plt.xticks(rotation=90)
plt.plot(x,y,'s-',color = 'r',label="热度")#s-:方形
plt.legend(loc = "best")#图例
plt.title("实时热点趋势图",fontsize=18)
plt.xticks(fontsize=12)
plt.ylabel("热度指数/百万",fontsize=12)#纵坐标名字
plt.show()
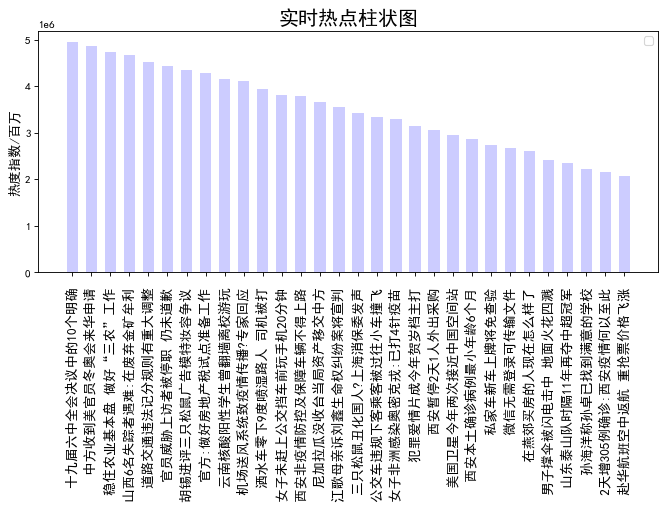
x = realtime['hot_title']
y = realtime['hot_zhishu']
fig = plt.figure(figsize=(10, 4), dpi=80)
plt.rcParams['font.sans-serif']=['SimHei'] #用来正常显示中文标签
plt.rcParams['axes.unicode_minus']=False
plt.xticks(rotation=90)
plt.bar(x,y,alpha=0.2, width=0.6, color='b', lw=3)
plt.legend(loc = "best")#图例
plt.title("实时热点柱状图",fontsize=18)
plt.xticks(fontsize=12)
plt.ylabel("热度指数/百万",fontsize=12)#纵坐标名字
plt.show()
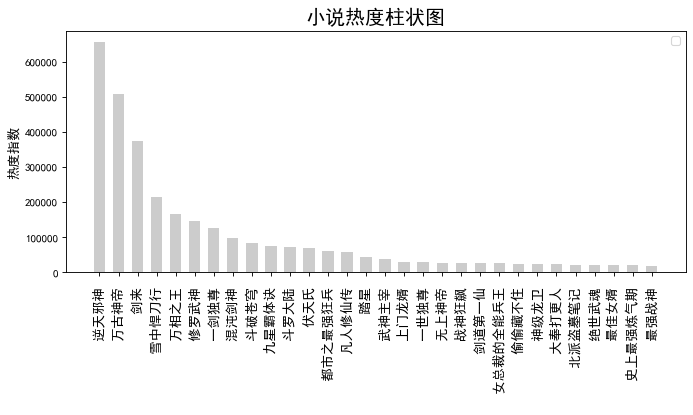
# 价格进行降序排列分析
x = novel['hot_title']
y = novel['hot_zhishu']
fig = plt.figure(figsize=(10, 4), dpi=80)
plt.rcParams['font.sans-serif']=['SimHei'] #用来正常显示中文标签
plt.rcParams['axes.unicode_minus']=False
plt.xticks(rotation=90)
plt.bar(x,y,alpha=0.2, width=0.6, color='k', lw=3)
plt.legend(loc = "best")#图例
plt.title("小说热度柱状图",fontsize=18)
plt.xticks(fontsize=12)
plt.ylabel("热度指数",fontsize=12)#纵坐标名字
plt.show()
# 水平图
x = realtime['hot_title']
y = realtime['hot_zhishu']
fig = plt.figure(figsize=(10, 8), dpi=80)
plt.barh(x,y, alpha=0.2, height=0.6, color='coral')
plt.title("时事热点水平图",fontsize=18)
plt.legend(loc = "best")#图例
# plt.xticks(rotation=180)
plt.xlabel("热度指数/百万",fontsize=12)#纵坐标名字

# 水平图
x = novel['hot_title']
y = novel['hot_zhishu']
fig = plt.figure(figsize=(10, 8), dpi=80)
plt.barh(x,y, alpha=0.2, height=0.6, color='dodgerblue')
plt.title("小说热度水平图",fontsize=18)
plt.legend(loc = "best")#图例
# plt.xticks(rotation=180)
plt.xlabel("热度指数",fontsize=12)#纵坐标名字

# 散点图
x = realtime['hot_title']
y = realtime['hot_zhishu']
fig = plt.figure(figsize=(10, 6), dpi=80)
ax = plt.subplot(1, 1, 1)
plt.rcParams['font.sans-serif']=['SimHei'] #用来正常显示中文标签
plt.scatter(x,y,color='b',marker='o',s=60,alpha=1)
plt.xticks(rotation=90)
plt.xticks([])
plt.ylabel("热度",fontsize=12)#横坐标名字
plt.title("时事热点散点图",fontsize=16)

# 散点图
x = novel['hot_title']
y = novel['hot_zhishu']
fig = plt.figure(figsize=(10, 6), dpi=80)
ax = plt.subplot(1, 1, 1)
plt.rcParams['font.sans-serif']=['SimHei'] #用来正常显示中文标签
plt.scatter(x,y,color='c',marker='o',s=60,alpha=1)
plt.xticks(rotation=90)
plt.xticks([])
plt.ylabel("热度",fontsize=12)#横坐标名字
plt.title("小说热度散点图",fontsize=16)

# 盒图
y = novel['hot_zhishu']
plt.boxplot(y)
plt.title("小说热度盒图",fontsize=16)
plt.show()

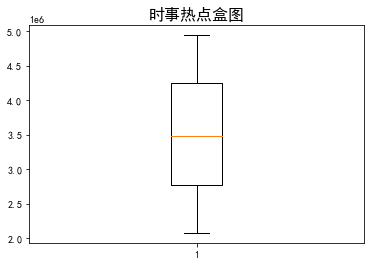
# 盒图
y = realtime['hot_zhishu']
plt.boxplot(y)
plt.title("时事热点盒图",fontsize=16)
plt.show()
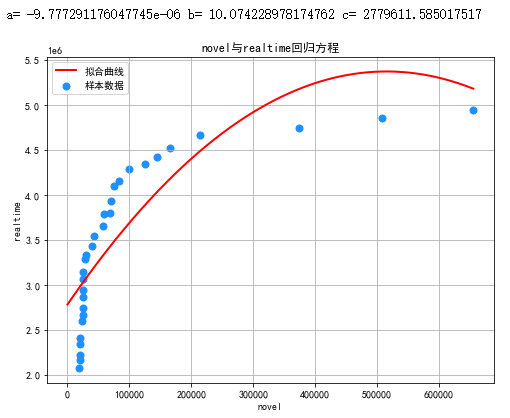
线性回归
plt.rcParams['font.sans-serif'] = ['SimHei']#解决乱码问题
#定义变量
novel=novel.loc[:,'hot_zhishu']
realtime=realtime.loc[:,'hot_zhishu']
#函数表达式
def func(params,x):
    a,b,c=params
    return a*x*x+b*x+c
def error_func(params,x,y):
    return func(params,x)-y
P0=[1,9.0]
def main():
    plt.figure(figsize=(8,6))
    P0=[1,9.0,1]
    Para=leastsq(error_func,P0,args=(gsgm,zprs))
    a,b,c=Para[0]
    print("a=",a, "b=",b, "c=",c)
    #绘图
    plt.scatter(novel,realtime,color="dodgerblue",label="样本数据",linewidth=2)
    x=mp.linspace(655245,200,4000)
    y=a*x*x+b*x+c
    #右上角标
    plt.plot(x,y,color="red",label="拟合曲线",linewidth=2)
    #x,y轴名称
    plt.xlabel('novel')
    plt.ylabel('realtime')
    #标题
    plt.title("novel与realtime回归方程")
    plt.grid()
    plt.legend()
    plt.show()
    print(x)
    print(y)
main()
4.4文本分析
# 词云
import random
import wordcloud as wc
import matplotlib.pyplot as plt

# 定义图片尺寸
word_cloud = wc.WordCloud(
   background_color='black',
   font_path='msyhbd.ttc',
   max_font_size=300,
   random_state=50,
                       )
text = realtime['hot_title']
text = " ".join(text)
# 绘制词云
fig = plt.figure(figsize=(8, 4), dpi=80)
ax = plt.subplot(1, 1, 1)
word_cloud.generate(text)
plt.imshow(word_cloud)
plt.show()

# 词云
import random
import wordcloud as wc
import matplotlib.pyplot as plt

# 定义图片尺寸
word_cloud = wc.WordCloud(
   background_color='black',
   font_path='msyhbd.ttc',
   max_font_size=300,
   random_state=50,
                       )
text = novel['hot_title']
text = " ".join(text)
# 绘制词云
fig = plt.figure(figsize=(8, 4), dpi=80)
ax = plt.subplot(1, 1, 1)
word_cloud.generate(text)
plt.imshow(word_cloud)
plt.show()

五、总结
1.经过对主题数据的分析与可视化,可以得到哪些结论?是否达到预期的目标?
根据热搜指数分析出近期实事热点是“十九届六中全会决议中的10个明确”,小说热度最高的是《逆天邪神》。分析结果达到预期
2.在完成此设计过程中,得到哪些收获?以及要改进的建议?
在此次设计过程种我对数据处理种的数据筛出有了很大的收获,譬如怎么进行类型转换,然后达到自己的想要的效果。受益匪浅,需要改进的地方可能就是编写程序反应时间过慢编程经验比较欠缺。

 浙公网安备 33010602011771号