
Go语言的堆栈分析
本文为理解翻译,原文地址:http://www.goinggo.net/2015/01/stack-traces-in-go.html
Introduction
在Go语言中有一些调试技巧能帮助我们快速找到问题,有时候你想尽可能多的记录异常但仍觉得不够,搞清楚堆栈的意义有助于定位Bug或者记录更完整的信息。
本文将讨论堆栈跟踪信息以及如何在堆栈中识别函数所传递的参数。
Functions
先从这段代码开始:
Functions
先从这段代码开始:
Listing 1
01 package main
02
03 func main() {
04 slice := make([]string, 2, 4)
05 Example(slice, "hello", 10)
06 }
07
08 func Example(slice []string, str string, i int) {
09 panic("Want stack trace")
10 }
02
03 func main() {
04 slice := make([]string, 2, 4)
05 Example(slice, "hello", 10)
06 }
07
08 func Example(slice []string, str string, i int) {
09 panic("Want stack trace")
10 }
Example函数定义了3个参数,1个string类型的slice, 1个string和1个integer, 并且抛出了panic,运行这段代码可以看到这样的结果:
Listing 2
Listing 2
Panic: Want stack trace
goroutine 1 [running]:
main.Example(0x2080c3f50, 0x2, 0x4, 0x425c0, 0x5, 0xa)
/Users/bill/Spaces/Go/Projects/src/github.com/goinaction/code/
temp/main.go:9 +0x64
main.main()
/Users/bill/Spaces/Go/Projects/src/github.com/goinaction/code/
temp/main.go:5 +0x85
goroutine 2 [runnable]:
runtime.forcegchelper()
/Users/bill/go/src/runtime/proc.go:90
runtime.goexit()
/Users/bill/go/src/runtime/asm_amd64.s:2232 +0x1
goroutine 3 [runnable]:
runtime.bgsweep()
/Users/bill/go/src/runtime/mgc0.go:82
runtime.goexit()
/Users/bill/go/src/runtime/asm_amd64.s:2232 +0x1
堆栈信息中显示了在panic抛出这个时间所有的goroutines状态,发生的panic的goroutine会显示在最上面。
Listing 3
Listing 3
01 goroutine 1 [running]:
02 main.Example(0x2080c3f50, 0x2, 0x4, 0x425c0, 0x5, 0xa)
/Users/bill/Spaces/Go/Projects/src/github.com/goinaction/code/
temp/main.go:9 +0x64
03 main.main()
/Users/bill/Spaces/Go/Projects/src/github.com/goinaction/code/
temp/main.go:5 +0x85
02 main.Example(0x2080c3f50, 0x2, 0x4, 0x425c0, 0x5, 0xa)
/Users/bill/Spaces/Go/Projects/src/github.com/goinaction/code/
temp/main.go:9 +0x64
03 main.main()
/Users/bill/Spaces/Go/Projects/src/github.com/goinaction/code/
temp/main.go:5 +0x85
第1行显示最先发出panic的是goroutine 1, 第二行显示panic位于main.Example中, 并能定位到该行代码,在本例中第9行引发了panic。
下面我们关注参数是如何传递的:
Listing 4
Listing 4
// Declaration
main.Example(slice []string, str string, i int)
// Call to Example by main.
slice := make([]string, 2, 4)
Example(slice, "hello", 10)
// Stack trace
main.Example(0x2080c3f50, 0x2, 0x4, 0x425c0, 0x5, 0xa)
main.Example(slice []string, str string, i int)
// Call to Example by main.
slice := make([]string, 2, 4)
Example(slice, "hello", 10)
// Stack trace
main.Example(0x2080c3f50, 0x2, 0x4, 0x425c0, 0x5, 0xa)
这里展示了在main中带参数调用Example函数时的堆栈信息,比较就能发现两者的参数数量并不相同,Example定义了3个参数,堆栈中显示了6个参数。现在的关键问题是我们要弄清楚它们是如何匹配的。
第1个参数是string类型的slice,我们知道在Go语言中slice是引用类型,即slice变量结构会包含三个部分:指针、长度(Lengthe)、容量(Capacity)
Listing 5
Listing 5
// Slice parameter value
slice := make([]string, 2, 4)
// Slice header values
Pointer: 0x2080c3f50
Length: 0x2
Capacity: 0x4
// Declaration
main.Example(slice []string, str string, i int)
// Stack trace
main.Example(0x2080c3f50, 0x2, 0x4, 0x425c0, 0x5, 0xa)
slice := make([]string, 2, 4)
// Slice header values
Pointer: 0x2080c3f50
Length: 0x2
Capacity: 0x4
// Declaration
main.Example(slice []string, str string, i int)
// Stack trace
main.Example(0x2080c3f50, 0x2, 0x4, 0x425c0, 0x5, 0xa)
因此,前面3个参数会匹配slice, 如下图所示:
Figure 1
Figure 1
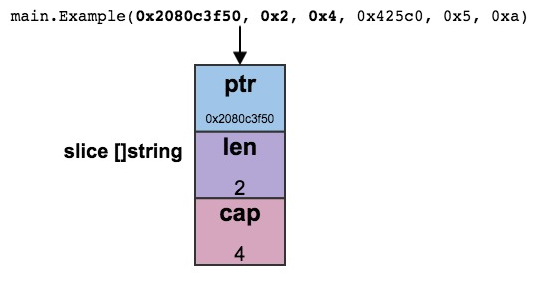
figure provided by Georgi Knox
我们现在来看第二个参数,它是string类型,string类型也是引用类型,它包括两部分:指针、长度。
Listing 6
Listing 6
// String parameter value
"hello"
// String header values
Pointer: 0x425c0
Length: 0x5
// Declaration
main.Example(slice []string, str string, i int)
// Stack trace
main.Example(0x2080c3f50, 0x2, 0x4, 0x425c0, 0x5, 0xa)
"hello"
// String header values
Pointer: 0x425c0
Length: 0x5
// Declaration
main.Example(slice []string, str string, i int)
// Stack trace
main.Example(0x2080c3f50, 0x2, 0x4, 0x425c0, 0x5, 0xa)
可以确定,堆栈信息中第4、5两个参数对应代码中的string参数,如下图所示:
Figure 2
Figure 2

figure provided by Georgi Knox
最后一个参数integer是single word值。
Listing 7
Listing 7
// Integer parameter value
10
// Integer value
Base 16: 0xa
// Declaration
main.Example(slice []string, str string, i int)
// Stack trace
main.Example(0x2080c3f50, 0x2, 0x4, 0x425c0, 0x5, 0xa)
10
// Integer value
Base 16: 0xa
// Declaration
main.Example(slice []string, str string, i int)
// Stack trace
main.Example(0x2080c3f50, 0x2, 0x4, 0x425c0, 0x5, 0xa)
现在我们可以匹配代码中的参数到堆栈信息了。
Figure 3
Figure 3
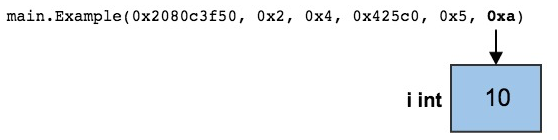
figure provided by Georgi Knox
Methods
Methods
如果我们将Example作为结构体的方法会怎么样呢?
Listing 8
Listing 8
01 package main
02
03 import "fmt"
04
05 type trace struct{}
06
07 func main() {
08 slice := make([]string, 2, 4)
09
10 var t trace
11 t.Example(slice, "hello", 10)
12 }
13
14 func (t *trace) Example(slice []string, str string, i int) {
15 fmt.Printf("Receiver Address: %p\n", t)
16 panic("Want stack trace")
17 }
02
03 import "fmt"
04
05 type trace struct{}
06
07 func main() {
08 slice := make([]string, 2, 4)
09
10 var t trace
11 t.Example(slice, "hello", 10)
12 }
13
14 func (t *trace) Example(slice []string, str string, i int) {
15 fmt.Printf("Receiver Address: %p\n", t)
16 panic("Want stack trace")
17 }
如上所示修改代码,将Example定义为trace的方法,并通过trace的实例t来调用Example。
再次运行程序,会发现堆栈信息有一点不同:
Listing 9
Listing 9
Receiver Address: 0x1553a8
panic: Want stack trace
01 goroutine 1 [running]:
02 main.(*trace).Example(0x1553a8, 0x2081b7f50, 0x2, 0x4, 0xdc1d0, 0x5, 0xa)
/Users/bill/Spaces/Go/Projects/src/github.com/goinaction/code/
temp/main.go:16 +0x116
03 main.main()
/Users/bill/Spaces/Go/Projects/src/github.com/goinaction/code/
temp/main.go:11 +0xae
首先注意第2行的方法调用使用了pointer receiver,在package名字和方法名之间多出了"*trace"字样。另外,参数列表的第1个参数标明了结构体(t)地址。我们从堆栈信息中看到了内部实现细节。
Packing
Packing
如果有多个参数可以填充到一个single word, 则这些参数值会合并打包:
Listing 10
Listing 10
01 package main
02
03 func main() {
04 Example(true, false, true, 25)
05 }
06
07 func Example(b1, b2, b3 bool, i uint8) {
08 panic("Want stack trace")
09 }
02
03 func main() {
04 Example(true, false, true, 25)
05 }
06
07 func Example(b1, b2, b3 bool, i uint8) {
08 panic("Want stack trace")
09 }
这个例子修改Example函数为4个参数:3个bool型和1个八位无符号整型。bool值也是用8个bit表示,所以在32位和64位架构下,4个参数可以合并为一个single word。
Listing 11
Listing 11
01 goroutine 1 [running]:
02 main.Example(0x19010001)
/Users/bill/Spaces/Go/Projects/src/github.com/goinaction/code/
temp/main.go:8 +0x64
03 main.main()
/Users/bill/Spaces/Go/Projects/src/github.com/goinaction/code/
temp/main.go:4 +0x32
02 main.Example(0x19010001)
/Users/bill/Spaces/Go/Projects/src/github.com/goinaction/code/
temp/main.go:8 +0x64
03 main.main()
/Users/bill/Spaces/Go/Projects/src/github.com/goinaction/code/
temp/main.go:4 +0x32
这是本例的堆栈信息,看下图的具体分析:
Listing 12
Listing 12
// Parameter values
true, false, true, 25
// Word value
Bits Binary Hex Value
00-07 0000 0001 01 true
08-15 0000 0000 00 false
16-23 0000 0001 01 true
24-31 0001 1001 19 25
// Declaration
main.Example(b1, b2, b3 bool, i uint8)
// Stack trace
main.Example(0x19010001)
true, false, true, 25
// Word value
Bits Binary Hex Value
00-07 0000 0001 01 true
08-15 0000 0000 00 false
16-23 0000 0001 01 true
24-31 0001 1001 19 25
// Declaration
main.Example(b1, b2, b3 bool, i uint8)
// Stack trace
main.Example(0x19010001)
以上展示了参数值是如何匹配到4个参数的。当我们看到堆栈信息中包括十六进制值,需要知道这些值是如何传递的。
Conclusion
The Go runtime provides a great deal of information to help us debug our programs. In this post we concentrated on stack traces. The ability to decode the values that were passed into each function throughout the call stack is huge. It has helped me more than once to identify my bug very quickly. Now that you know how to read stack traces, hopefully you can leverage this knowledge the next time a stack trace happens to you.
作者:协思
出处:http://zeeman.cnblogs.com/
QQ交流群:32972862

 浙公网安备 33010602011771号