【python画图】
2018-11-02 21:34 ZealouSnesS 阅读(332) 评论(0) 收藏 举报1、热力图
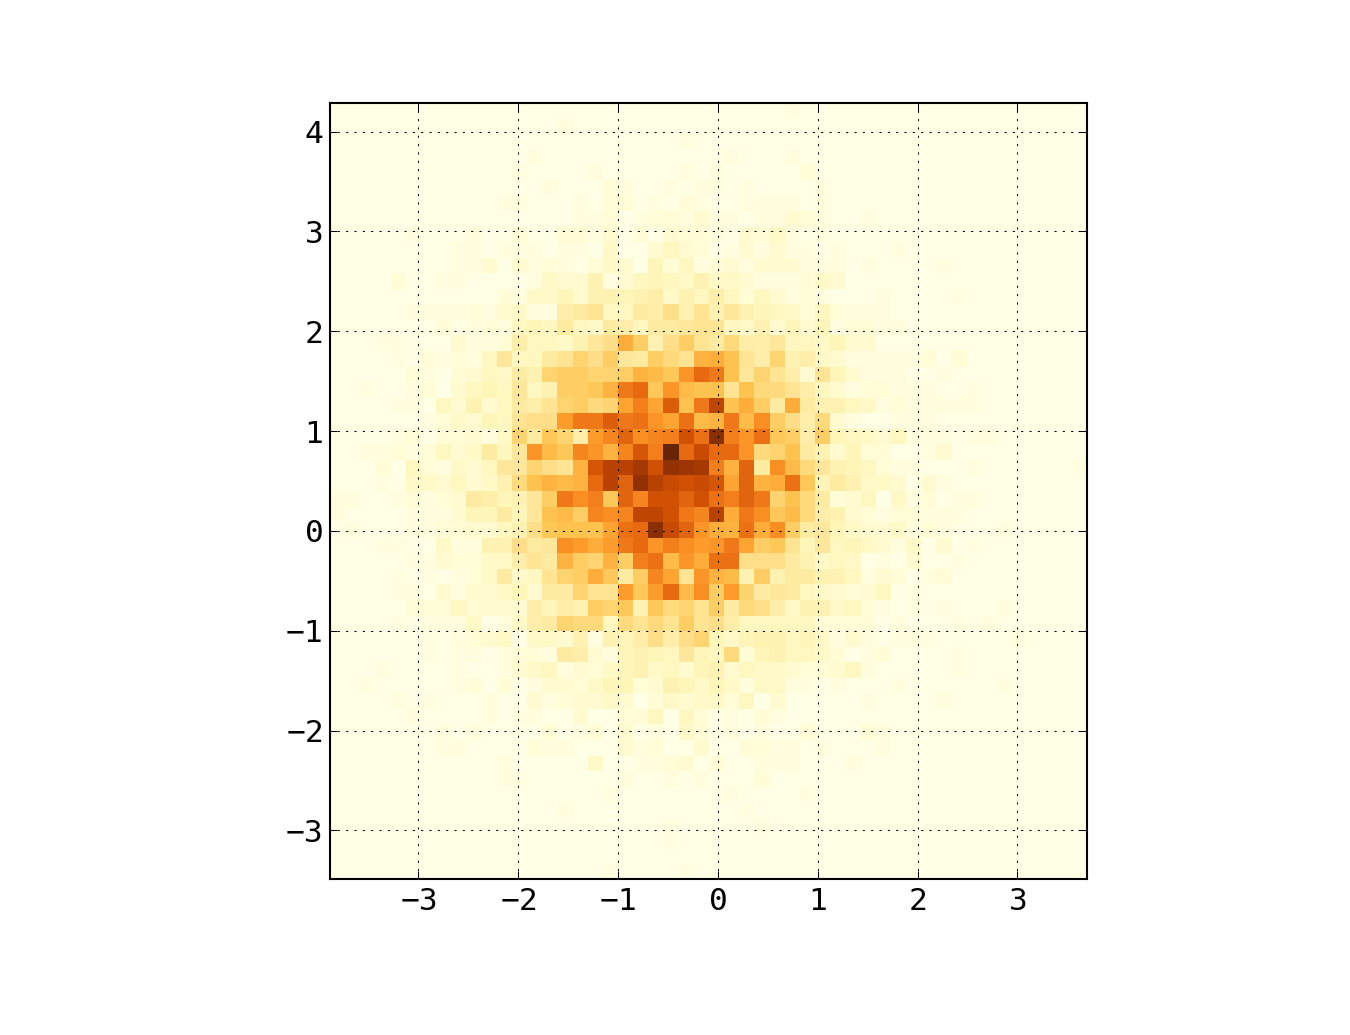
import numpy as np
import numpy.random
import matplotlib.pyplot as plt

# Generate some test data
x = np.random.randn(8873)
y = np.random.randn(8873)

heatmap, xedges, yedges = np.histogram2d(x, y, bins=50)
extent = [xedges[0], xedges[-1], yedges[0], yedges[-1]]

plt.clf()
# plt.xlabel('yaw')
# plt.ylabel('ptich')
plt.imshow(heatmap.T, extent=extent, origin='lower')
plt.show()
2、散点图
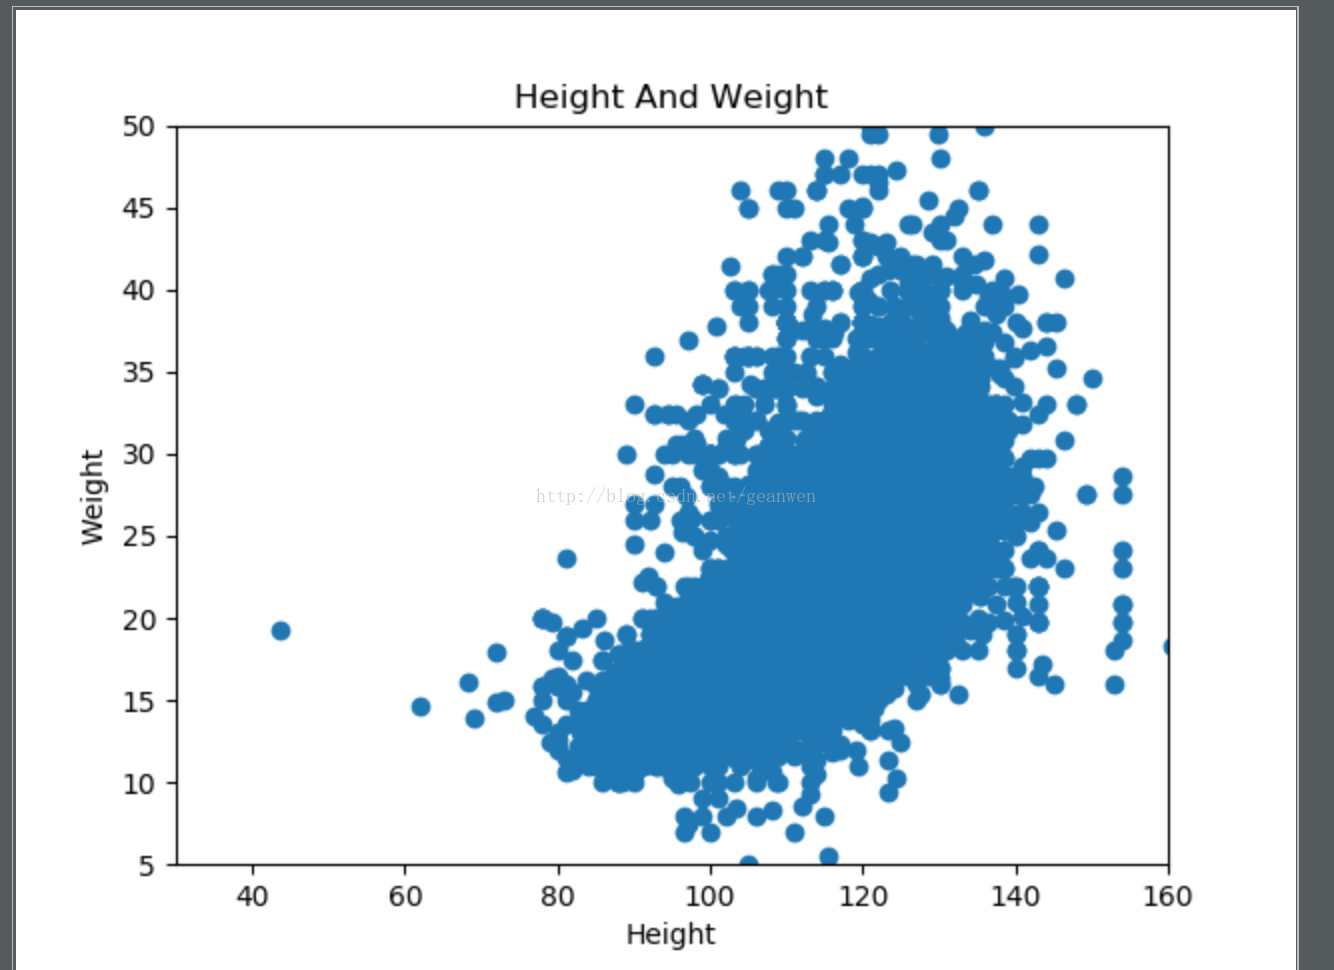
import pandas as pd
import matplotlib.pyplot as plt

def main():
    # 读取数据文件
    df = pd.read_excel("../data/RT_TestResult.xls")

    # 取出身高和体重两列数据
    height = df['Height']
    weight = df['Weight']
    plt.scatter(height, weight)
    # x,y取值范围设置
    # 可以过滤掉一部分脏数据
    plt.xlim(30, 160)
    plt.ylim(5, 50)
    plt.axis()
    # 设置title和x,y轴的label
    plt.title("Height And Weight")
    plt.xlabel("Height")
    plt.ylabel("Weight")
    # 保存图片到指定路径
    plt.savefig("../data/HeightAndWeight.png")
    # 展示图片 *必加
    plt.show()

if __name__ == '__main__':
    main()
---------------------
作者:geanwen
来源:CSDN
原文:https://blog.csdn.net/geanwen/article/details/78637705
版权声明:本文为博主原创文章,转载请附上博文链接!
3、设置坐标轴为文字
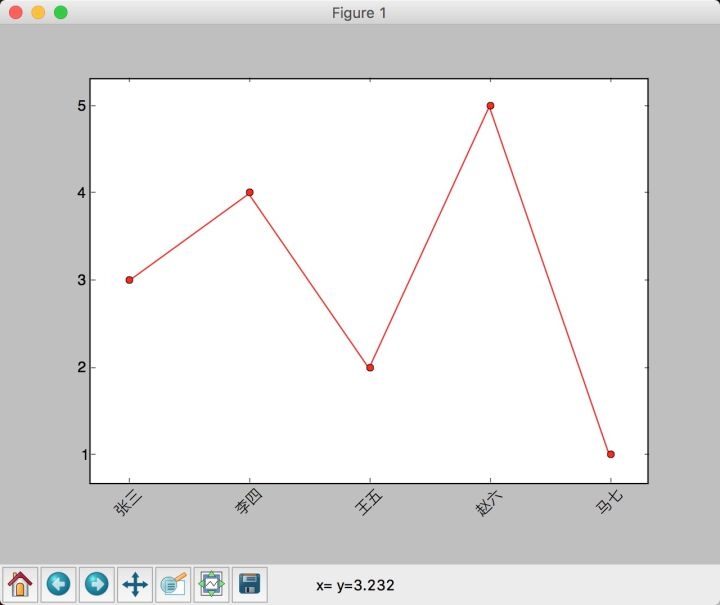
import matplotlib.pyplot as plt
names = ['张三', '李四', '王五', '赵六', '马七']
x = range(len(names))
y = [3, 4, 2, 5, 1]
plt.plot(x, y, 'ro-')
plt.xticks(x, names, rotation=45)
plt.margins(0.08)
plt.subplots_adjust(bottom=0.15)
plt.show()

作者:金天
链接:https://www.zhihu.com/question/45432463/answer/123904407
来源:知乎
著作权归作者所有。商业转载请联系作者获得授权,非商业转载请注明出处。
4、服务器上无法显示图片,不显示但保存图片
https://blog.csdn.net/rumswell/article/details/7342479
设置matplotlib.use('Agg')
import matplotlib
matplotlib.use('Agg')
import  matplotlib.pyplot as plt

plt.plot(x,rate_list,'ro-')
plt.savefig('rate.png')

 浙公网安备 33010602011771号