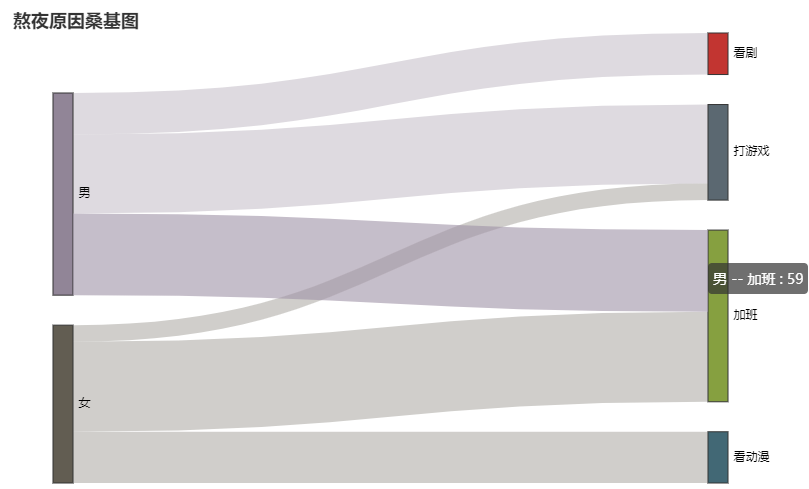
python画桑基图
桑基图
import pandas as pd
df = pd.DataFrame({
    '性别':['男','男','男', '女', '女', '女'],
    '熬夜原因':['打游戏', '加班', '看剧', '打游戏','加班', '看动漫'],
    '人数':[57,59,30,12,65,37]
})
nodes = []

for i in range(2):
    values = df.iloc[:,i].unique() # pandas.core.series.Series
#     v2 = df.iloc[:5,:] # pandas.core.frame.DataFrame
    for value in values:
        dic = {}
        dic['name'] = value
        nodes.append(dic)

links = []

for i in df.values:
    dic = {}
    dic['source'] = i[0]
    dic['target'] = i[1]
    dic['value'] = i[2]
    links.append(dic)

from pyecharts.charts import Sankey
from pyecharts import options as opts

pic = (
    Sankey(init_opts=opts.InitOpts(js_host="https://cdn.bootcss.com/echarts/4.4.0-rc.1/"))
    .add('', #图例名称
         nodes, #传入节点数据
         links, #传入边和流量数据
         linestyle_opt = opts.LineStyleOpts(opacity = 0.3, curve = 0.5, color = 'source'),
         # 标签显示位置
         label_opts = opts.LabelOpts(position = 'right'),
         # 节点之前的距离
         node_gap = 30,
        )
    .set_global_opts(title_opts = opts.TitleOpts(title = '熬夜原因桑基图'))
)

if __name__ == '__main__':
    pic.render("index.html")
效果如下图所示:


 浙公网安备 33010602011771号