Echarts绘制树形图(节点展开收起)
html界面引入<script src="https://cdn.bootcdn.net/ajax/libs/echarts/5.3.3/echarts.min.js"></script>
定义一个绘制树图的容器 <div id="chart-container" style="height: 800px;width: 100%;"></div>
js代码:
option = {
        tooltip: {   //鼠标悬停在节点效果
            trigger: 'item',
            triggerOn: 'mousemove'
        },
        series: [
            {
                // 当此节点下还有子节点时候,设置的节点样式,用于区别 没有子节点的节点的样式
                itemStyle: {
                    normal: {
                        color: '#06c',
                        borderColor: '#06c',
                    },
                    emphasis: {
                        color: '#ffffff',
                        borderColor: '#06c',
                    }
                },
                lineStyle: {   //线的样式
                    color: '#0dc6e4',
                    height:50,
                },
                type: 'tree',
                data: [datascource],  //data为树图的数据,格式:{id:111,name:xxx,children:[{id:222,name:xxx,children:[...]},...]}
                left: '2%',
                right: '2%',
                top: '8%',
                bottom: '20%',
                // symbol: 'rect',
                symbolSize:7,  //节点大小
                orient: 'vertical',
                expandAndCollapse: true,  //是否开启折叠功能
                edgeShape: 'polyline',
                label: {   //节点样式
                    fontFamily: 'KaiTi',
                    position: 'top',  //节点文字在节点的上方
                    // verticalAlign: 'middle',
                    // align: 'right',
                    overflow : 'hidden',
                    margin: [2, 4],
                    borderWidth: 1,  //文字添加边框
                    borderColor: '#FFFFFF',   //边框颜色
                    backgroundColor: '#0060fb',   //节点模块背景色
                    borderRadius: 2,   //圆角
                    padding: [5, 4],
                    rich: {
                        keywords: {
                            color: "red",
                            fontSize: 12,
                        },
                        index: {
                            fontSize: 12,
                            color: '#2979ff',
                            position: '10%'
                        },
                    },
                    textStyle:{
                        width:100,   //定义节点文字长度
                        fontSize: 18,  //文字大小
                        color: '#FFFFFF', //文字颜色
                        align:'center',  //文字的位置
                    },
                    formatter:function (value){
                        if(value.data.name.length>6){
                            value.data.name = value.data.name.substring(0,5) + '..'   //如果超出6个字符,显示5个+..
                        }
                        return value.data.name

                    }

                },
                leaves: {
                    label: {
                        position: 'top',
                        verticalAlign: 'middle',
                        // align: 'left'
                    }
                },
                animationDurationUpdate: 10  //动画过渡效果的时间,毫秒
            }
        ]
    };
    var chartDom = document.getElementById('chart-container');
    var myChart = echarts.init(chartDom);
    myChart.setOption(option);
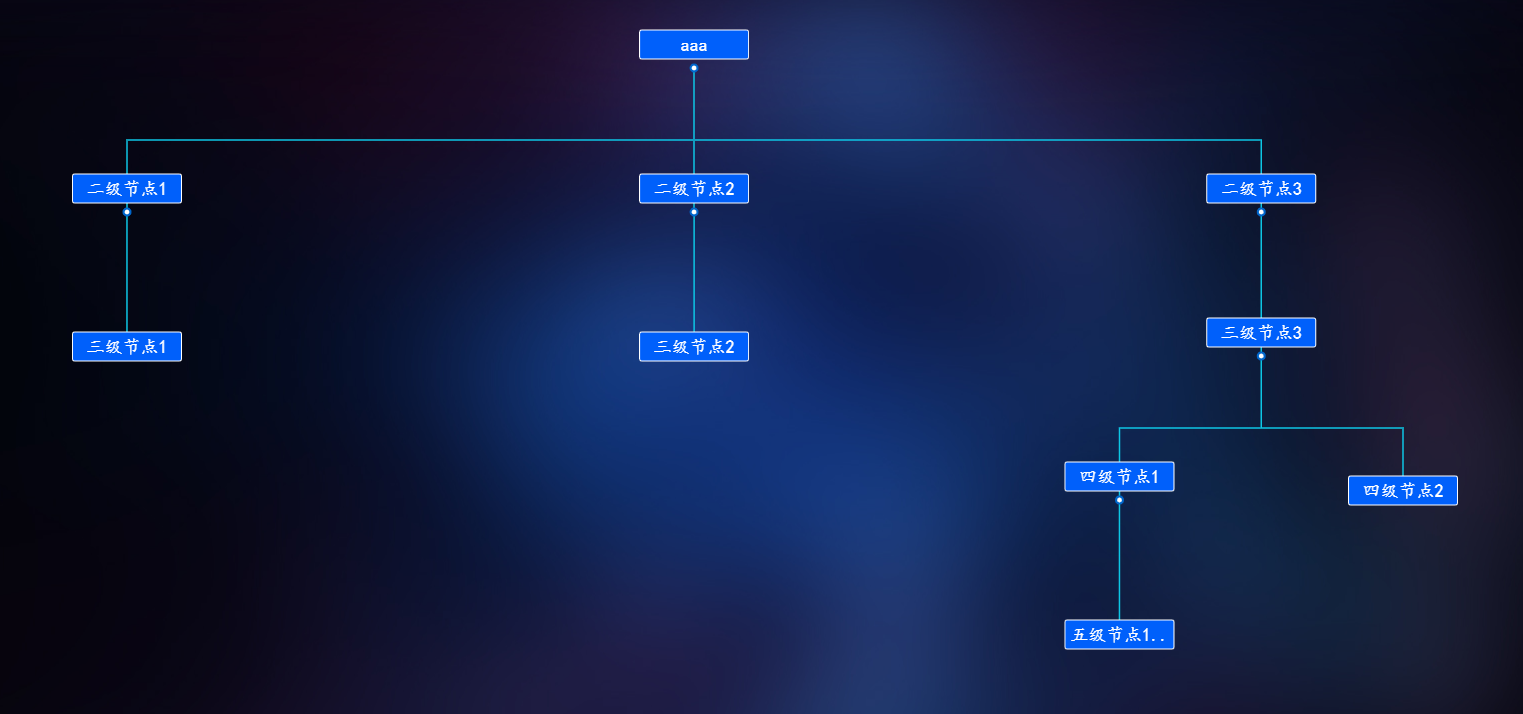
以上代码可以实现树形图的绘制啦!效果图如下:

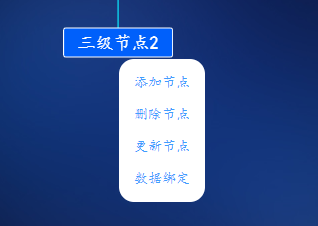
实现左键显示选择节点、右键单击出现操作菜单:(前提要有菜单控件)
js代码:
myChart.on('mousedown',function (param){
            let algorithm_name;
            let weight_name;
            node_obj = param;
            $('#floatingNode').modal('hide');  //左键隐藏菜单//已选节点赋值
            $('#selected-node').val(param.data.name);
        if (3 == param.event.which){
            $('#floatingNode').css("left", document.body.scrollLeft + event.clientX + 1);
            $('#floatingNode').css("top", document.body.scrollLeft + event.clientY + 10);
            $('#floatingNode').modal('show');  //右键显示菜单
        }

    });
//取消树图内右键的浏览器默认点击事件
$('#chart-container').bind("contextmenu",function(){
    return false;
});
// 点击树图隐藏右键打开的菜单
$('#chart-container').on('click',function(){
    $('#floatingNode').modal('hide');
});

以下为实现增删改节点,默认展开操作的分支并关闭其他分支
js代码:
//点击增删改隐藏右键菜单,并打开操作表单页 $('.control_a').unbind('click').on('click', function(){ $('#floatingNode').modal('hide'); if($(this).attr('id')=='add_btn'){ $('#node_input').html(add_row_value); $('#add_new_row').css("display","") $('#sub_new_row').css("display","none") $('#new_node').val(''); $('#modal-title').text('添加子节点'); $('#submit_btn').unbind('click').on('click', function(){ var new_node_list = ""; $('.new_node').each(function(){ if($(this).val()!=""){ new_node_list+=($(this).val()+";"); } }); $.ajax({ method: 'post', type: 'json', data: { "target_id":current_nodeID, "assess_name_list_str":new_node_list, }, url: '/assess/add_target_system_children/', success: function (result) { if(result.flag){ $.ajax({ async:false, method:'post', type:'json', data:{ "target_id":target_id, }, url:'/assess/initCharts/', success:function(result){ //获取树图数据datascource datascource=result.data; let open_node_id = []; id_and_pid_list = result.id_and_pid_list; var operation_node_id = current_nodeID; open_node_id.push(operation_node_id); open_node_ergodic(id_and_pid_list,operation_node_id,open_node_id); if (datascource.children.length!=0){ var children_list = datascource.children; node_ergodic(children_list,open_node_id); } myChart.clear(); option.series[0].data = [datascource]; myChart.setOption(option,true); }, error:function(e){ datascource=null; } }); }else { $('#message_tips').modal('show'); $('#message').text(result.data); } }, }); }); }else if ($(this).attr('id')=='alt_btn'){ $('#node_input').html(add_row_value); $('#add_new_row').css("display","none") $('#new_node').val($('.focused').text()); $('#modal-title').text('修改节点'); $('#submit_btn').unbind('click').on('click', function(){ if(target_id==current_nodeID){ alert('Please do not delete the root node directly. If you need to modify it, please process it in the build indicator function'); }else { $('#process_tips').modal('show'); $('#process_msg').text("确定将名称为("+node_obj.data.name+")的节点修改成("+$('#new_node').val()+")吗?"); $('#process_submit').unbind('click').on('click', function(){ //调用修改节点方法,参数需要该节点的target_id也就是id和要修改的名称 $.ajax({ method: 'post', type: 'json', data: { "target_id":current_nodeID, "assess_name":$('#new_node').val(), }, url: '/assess/alt_nodes_node/', success: function (result) { if(result.flag){ $.ajax({ async:false, method:'post', type:'json', data:{ "target_id":target_id, }, url:'/assess/initCharts/', success:function(result){ //获取树图数据datascource datascource=result.data; let open_node_id = []; id_and_pid_list = result.id_and_pid_list; var operation_node_id = current_nodeID; open_node_ergodic(id_and_pid_list,operation_node_id,open_node_id); if (datascource.children.length!=0){ var children_list = datascource.children; node_ergodic(children_list,open_node_id); } myChart.clear(); option.series[0].data = [datascource]; myChart.setOption(option,true); }, error:function(e){ datascource=null; } }); }else { $('#add_new_node').val(''); $('#message_tips').modal('show'); $('#message').text(result.data); } }, }); }); } }); }else if ($(this).attr('id')=='del_btn'){ if(target_id==current_nodeID){ alert('Please do not delete the root node directly. If you need to delete it, please process it in the build indicator function'); }else { $('#process_tips').modal('show'); $('#process_msg').text("确定删除名称为("+node_obj.data.name+")的节点及其子节点?"); $('#process_submit').unbind('click').on('click', function(){ //调用删除节点方法,参数需要该节点的target_id也就是id $.ajax({ method: 'post', type: 'json', data: { "target_id":current_nodeID, }, url: '/assess/delete_nodes_node/', success: function (result) { if(result.flag){ $.ajax({ async:false, method:'post', type:'json', data:{ "target_id":target_id, }, url:'/assess/initCharts/', success:function(result){ //获取树图数据datascource datascource=result.data; let open_node_id = []; var operation_node_id = 0; for (var i in id_and_pid_list){ if (current_nodeID == id_and_pid_list[i].id){ operation_node_id = id_and_pid_list[i].pid; continue; } } open_node_id.push(operation_node_id); open_node_ergodic(id_and_pid_list,operation_node_id,open_node_id); if (datascource.children.length!=0){ var children_list = datascource.children; node_ergodic(children_list,open_node_id); } myChart.clear(); option.series[0].data = [datascource]; myChart.setOption(option,true); }, error:function(e){ datascource=null; } }); }else { $('#delete_nodes').modal('hide'); $('#message_tips').modal('show'); $('#message').text(result.data); } }, }); }); } }else{ //根据主机名获取所有的原子名称 $('#host_name').change(function(){ $.ajax({ method: 'post', type: 'json', data: { "hostId":$('#host_name').val(), }, url: '/assess/get_atom_by_hostId/', success: function (result) { //获取主机列表 var atom_data = result.data; var atom_class = '<option style="background-color: #747779" value=""></option>'; for (var i = 0; i < atom_data.length; i++) { atom_class += '<option value="' + atom_data[i].itemid + '">' + atom_data[i].name + '</option>'; } $("#atom_name").html(atom_class); }, }); }); //点击确定按钮,执行数据绑定 $('#commit_btn').unbind('click').on('click', function(){ $.ajax({ method: 'post', type: 'json', data: { "host_id":$('#host_name').val(), "atom_id":$('#atom_name').val(), "selectNode_id":current_nodeID, }, url: '/assess/atomic_data_binding/', success: function (result) { if(result.flag){ $('#message_tips').modal('show'); $('#message').text(result.data); //执行原子绑定后 if(result.atom_name!=""){ $('#add_btn').css("display","none"); }else { $('#add_btn').css("display",""); } $('#bind_host_name').val(result.host_name!=""?result.host_name:"未绑定"); $('#bind_atom_name').val(result.atom_name!=""?result.atom_name:"未绑定"); } }, }); }); } });
大致思路是:执行数据库增删改节点后,再次调用查询树图数据的接口,重新渲染Echarts树形图(这里需要保留操作节点和其父节点、父节点的父节点一直到根节点的标识,这里我用一个[ ]存储)
执行树形图不同节点的展开项算法:(仅供参考)
    // 节点展开隐藏状态递归算法
    function node_ergodic(children_list,open_node_id){
        if (children_list.length > 0){
            for (var i in children_list){
                for (var j in open_node_id){
                    if (children_list[i].id == open_node_id[j]){
                        children_list[i].collapsed = false;
                        continue;
                    }
                }
                var new_children_list = children_list[i].children;
                node_ergodic(new_children_list,open_node_id)
            }
        }
    }
    // 递归得到需要展开节点的id
    function open_node_ergodic(id_and_pid_list,operation_node_id,open_node_id){
        if (id_and_pid_list.length>0){
            for(var i in id_and_pid_list){
                if(id_and_pid_list[i].id == operation_node_id){
                    operation_node_id = id_and_pid_list[i].pid;
                    if (operation_node_id == 0){
                        break;
                    }
                    open_node_id.push(operation_node_id);
                    open_node_ergodic(id_and_pid_list,operation_node_id,open_node_id);
                }
            }
        }
    }
主要说的是树形图的处理,原子数据绑定和聚合算法在这里就不提了
最后说一下途中踩到的坑。
在重新渲染树形图的时候,使用myChart.setOption有线残留的问题,查了很久网页上的解决办法只有在第二个参数上加true。
官网给出的解释是不整合之前的option数据,但是线残留并没有解决,后来在渲染前加.clear()方法得以解决。
但是导致了动画的过渡效果没有了,不能像展开收起那样看起来平滑。
就说这么多了,如果有更好的解决办法欢迎在下方留言哈,感激不尽!


 浙公网安备 33010602011771号