arcgis api for javascript 学习(五) 实现地图绘制工具
1、本文实现的功能为鼠标与地图之间的交互,能够在地图上绘制不同形状的图形
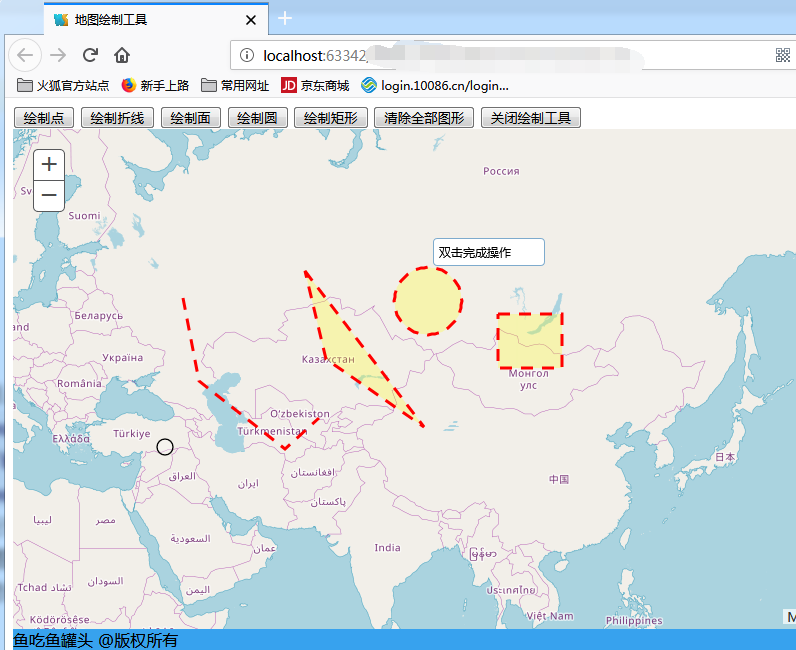
2、代码部分主要讲到的为Graphic函数的相关功能
<!DOCTYPE html>
<html>
<head>
    <title>地图绘制工具</title>
    <meta http-equiv="content-type" content="text/html;charset=utf-8">
    <meta http-equiv="Access-Control-Allow-Origin" content="*">
    <link rel="stylesheet" href="https://js.arcgis.com/3.29/esri/css/esri.css">
    <script src="https://js.arcgis.com/3.29/"></script>
    <style>
        #map{
            position:relative;
            height:400px;
            width:100%;
        }
    </style>
</head>
<body>


<div id="drawTool">
    <button id="multipoint" >绘制点</button>
    <button id="line">绘制折线</button>
    <button id="polygon">绘制面</button>
    <button id="circle">绘制圆</button>
    <button id="rectangle">绘制矩形</button>
    <button id="remove">清除全部图形</button>
    <button id="disabledraw">关闭绘制工具</button>

</div>
<div id='map'>
</div>


<div data-dojo-type="dijit/layout/ContentPane" data-dojo-props="region:'bottom'"
     style="background-color: #37a2ee">
    鱼吃鱼罐头 @版权所有
</div>


<script>
    require([
                "esri/map",
                "dojo/on",
                "esri/dijit/Basemap",
                "esri/dijit/BasemapLayer",
                "esri/symbols/SimpleMarkerSymbol",
                "esri/symbols/SimpleLineSymbol",
                "esri/symbols/SimpleFillSymbol",
                "esri/toolbars/draw",
                "esri/graphic",
                "dojo/colors",
                "dojo/domReady!"],
            function (
                    Map,
                    on,
                    Basemap,
                    BasemapLayer,
                    SimpleMarkerSymbol,
                    SimpleLineSymbol,
                    SimpleFillSymbol,
                    Draw,
                    Graphic,
                    Color) {
                var map = new Map("map", {
                    basemap: 'osm',
                    center: [122.127653, 36.009423]
                });
                //使用toolbar上的绘图工具
                var toolBar = new Draw(map);

                //创建点要素
                var pointSymbol = new SimpleMarkerSymbol(SimpleMarkerSymbol.STYLE_CIRCLE,new Color("#FFFCC"),12);
                //线要素
                lineSymbol = new SimpleLineSymbol(SimpleLineSymbol.STYLE_DASH, new Color([245, 0, 0]), 3);
                //面要素
                polygonSymbol = new SimpleFillSymbol(SimpleFillSymbol.STYLE_SOLID, lineSymbol, new Color([255, 245, 0, 0.25]));

                var drawTool = document.getElementById("drawTool");

                drawTool.onclick = function (evt) {
                    var ev = evt || window.event;
                    var target = ev.target || ev.srcElement;
                    if (target.nodeName.toLocaleLowerCase() == 'button') {
                        switch (target.id) {
                            case 'point':
                                toolBar.activate(Draw.POINT, {
                                    showTooltips: true
                                });
                                break;
                            case 'multipoint':
                                toolBar.activate(Draw.MULTI_POINT, {
                                    showTooltips: true
                                })
                                break;
                            case 'line':
                                toolBar.activate(Draw.POLYLINE, {
                                    showTooltips: true
                                })
                                break;
                            case 'polygon':
                                toolBar.activate(Draw.POLYGON, {
                                    showTooltips: true
                                })
                                break;
                            case 'circle':
                                toolBar.activate(Draw.CIRCLE, {
                                    showTooltips: true
                                })
                                break;
                            case 'rectangle':
                                toolBar.activate(Draw.RECTANGLE, {
                                    showTooltips: true
                                })
                                break;
                            case "remove":
                                map.graphics.clear();
                                break;
                            case 'disabledraw':
                                toolBar.deactivate();
                                break;
                        }
                    }
                }
                toolBar.on("draw-complete", drawEndEvent)
                function drawEndEvent(evt) {
                    //添加图形到地图
                    var symbol;
                    if (evt.geometry.type === "point" || evt.geometry.type === "multipoint") {
                        symbol = pointSymbol;
                    } else if (evt.geometry.type === "line" || evt.geometry.type === "polyline") {
                        symbol = lineSymbol;
                    }
                    else {
                        symbol = polygonSymbol;
                    }
                    map.graphics.add(new Graphic(evt.geometry, symbol))
                }
            });
</script>


</body>
</html>
3、同时代码还实现了删除图形与关闭绘制工具的功能

 浙公网安备 33010602011771号