jdk8-gc调优学习随笔2021-2-12
gc停顿时间对于系统整体的影响
Amdahl's law
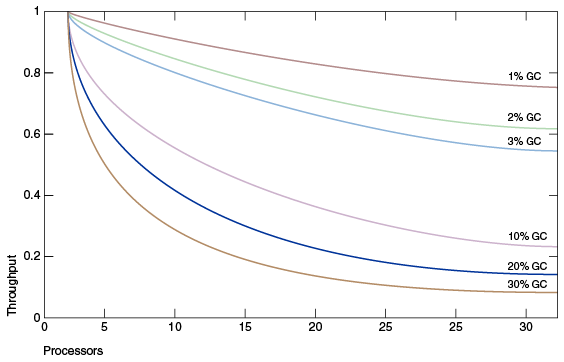
如果在一个线程中,一个java程序任务,需要处理100条数据,处理时间1分钟,有6秒钟时间用来阻塞串行gc,那么当程序使用两个核来处理的时候,有54s的时间可以减半为27秒,但是6秒的串行时间不变,因此总体时间减小为33秒。
S=1/(1-a+a/n)
a是并行部分所占比例
S=1/(1-90%+90%/2)=100/55
损失1 - 100/55 / 2= 5/55=9.09%
所以加速损失为5/200
a=70%,n=32
S=1/(1-70%+70%/32)=100/32.1875
损失1 - 100/32.1875/32=90.3%
看到并行度越高,gc对于系统的加速比性能损耗越大。
所以在小型的单核计算机上,jdk8默认采用串行gc,因为此时gc对于性能影响不高。
在大型多核计算机上,jdk8默认采用并行gc,减少串行gc对系统吞吐量的影响。
Ergonomics jdk人体工程学jvmgc调优。
1 根据机器类型和历史经验选择默认gc参数和编译器
-
Client JVM Default Initial and Maximum Heap Sizes
The default maximum heap size is half of the physical memory up to a physical memory size of 192 megabytes (MB) and otherwise one fourth of the physical memory up to a physical memory size of 1 gigabyte (GB).
For example, if your computer has 128 MB of physical memory, then the maximum heap size is 64 MB, and greater than or equal to 1 GB of physical memory results in a maximum heap size of 256 MB.
The maximum heap size is not actually used by the JVM unless your program creates enough objects to require it. A much smaller amount, called the initial heap size, is allocated during JVM initialization. This amount is at least 8 MB and otherwise 1/64th of physical memory up to a physical memory size of 1 GB.
The maximum amount of space allocated to the young generation is one third of the total heap size.
Server JVM Default Initial and Maximum Heap Sizes
The default initial and maximum heap sizes work similarly on the server JVM as it does on the client JVM, except that the default values can go higher. On 32-bit JVMs, the default maximum heap size can be up to 1 GB if there is 4 GB or more of physical memory. On 64-bit JVMs, the default maximum heap size can be up to 32 GB if there is 128 GB or more of physical memory. You can always set a higher or lower initial and maximum heap by specifying those
Table 2-1 Default Runtime Compiler
| Platform | Operating System | DefaultFoot1 | Default if Server-ClassFootref1 |
|---|---|---|---|
|
i586 |
Linux |
Client |
Server |
|
i586 |
Windows |
Client |
ClientFoot2 |
|
SPARC (64-bit) |
Solaris |
Server |
ServerFoot3 |
|
AMD (64-bit) |
Linux |
Server |
ServerFootref3 |
|
AMD (64-bit) |
Windows |
Server |
ServerFootref3 |
行为模式调优
jvm会在程序运行过程动态调整heap大小,用户可以设置两个参数,来控制jvm的heap大小调整策略。
Maximum Pause Time Goal
-XX:MaxGCPauseMillis=<nnn>
最大gc停顿时间,默认没有这个配置,因为这会导致gc更加频繁,减小系统吞吐量
Throughput Goal
-XX:GCTimeRatio=<nnn>
The ratio of garbage collection time to application time is 1 / (1 + <nnn>). For example, -XX:GCTimeRatio=19 sets a goal of 1/20th or 5% of the total time for garbage collection.
gc时间所占比例。
gc所占比例更小,系统整体吞吐量更大,所分配堆内存也更多。
Tuning Strategy
Do not choose a maximum value for the heap unless you know that you need a heap greater than the default maximum heap size. Choose a throughput goal that is sufficient for your application.
The heap will grow or shrink to a size that will support the chosen throughput goal. A change in the application's behavior can cause the heap to grow or shrink. For example, if the application starts allocating at a higher rate, the heap will grow to maintain the same throughput.
If the heap grows to its maximum size and the throughput goal is not being met, the maximum heap size is too small for the throughput goal. Set the maximum heap size to a value that is close to the total physical memory on the platform but which does not cause swapping of the application. Execute the application again. If the throughput goal is still not met, then the goal for the application time is too high for the available memory on the platform.
If the throughput goal can be met, but there are pauses that are too long, then select a maximum pause time goal. Choosing a maximum pause time goal may mean that your throughput goal will not be met, so choose values that are an acceptable compromise for the application.
It is typical that the size of the heap will oscillate as the garbage collector tries to satisfy competing goals. This is true even if the application has reached a steady state. The pressure to achieve a throughput goal (which may require a larger heap) competes with the goals for a maximum pause time and a minimum footprint (which both may require a small heap).
首先设置吞吐比例,如果吞吐比例不能满足,增大最大堆内存,如果停顿时间太长,设置最小停顿时间,最大停顿时间和吞吐率是矛盾的目标。
监控
-XX:+PrintGCDetails
[GC [DefNew: 64575K(新生代清理前)->959K(清理后)(64576K(新生代总量)), 0.0457646 secs] 196016K(堆总量清理前)->133633K(堆总量)(261184K(堆总量清理后)), 0.0459067 secs]
吞吐量通过性能测试工具测试,gc时间通过gc日志测试。
内存分配策略
首先设置总的堆内存大小,其次根据存活对象的大小,设置足够大的老年代内存区域大小,一般预留10%的冗余,然后新生代的survivor也要足够大,防止survivor内存不够导致内存直接进入老年代。
gc算法选择
-
-XX:+UseSerialGC. 串行gc -XX:+UseParallelGC 并行gc,支持大吞吐率-XX:-UseParallelOldGC 并行gc关闭fullgc的压缩功能- -XX:+UseConcMarkSweepGC 并发效果最高的gc,支持更短的STW停顿
- -XX:+UseG1GC 并发效果最高的gc,支持更短的STW停顿
parrallel gc
调优方式:
-
Maximum Garbage Collection Pause Time
-XX:MaxGCPauseMillis=<N> -
Throughput -XX:GCTimeRatio=19 - Footprint
-Xmx<N>
优先级:
pause time > throughput > foorprint
最高并发gc
Concurrent Mark Sweep (CMS) Collector: This collector is for applications that prefer shorter garbage collection pauses and can afford to share processor resources with the garbage collection.
Garbage-First Garbage Collector: This server-style collector is for multiprocessor machines with large memories. It meets garbage collection pause time goals with high probability while achieving high throughput.
这两个gc会占用更多的cpu资源,减少STW时间,但是减小的吞吐率。当cpu个数N越大时,gc对性能的影响变小。在单核机器上,CMS Incremental Mode 能够实现更小的停顿,但是这个特性在javase8弃用,以后可能会去除。
CMS concurrent mark sweep gc
应用运行时分享cpu给gc。应用有大量tenured对象,cpu有多个时能够获得收益
-XX:+UseConcMarkSweepGC
major gc时,gc线程并发地追踪可达对象,和应用并行运行。在gc开始时,和中间停顿两次,第二次时间更长。其余时间,包括大部分地活对象检测和死对象清理都是和应用线程并发运行。
minor gc 可以在major gc运行时交错运行,会STW,和parrallel minor gc 类似。
cms major gc和应用同时运行,尽量在tenured区满之前完成对象清理。
concurrent mode failure 并行gc失败,需要调整参数。
如果System.gc()显示调用或者gc需要向诊断工具提供信息,则并行中断会被报告。
Excessive GC Time and OutOfMemoryError 和parallel gc 类似
floating garbage ,并行gc执行过程中,部分对象转为不可达,导致部分垃圾对象检测失败,称为浮动垃圾。需要将老年代内存预留20%给浮动垃圾。
两次停顿,第一次,标记直接roots可达对象,包括线程栈对象,静态对象,寄存器,和通过其它内存区域可达对象例如年轻代。第二次停顿是tracing结束时,找到tracing阶段的浮动垃圾。
并行期间,gc占用cpu,应用吞吐率会降低。
并行major gc 触发:1 老年代占满时间预测和gc时间预测 2 92%老年代占用
停顿调度: 由于remark停顿和minor停顿连接在一起会加大停顿时间,所以会调度remark 停顿在两次minor 停顿之间
i-cms: 增量gc,将并发gc分段调度,在minor gc间均匀调度,在单核处理器上可以减小停顿时间。(java8 弃用)
流程:
-
Stop all application threads, identify the set of objects reachable from roots, and then resume all application threads.
-
Concurrently trace the reachable object graph, using one or more processors, while the application threads are executing.
-
Concurrently retrace sections of the object graph that were modified since the tracing in the previous step, using one processor.
-
Stop all application threads and retrace sections of the roots and object graph that may have been modified since they were last examined, and then resume all application threads.
-
Concurrently sweep up the unreachable objects to the free lists used for allocation, using one processor.
-
Concurrently resize the heap and prepare the support data structures for the next collection cycle, using one processor.
日志:
[GC [1 CMS-initial-mark: 13991K(20288K)] 14103K(22400K), 0.0023781 secs] [GC [DefNew: 2112K->64K(2112K), 0.0837052 secs] 16103K->15476K(22400K), 0.0838519 secs] ... [GC [DefNew: 2077K->63K(2112K), 0.0126205 secs] 17552K->15855K(22400K), 0.0127482 secs] [CMS-concurrent-mark: 0.267/0.374 secs] [GC [DefNew: 2111K->64K(2112K), 0.0190851 secs] 17903K->16154K(22400K), 0.0191903 secs] [CMS-concurrent-preclean: 0.044/0.064 secs] [GC [1 CMS-remark: 16090K(20288K)] 17242K(22400K), 0.0210460 secs] [GC [DefNew: 2112K->63K(2112K), 0.0716116 secs] 18177K->17382K(22400K), 0.0718204 secs] [GC [DefNew: 2111K->63K(2112K), 0.0830392 secs] 19363K->18757K(22400K), 0.0832943 secs] ... [GC [DefNew: 2111K->0K(2112K), 0.0035190 secs] 17527K->15479K(22400K), 0.0036052 secs] [CMS-concurrent-sweep: 0.291/0.662 secs] [GC [DefNew: 2048K->0K(2112K), 0.0013347 secs] 17527K->15479K(27912K), 0.0014231 secs] [CMS-concurrent-reset: 0.016/0.016 secs] [GC [DefNew: 2048K->1K(2112K), 0.0013936 secs] 17527K->15479K(27912K), 0.0014814 secs ]
major 各个阶段中间可以穿插 minor gc
CMS-initial-mark 停顿
CMS-remark 停顿
其它阶段都是和应用并行运行
g1gc
同时兼顾吞吐量和停顿时间
核心思想:将内存分为多个大小相同的region,首先进行和应用并发的全局mark不可达对象后,首先清理region内大部分是empty的region,因此可以清理出许多empty的region。根据用户指定的pausetime,选择对应个数的region进行清理。g1在清理过程中将多个region中的存活对象拷贝到单个region,相比cms和parallel gc来说,g1既满足了pause time,又对内存进行了压缩。cms没有压缩内存,pc pause time高。
g1并不能完全保证满足pause time,g1使用pause time预测模型,根据历史gc时间决定回收的region个数,所以只是很大可能满足pause time要求。
如果应用满足如下特征,那么切换g1能够获益:
超过50%的堆内存被活对象占用
对象分配率或者晋升率显著变化
应用gc停顿时间大于0.5秒
g1是长期演进的替换cms的方案。
g1对比cms,能够让用户指定pause time,所以pause time能够比cms更短
g1是逻辑上分代垃圾回收,一系列的空region被视为年轻代。region分为年轻代,老年代,年轻代region中有两个标记为survidor region,年轻代gc将对象拷贝到survidor region或者old region。H region代表分配对象体积大于region大小一半一下的region。
g1分配失败,当从一个region拷贝存活对象到空region时,如果找不到空region,那么开始STW进行full gc。
g1 floating garbage , snapshot-at-the-beginning 技术,在 concurrent marking 前存活的对象被视为在gc过程中存活,因此存在浮动垃圾。
pause 在拷贝存活对象到new region时,pause 程序,不论是年轻代还是老年代region
g1 initial-marking-pause ,在gc结束时,有一个stw,标记空的region,选择下次gc的候选old region
old gc 触发 InitiatingHeapOccupancyPercent ,默认45%
MaxGCPauseMillis 期望最大停顿时间,GCPauseIntervalMillis期望停顿发生间隔,默认0,没有限制。
minor gc当年轻代region满了后开始gc。
g1 gc,把内存分为box 区域,box被标记为年轻代,survidor代,老年代,使用card table来记录区域间引用指针,使用快照技术来进行并行的marking任务。
card table 用于把内存区域划分为512byte为一组,每组用一个byte表示该组是否有指向年轻代区域的引用,使用card table 减少minor gc mark阶段扫描的对象数量。g1使用一个单独的线程维护card table。card table在所有gc的minor gc中使用。
核心思想总结:minor gc使用card table减少扫描量,full gc 全局mark并发运行,使用region 划分区域,进行region 间copy存活对象压缩空间,只在region间拷贝存活对象时STW(minor gc 和 major gc 都会STW进行拷贝,因为拷贝过后会清理出完全empty的region),通过选择copy对象的region个数控制pause time,使用单独线程维护 card table减少minor gc pause time,使用快照技术并行mark。
思考:为什么拷贝对象到新的region会需要STW?答案:因为需要拷贝存活的对象,如果不STW那么应用可能会修改到拷贝前的对象,造成数据不一致。
g1 调优
停顿时间
| Option and Default Value | Option |
|---|---|
|
|
Sets the size of a G1 region. The value will be a power of two and can range from 1 MB to 32 MB. The goal is to have around 2048 regions based on the minimum Java heap size. |
|
|
Sets a target value for desired maximum pause time. The default value is 200 milliseconds. The specified value does not adapt to your heap size. |
|
|
Sets the percentage of the heap to use as the minimum for the young generation size. The default value is 5 percent of your Java heap.Foot1 This is an experimental flag. See How to Unlock Experimental VM Flags for an example. This setting replaces the |
|
|
Sets the percentage of the heap size to use as the maximum for young generation size. The default value is 60 percent of your Java heap.Footref1 This is an experimental flag. See How to Unlock Experimental VM Flags for an example. This setting replaces the |
|
|
Sets the value of the STW worker threads. Sets the value of If there are more than eight logical processors, sets the value of n to approximately 5/8 of the logical processors. This works in most cases except for larger SPARC systems where the value of n can be approximately 5/16 of the logical processors. |
|
|
Sets the number of parallel marking threads. Sets |
|
|
Sets the Java heap occupancy threshold that triggers a marking cycle. The default occupancy is 45 percent of the entire Java heap. |
|
|
Sets the occupancy threshold for an old region to be included in a mixed garbage collection cycle. The default occupancy is 85 percent.Footref1 This is an experimental flag. See How to Unlock Experimental VM Flags for an example. This setting replaces the |
|
|
Sets the percentage of heap that you are willing to waste. The Java HotSpot VM does not initiate the mixed garbage collection cycle when the reclaimable percentage is less than the heap waste percentage. The default is 5 percent.Footref1 |
|
|
Sets the target number of mixed garbage collections after a marking cycle to collect old regions with at most |
|
|
Sets an upper limit on the number of old regions to be collected during a mixed garbage collection cycle. The default is 10 percent of the Java heap.Footref1 |
|
|
Sets the percentage of reserve memory to keep free so as to reduce the risk of to-space overflows. The default is 10 percent. When you increase or decrease the percentage, make sure to adjust the total Java heap by the same amount.Footref1 |
-
to-space exhausted -
to-space overflow
看到这两个日志,说明gc survidor或者old区没有足够空间,不能完成并发gc。
1 增加reserved 内存和最大堆内存
2 提前开始并发marking XX:InitiatingHeapOccupancyPercent
3 加快marking 速度,ConcGCThreads
大对象问题,大对象代表体积大于region一半大小的对象,大对象会占用连续的region,如果大对象只比1 个 region大一点点,会占用两个region,造成空间浪费。而且大对象直接在old区分配,可能会造成频繁并行gc。
如果有这些问题,可以增加region size,使得大对象变成小对象。


 浙公网安备 33010602011771号