【librosa】及其在音频处理中的应用
【持续更新】
【index - librosa 0.8.0 documentation】
首先:import librosa
load
读取wav文件:
wav, sr = librosa.load(path, sr=22050, mono=True, offset=0.0, duration=None, dtype=<class 'numpy.float32'>, res_type='kaiser_best')
|
1. Load an audio file as a floating point time series. 2. Audio will be automatically resampled to the given rate (default sr=22050). 3. To preserve the native sampling rate of the file, use sr=None. |
Any codec supported by soundfile or audioread will work.
源码中,先尝试soundfile解码,不然再audioread解码。
sampling-rate-conversion
librosa.load函数可以指定采样率读取音频文件。滤波器实现???
默认重采样类别kaiser_best,表示 `resampy` python包的high-quality mode,参考:Introduction — resampy 0.2.2 documentation
resampy is a python module for efficient time-series resampling. It is based on the band-limited sinc interpolation method for sampling rate conversion.
cache
参考:librosa之cache_daisycolour_新浪博客 (sina.com.cn)
- 10:过滤器基础,独立于音频数据(dct、mel、色度、constant-q)
- 20:低级特征(cqt、stft、过零等)
- 30:高级特征(节奏、节拍、分解、重复等)
- 40:后处理(delta、stack_memory、normalize、sync)
- 默认缓存级别为 10。
display
specshow(data[, x_coords, y_coords, x_axis, …]) |
Display a spectrogram/chromagram/cqt/etc. |
waveplot(y[, sr, max_points, x_axis, …]) |
Plot the amplitude envelope of a waveform. |
cmap(data[, robust, cmap_seq, cmap_bool, …]) |
Get a default colormap from the given data. |
TimeFormatter([lag, unit]) |
A tick formatter for time axes. |
NoteFormatter([octave, major]) |
Ticker formatter for Notes |
LogHzFormatter([major]) |
Ticker formatter for logarithmic frequency |
ChromaFormatter |
A formatter for chroma axes |
TonnetzFormatter |
A formatter for tonnetz axes |
[1]中介绍了很多关于librosa的应用,同时提出librosa.display模块并不默认包含在librosa中,使用时要单独引入:
import librosa.display
waveplot
Plot the amplitude envelope of a waveform.
If y is monophonic, a filled curve is drawn between [-abs(y), abs(y)].
If y is stereo, the curve is drawn between [-abs(y[1]), abs(y[0])], so that the left and right channels are drawn above and below the axis, respectively.
Long signals (duration >= max_points) are down-sampled to at most max_sr before plotting.
librosa.display.waveplot(y, sr=22050, max_points=50000.0, x_axis='time', offset=0.0, max_sr=1000, ax=None, **kwargs)
specshow
Display a spectrogram/chromagram/cqt/etc.
librosa.display.specshow(data, x_coords=None, y_coords=None, x_axis=None, y_axis=None, sr=22050, hop_length=512, fmin=None, fmax=None, tuning=0.0, bins_per_octave=12, ax=None, **kwargs)
注意:源码中 sr 默认是22050Hz,如果音频文件是8k或者16k,一定要指定采样率。
可以选择不同的尺度显示频谱图,y_axis={‘linear’, ‘log’, ‘mel’, ‘cqt_hz’,...}
feature-extraction
参考:https://librosa.org/doc/latest/feature.html
melspectrogram
计算mel-scaled spectrogram。
librosa.feature.melspectrogram(y=None, sr=22050, S=None, n_fft=2048, hop_length=512, win_length=None, window='hann', center=True, pad_mode='reflect', power=2.0, **kwargs)
应用实例:
S = librosa.feature.melspectrogram(y=y, sr=sr, n_mels=128, fmax=8000)
与filters中的mel相关:
librosa.filters.mel(sr, n_fft, n_mels=128, fmin=0.0, fmax=None, htk=False, norm='slaney', dtype=<class 'numpy.float32'>)
stft / istft
短时傅里叶变换 / 逆短时傅里叶变换,参考librosa源码和博客[librosa语音信号处理]。
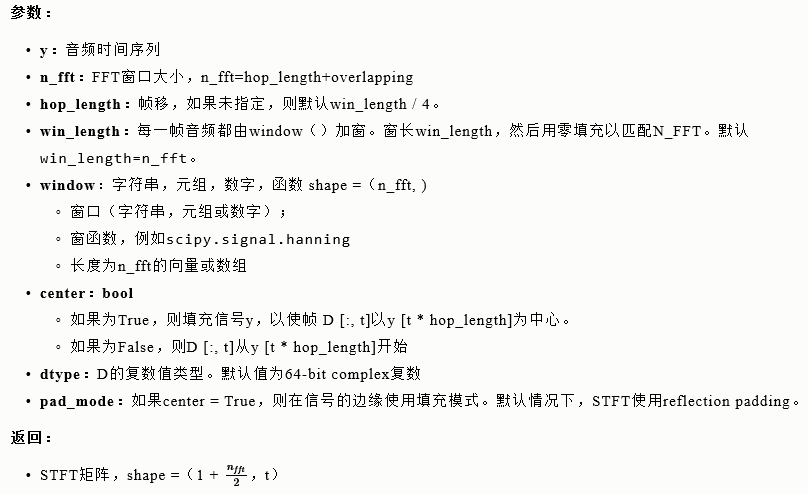
librosa.stft(y, n_fft=2048, hop_length=None, win_length=None, window='hann', center=True, pad_mode='reflect')
librosa.core.stft(y, n_fft=2048, hop_length=None, win_length=None, window='hann', center=True, dtype=<class 'numpy.complex64'>, pad_mode='reflect') # This function caches at level 20.
The STFT represents a signal in the time-frequency domain by computing discrete Fourier transforms (DFT) over short overlapping windows. This function returns a complex-valued matrix D such that
- np.abs(D[f, t]) is the magnitude of frequency bin f at frame t, and
- np.angle(D[f, t]) is the phase of frequency bin f at frame t.
| Parameters: |
|
|---|---|
| Returns: |
|
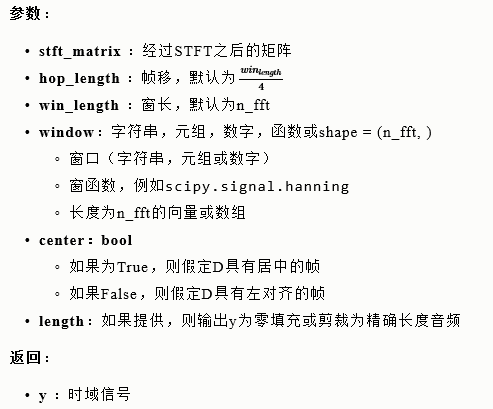
librosa.istft(stft_matrix, hop_length=None, win_length=None, window='hann', center=True, length=None)
librosa.core.istft(stft_matrix, hop_length=None, win_length=None, window='hann', center=True, dtype=<class 'numpy.float32'>, length=None) # This function caches at level 30.
Converts a complex-valued spectrogram stft_matrix to time-series y by minimizing the mean squared error between stft_matrix and STFT of y as described in [2] up to Section 2 (reconstruction from MSTFT).
In general, window function, hop length and other parameters should be same as in stft, which mostly leads to perfect reconstruction of a signal from unmodified stft_matrix.
| Parameters: |
|
|---|---|
| Returns: |
|
有用的函数
effects.split
librosa.effects.split(y, top_db=60, ref=<function amax at 0x7fa274a61d90>, frame_length=2048, hop_length=512)
Split an audio signal into non-silent intervals. 参数说明源码。
| Parameters: |
|
|---|---|
| Returns: |
|
参考
[1] 音频特征提取——librosa工具包使用 - 桂。 - 博客园 (cnblogs.com)
[2] D. W. Griffin and J. S. Lim, “Signal estimation from modified short-time Fourier transform,” IEEE Trans. ASSP, vol.32, no.2, pp.236–243, Apr. 1984.
[3] librosa语音信号处理 - 凌逆战 - 博客园 (cnblogs.com)
Load an audio file as a floating point time series.
Audio will be automatically resampled to the given rate (default sr=22050).
To preserve the native sampling rate of the file, use sr=None.

 浙公网安备 33010602011771号