

linux TOP iotop
一些特殊用法的说明文档位置 man top!!!
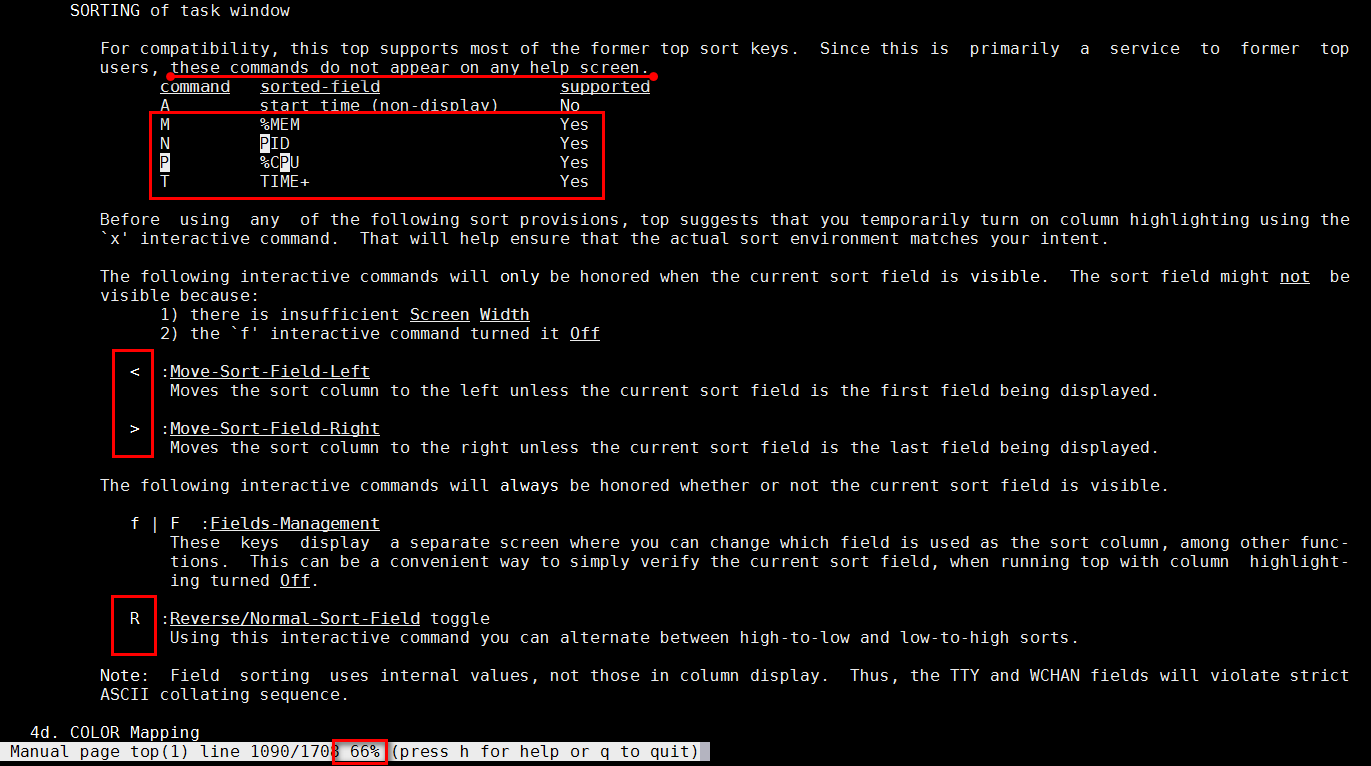
MPT排序,<>排序移动, x 切换高亮显示 b切换
Since this is primarily a service to former top users, these commands do not appear on any help screen。。。这些命令不在help中显示
top -Hp xxx
-H显示线程信息
top -u username
只显示单个用户的进程,也可以在交互模式中按u,o过滤
iotop 查看磁盘io利用情况,一般数据库会有io压力

查看进程的内存
cat /proc/$PID/status 因为top只是显示内存占用的百分比,proc这里显示的非常详细
man proc
* VmPeak: Peak virtual memory size.
* VmSize: Virtual memory size.
* VmLck: Locked memory size (see mlock(2)).
* VmPin:  Pinned  memory  size  (since Linux 3.2).  These are pages that can't be moved because something needs to directly access physical
memory.
* VmHWM: Peak resident set size ("high water mark").   历史最高占用
* VmRSS: Resident set size.  Note that the value here is the sum of RssAnon, RssFile, and RssShmem.  当前实际占用
free -hw
显示
total  Total installed memory (MemTotal and SwapTotal in /proc/meminfo)

used   Used memory (calculated as total - free - buffers - cache)

free   Unused memory (MemFree and SwapFree in /proc/meminfo) --完全未使用的内存,一般没啥参考价值

shared Memory used (mostly) by tmpfs (Shmem in /proc/meminfo)

buffers
              Memory used by kernel buffers (Buffers in /proc/meminfo)   --OS要写到disk的内存用量

cache  Memory used by the page cache and slabs (Cached and SReclaimable in /proc/meminfo) -- OS从disk读取后 cache的占用量

buff/cache
              Sum of buffers and cache --这是两者的和, 可以使用-w选项分开显示

available
              Estimation of how much memory is available for starting new applications, without swapping. Unlike the data provided by the cache  or  free
              fields, this field takes into account page cache and also that not all reclaimable memory slabs will be reclaimed due to items being in use
              (MemAvailable in /proc/meminfo, available on kernels 3.14, emulated on kernels 2.6.27+, otherwise the same as free)   打开一个全新进程预估可用的内存
@@@build beautiful things, share happiness@@@

 浙公网安备 33010602011771号