
[coordinator]
  # The time threshold when a query will be logged as a slow query.  This limit can be set to help
  # discover slow or resource intensive queries.  Setting the value to 0 disables the slow query logging.
  # 设置慢查询时间,超过多少视为慢查询.***核心更改配置****
  log-queries-after = "1ns"
[http]
  # Determines whether HTTP request logging is enabled.
 # 设置http请求的日志不打印,(线上量比较大)
  log-enabled = false
[logging]
  # Determines which level of logs will be emitted. The available levels
  # are error, warn, info, and debug. Logs that are equal to or above the
  # specified level will be emitted. error, warn, info
# 设置线上日志打印级别为警告级别.
  level = "warn"
输出日志示例:
2021-08-17T08:12:52.428499Z warn Detected slow query: SELECT * FROM gps WHERE time > now() - 5m (qid: 17, database: gps, threshold: 1ns) {"log_id": "0W0nUHMG000", "service": "query"}
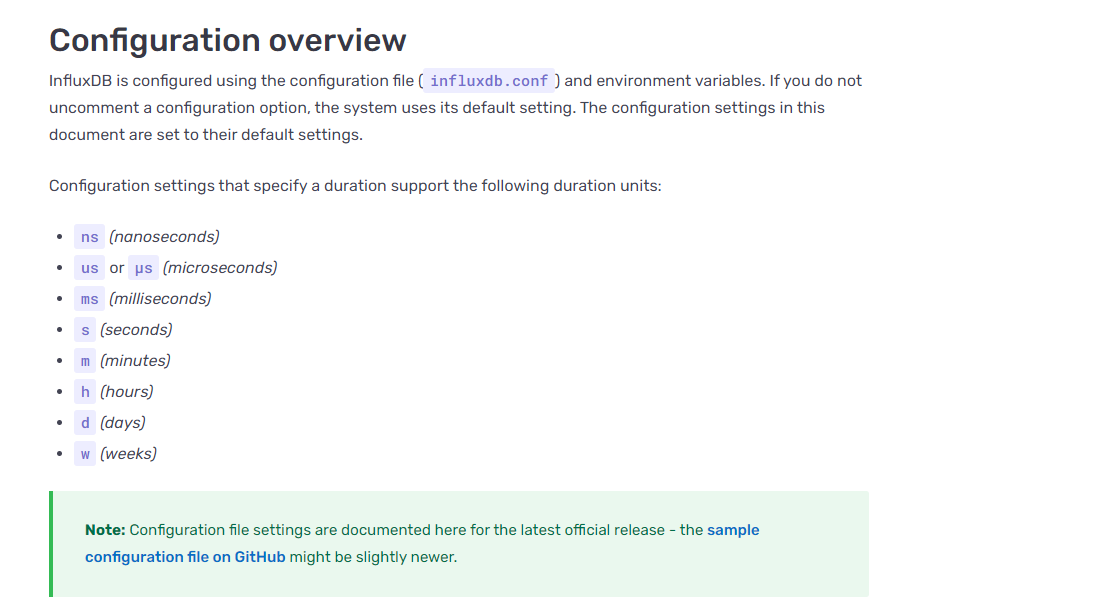
附1: 配置支持单位
线上influxdb异常,需要定位原因,所以打开了慢查询日志.
log-queries-after = "1ns"
配置成了1ns了,总该随随便便一个查询就能触发吧!
启动验证,结果没有触发.[尴尬]
查看文档

我就是双击influxd.exe执行的啊!也是相同目录咋还不生效呢?
验证发现,需要命令行(cmd)执行
influxd -config D:/software/influxdb-1.8.0-1/influxdb.conf
更改完毕,完美本地复现.

 浙公网安备 33010602011771号