一、选题背景
交通对于一个城市而言是不可忽视的事情,在科技日益发达的当今世界,也随着智慧交通的普及,交通的数据清晰,我们的生活也趋于更加便利的环境,但其上面的数据并不是很直观。因此,我做了一个对于智慧交通网站上,数据爬取并进行数据分析及可视化,来让数据更加直观明了。
二、主题式网络爬虫设计方案
1.网络爬虫名称
爬取百度地图智慧交通的泉州拥堵指数内容
2.网页网址
http://jiaotong.baidu.com/top/report/?citycode=134
3.主题页面的结构特征分析
数据源代码
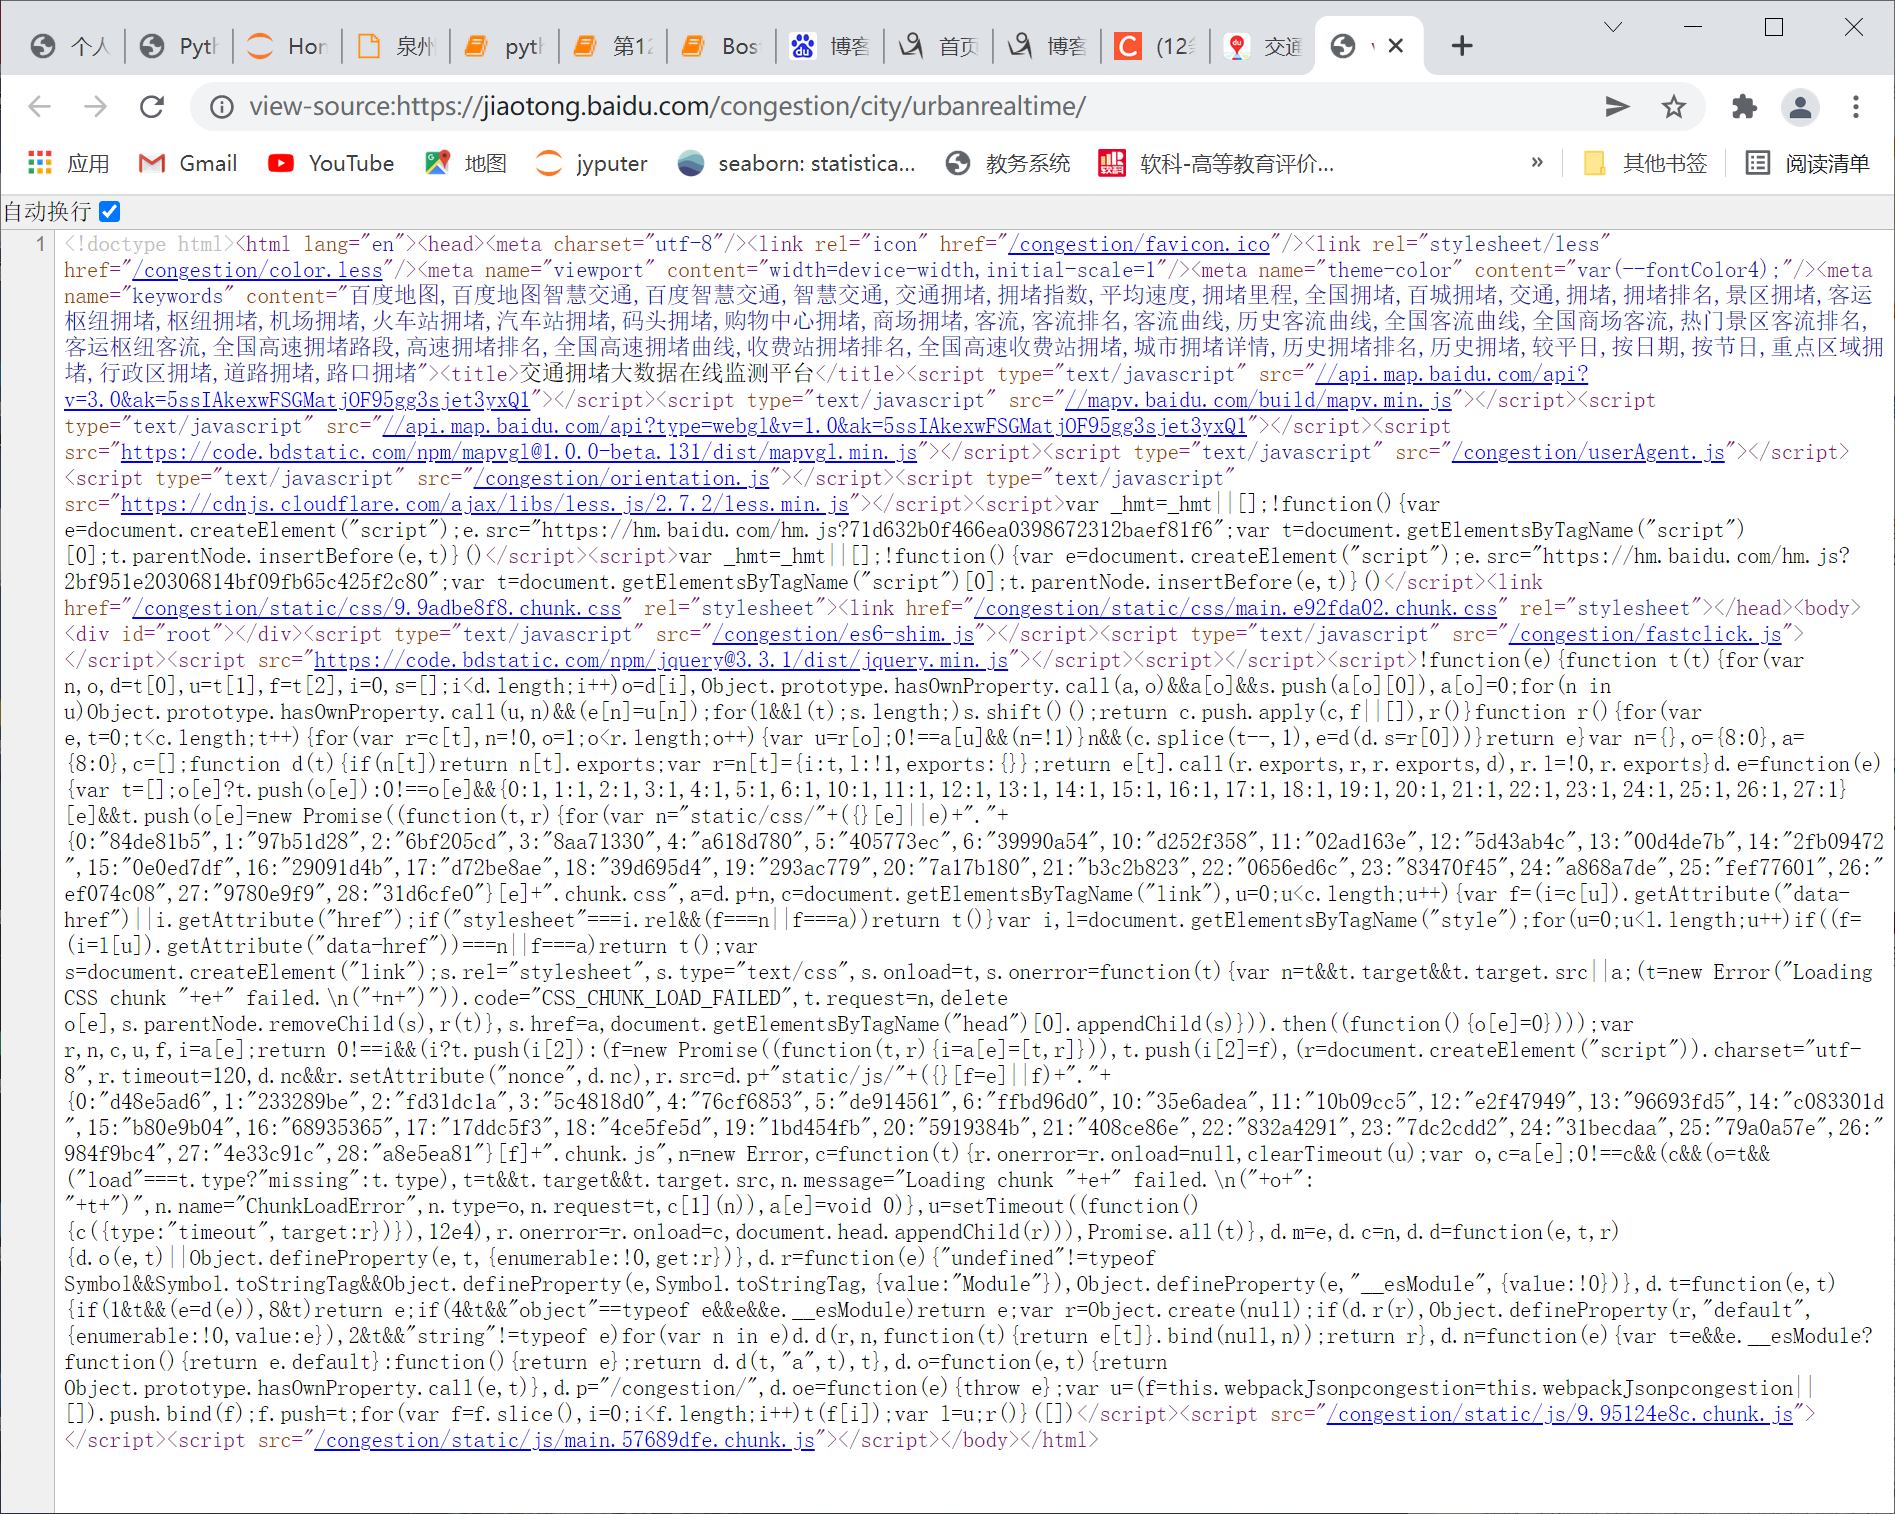
发现 在body标签里没有div的内容,只有script标签内容。但是用鼠标右键,检查元素(F12)中是可以看到内容的,我想到了用Python中selenium的解析库来做。
并且发现页面中有些数据不是文字格式,而是通过数据可视化形成的绘图对象,如图:

在网上查阅了大量资料后且求助了老师,得知在网页源码里体现不到的数据,一般是通过json文件发送的。
右键检查元素(F12)找到Network,左侧的Name栏是页面发送的相关请求,右侧有Headers、Preview、Response等属性,我们单击Preview会出现一些json数据,经过对比我发现正是我在源码里获取不到的绘图对象的数据。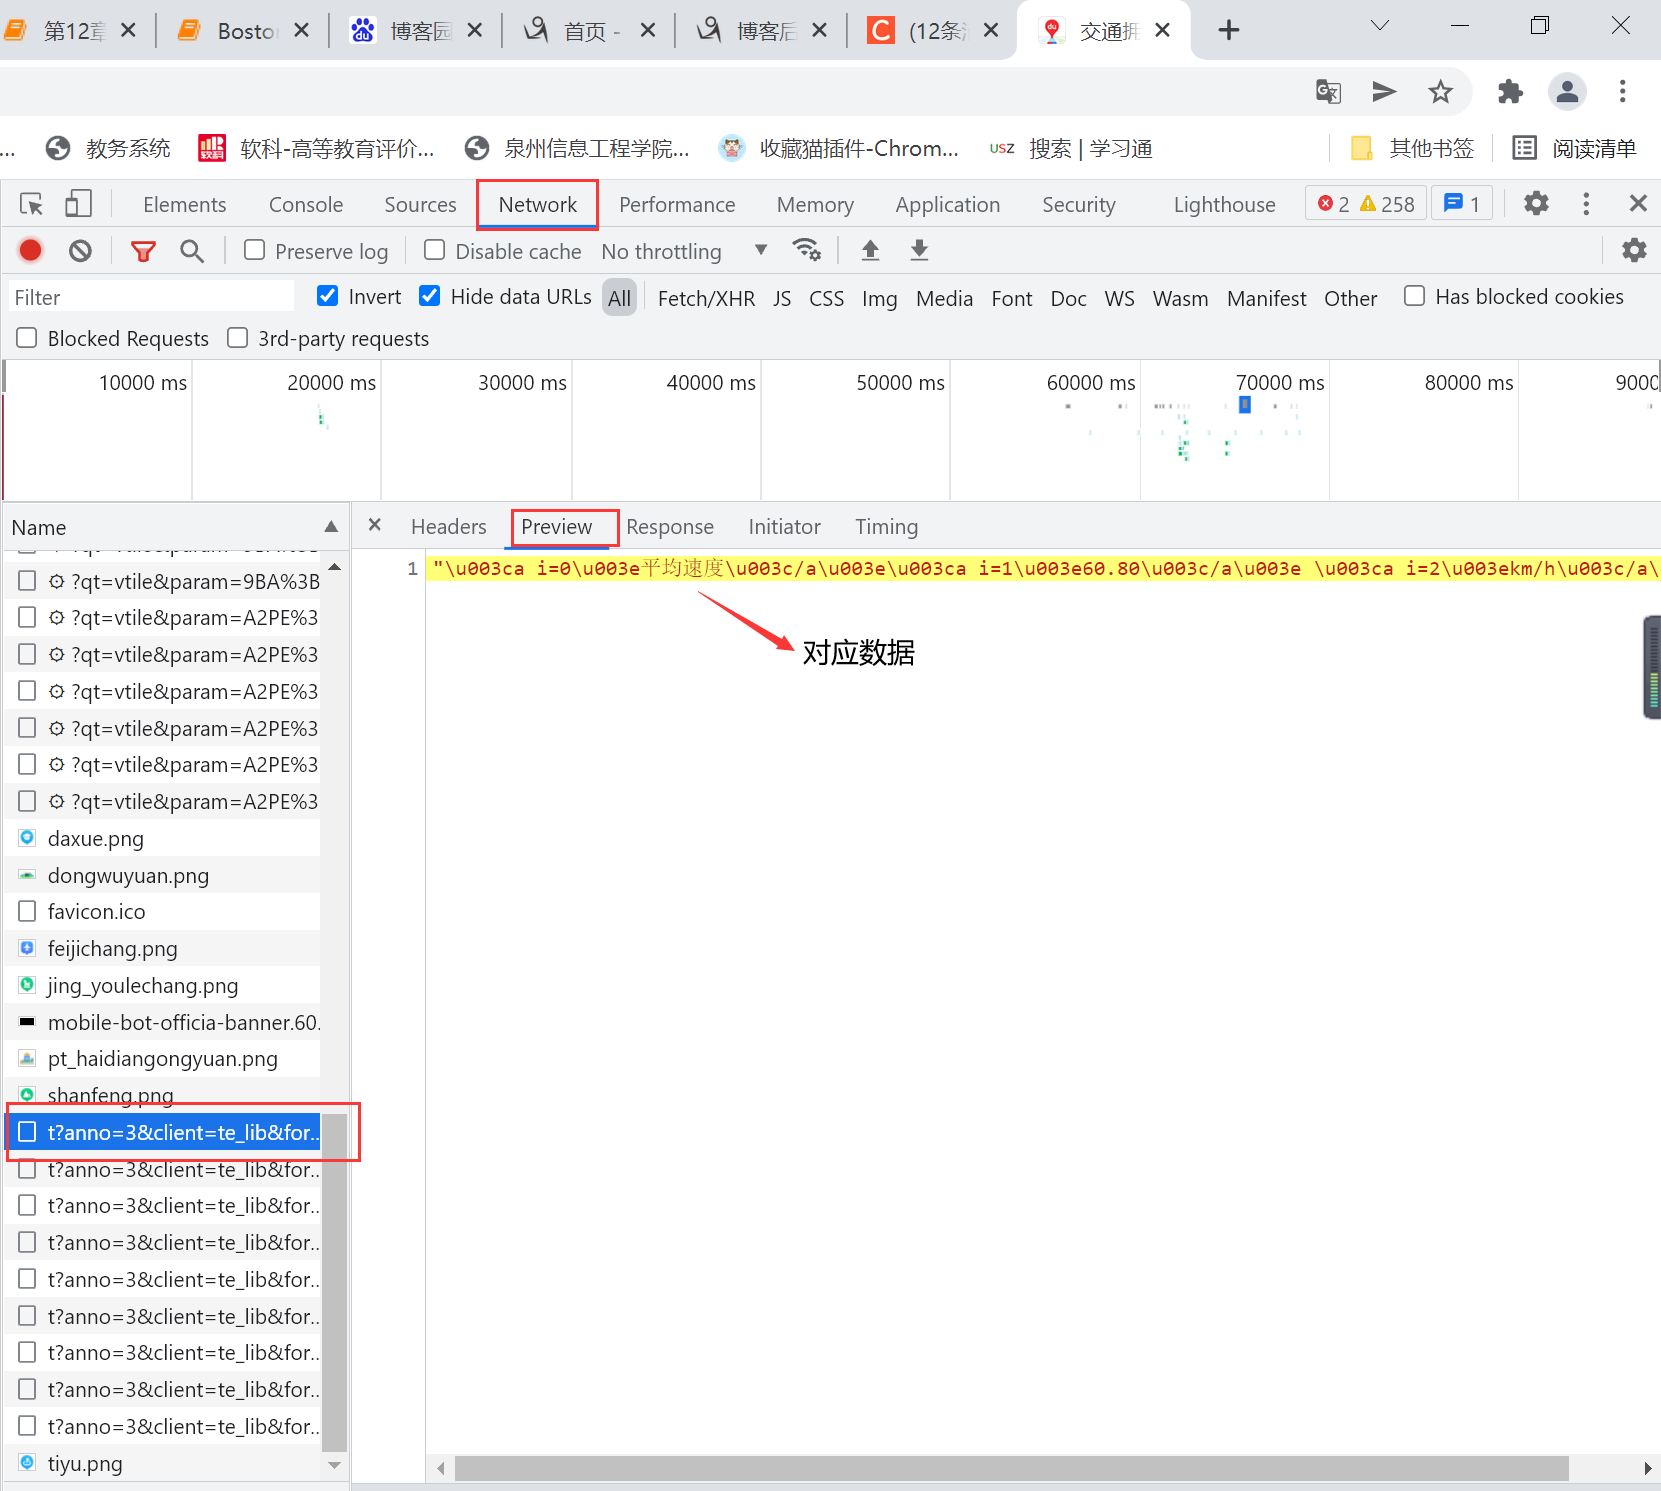
点击对应请求的Headers,我们可以看到页面请求的地址Request URL,进行爬取数据
这个Request URL就是我们要爬取的目标链接,这个地址里的json数据对应的是“实时拥堵指数”的数据,对于其他的数据,我们一一寻找即可。
三、数据爬取程序设计
1.导入要使用的库
源码:
1 #导入要使用的库
2 import requests
3 import re
4 import json
2.获取页面
源码:
1 def get_page(url):
2     try:
3         response = requests.get(url)
4         if response.content:  # 返回成功
5             return response
6     except requests.ConnectionError as e:
7         print('url出错', e.args)
尝试运行一下程序,将get_page(url)的返回值转为文本格式,输出get_page(url)的返回值和返回值类型。
源码:
1 #将get_page(url)的返回值转为文本格式
2 url = 'https://jiaotong.baidu.com/trafficindex/city/details?cityCode=134&callback=jsonp_1570959868686_520859'
3 print(type(get_page(url)))
4 print(get_page(url).text)
运行结果

3.解析页面
获取到文本格式的页面信息后,我们要对页面进行解析,和解析网页源码类似,我们要找一下,获取到的页面信息有哪些是我们需要的。
源码:
1 #将get_page(url)的返回值转为文本格式
2 url = 'https://jiaotong.baidu.com/trafficindex/city/details?cityCode=134&callback=jsonp_1570959868686_520859'
3 print(type(get_page(url)))
4 print(get_page(url).text)
在数据中发现,json格式的数据类似与Python中的字典:{key : value},显然返回的页面文本有一些其他数据,我们要对这些数据进行一下筛选,找出我们需要的那一部分。
源码:
1 # 获取实时拥堵指数内容
2 def get_detail(page):
3     transformData = json.loads(re.findall(r'[(](.*?)[)]', page.text)[0])
4     detail = transformData['data']['detail']
5     print('实时拥堵指数数据:')
6     for i in detail:
7         print(str(i)+':'+str(detail[i]))
这样即可获取页面返回文本中括号里的内容,这里用到了re.findall()函数,re.findall(pattern,string)可以将传入的字符串以列表的形式返回,因此,这里取re.findall(pattern, page.text)[0](返回只有一串json文本,只取列表中的第一个即可)。用json.loads()读取处理过的数据,加载成Python中的字典格式。
运行衬程序结果展示

页面中获取不到的实时交通指数数据,已经被我们成功获取到了,再将获取到的数据写入txt文件中即可。
设计一个txt的生成程序,储存数据
源码:
 1 import requests
 2 import re
 3 import json
 4
 5 def get_page(url):
 6     try:
 7         response = requests.get(url)
 8         if response.content:  # 返回成功
 9             return response
10     except requests.ConnectionError as e:
11         print('url出错', e.args)
12
13 def write_to_file(content):
14     with open('泉州市交通情况数据爬取.txt', 'a', encoding='utf-8') as f:
15         f.write(json.dumps(content, ensure_ascii=False)+'\n')
16         # f.close()
4.在此基础上,用同样的方法我还爬取了实时拥堵指数变化内容、实时道路拥堵指数、实时拥堵里程、昨日早晚高峰内容、全部道路拥堵情况
(1)实时拥堵指数变化情况
源码:
 1 # 获取实时拥堵指数变化内容
 2 def get_curve(page):
 3     transformData = json.loads(re.findall(r'[(](.*?)[)]', page.text)[0])
 4     curve_detail = transformData['data']['list']
 5     k = 0
 6     for roadrank_list in curve_detail:
 7         print('---------------分割线---------------')
 8         print(k)
 9         write_to_file(str(k)+str(roadrank_list))
10         k += 1
11         print(roadrank_list)
12 url_curve = 'https://jiaotong.baidu.com/trafficindex/city/curve?cityCode=134&type=minute&callback=jsonp_1571018819971_8078256'
13 # 获取实时拥堵指数变化内容
14 print('获取实时拥堵指数变化内容')
15 write_to_file('获取实时拥堵指数变化内容')
16 get_curve(get_page(url_curve))
运行程序结果展示
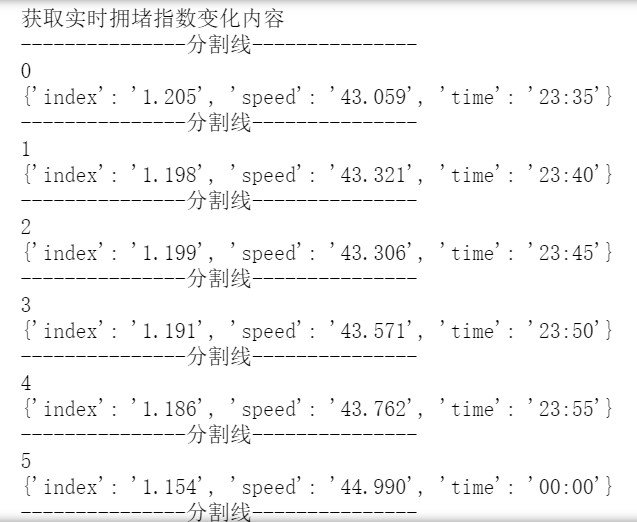
(2)获取实时道路拥堵数据内容
源码:
 1 # 获取实时道路拥堵指数内容
 2 def get_road(page):
 3     transformData = json.loads(re.findall(r'[(](.*?)[)]', page.text)[0])
 4     detail = transformData['data']['detail']
 5     for i in detail:
 6         write_to_file(str(i)+':'+str(detail[i]))
 7         print(str(i)+':'+str(detail[i]))
 8 url_road = 'https://jiaotong.baidu.com/trafficindex/city/road?cityCode=134&callback=jsonp_1571014746541_9598712'
 9 # 获取实时道路拥堵指数内容
10 print('获取实时道路拥堵指数内容')
11 write_to_file('获取实时道路拥堵指数内容')
12 get_road(get_page(url_road))
程序运行结果展示

(3)获取实时拥堵里程内容
源码:
 1 # 获取实时拥堵里程内容
 2 def get_congestmile(page):
 3     transformData = json.loads(re.findall(r'[(](.*?)[)]', page.text)[0])
 4     congest = transformData['data']['congest']
 5     for i in congest:
 6         write_to_file(str(i)+':'+str(congest[i]))
 7         print(str(i)+':'+str(congest[i]))
 8
 9 url_congestmile = 'https://jiaotong.baidu.com/trafficindex/city/congestmile?cityCode=134&callback=jsonp_1571014746542_5952586'
10
11 # 获取实时拥堵里程内容
12 print('获取实时拥堵里程内容')
13 write_to_file('获取实时拥堵里程内容')
14 get_congestmile(get_page(url_congestmile))
程序运行结果展示
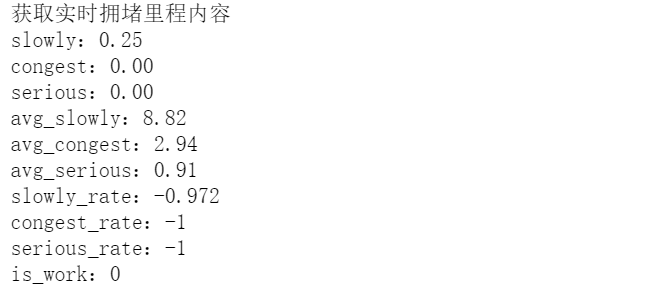
(4)获取早晚峰内容
源码:
 1 # 获取昨日早晚高峰内容
 2 def get_peakCongest(page):
 3     transformData = json.loads(re.findall(r'[(](.*?)[)]', page.text)[0])
 4     peak_detail = transformData['data']['peak_detail']
 5     for i in peak_detail:
 6         write_to_file(str(i)+':'+str(peak_detail[i]))
 7         print(str(i)+':'+str(peak_detail[i]))
 8 url_peakCongest = 'https://jiaotong.baidu.com/trafficindex/city/peakCongest?cityCode=134&callback=jsonp_1571014746543_3489265'
 9 # 获取昨日早晚高峰内容
10 print('获取昨日早晚高峰内容')
11 write_to_file('获取昨日早晚高峰内容')
12 get_peakCongest(get_page(url_peakCongest))
程序运行结果展示

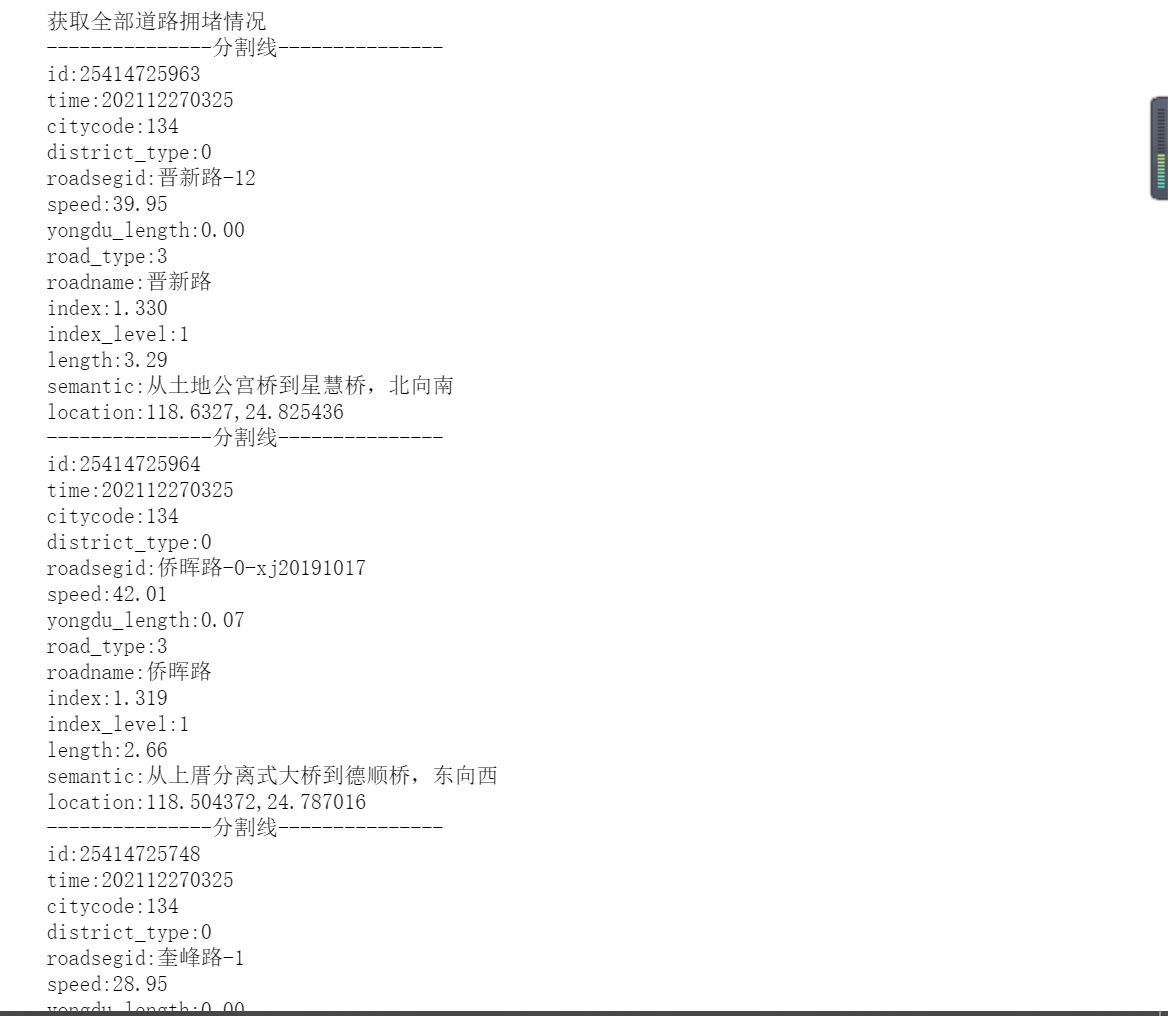
(5)获取全道路拥堵情况
源码:
 1 # 获取全部道路拥堵情况
 2 def get_roadrank(page):
 3     transformData = json.loads(re.findall(r'[(](.*?)[)]', page.text)[0])
 4     roadrank_detail = transformData['data']['list']
 5     for roadrank_list in roadrank_detail:
 6         write_to_file('---------------分割线---------------')
 7         print('---------------分割线---------------')
 8         for element in roadrank_list:
 9             if str(element) != 'links' and str(element) != 'nameadd':
10                 write_to_file(str(element)+':'+str(roadrank_list[element]))
11                 print(str(element)+':'+str(roadrank_list[element]))
12 url_roadrank = 'https://jiaotong.baidu.com/trafficindex/city/roadrank?cityCode=134&roadtype=0&callback=jsonp_1571016737139_1914397'
13 # 获取全部道路拥堵情况
14 print('获取全部道路拥堵情况')
15 write_to_file('获取全部道路拥堵情况')
16 get_roadrank(get_page(url_roadrank))
程序运行结果展示
四、数据分析及可视化
在爬取完数据之后,选取了实时拥堵指数数据为主体展开分析
1.首先将有用实时拥堵指数数据进行整合,提取有用数据
源码:
 1 #将实时拥堵指数变化内容里的有用数据导出
 2 from bs4 import BeautifulSoup
 3 import urllib.request
 4 import re
 5
 6 html_doc = "https://jiaotong.baidu.com/trafficindex/city/curve?cityCode=134&type=minute&callback=jsonp_1571018819971_8078256"
 7 req = urllib.request.Request(html_doc)
 8 webpage = urllib.request.urlopen(req)
 9 html = webpage.read()
10 html=html.decode('utf-8')
11 transformData = json.loads(re.findall(r'[(](.*?)[)]',html)[0])
12 curve_detail = transformData['data']['list']
13 print(curve_detail)
将index、speed、time,三样数据导出

2.将三样数据导成csv文件,方便之后数据可视化和数据分析中使用
源码:
 1 #将实时拥堵指数变化内容的有用数据转化为csv文件
 2 import pandas as pd
 3
 4 # 下面这行代码运行报错
 5 # list.to_csv('e:/testcsv.csv',encoding='utf-8')
 6 name=['index','speed','time']
 7 test=pd.DataFrame(columns=name,data=curve_detail)#数据有三列,列名分别为one,two,three
 8 print(test)
 9 test.to_csv('泉州实时拥堵指数变化内容.csv',encoding='gbk')
10 #试运行导出前五行数据
11 df = pd.read_csv('泉州实时拥堵指数变化内容.csv',encoding='gbk')
12 df.head()
生成csv文件

3.数据分析,将csv文件中的index列的数据进行读取,并转换格式,截取前30个数据进行分析
源码:
 1 #导入csv模块
 2 import csv
 3
 4 #指定文件名,然后使用 with open() as 打开
 5 filename = '泉州实时拥堵指数变化内容.csv'
 6 #导出头文件
 7 with open(filename) as f:
 8     #创建一个阅读器:将f传给csv.reader
 9     reader = csv.reader(f)
10
11     #使用csv的next函数,将reader传给next,将返回文件的下一行
12     header_row = next(reader)
13
14     for index, column_header in enumerate(header_row):
15          print(index, column_header)
16      #读取拥堵指数
17      #创建最高拥堵指数的列表
18     indexs =[]
19     #遍历reader的余下的所有行(next读取了第一行,reader每次读取后将返回下一行)
20     for row in reader:
21         indexs.append(row[1])
22     #f分析前30个拥堵指数
23     indexs = indexs[:30]
24     print(indexs)
25     index = float(row[1])
26     indexs.append(index)
27
程序运行结果展示

4.采取相同的方法,将time列的数据取出,截取前30个数据,并将time和index两者绘制折线图,分析数据之间的关系
源码:
 1 import csv
 2 import matplotlib.pyplot as plt
 3 from datetime import datetime
 4
 5 filename = '泉州实时拥堵指数变化内容.csv'
 6 with open(filename,'r') as f:
 7     reader = csv.reader(f)      # 生成阅读器,f对象传入
 8     header_row = next(reader)   # 查看文件第一行,reader是可迭代对象
 9
10     dates,indexs = [],[]
11     for row in reader:
12         #current_date = datetime.strptime(row[3])
13         dates.append(row[3])
14         #high = int(row[1])
15         indexs.append(row[1])
16     print(dates)
17     indexs = indexs[:30]
18     index = float(row[1])
19     indexs.append(index)
20     dates=dates[:30]
21     date=row[3]
22     dates.append(date)
23
24     # 设置图片大小
25     fig = plt.figure(dpi=128,figsize=(10,6))
26     plt.plot(dates,indexs, c='red',linewidth=1)        # linewidth决定绘制线条的粗细
27
28     # 设置图片格式
29     plt.title('实时拥堵指数折线图', fontsize=13)  # 标题
30     plt.xlabel('时间', fontsize=14)
31     fig.autofmt_xdate()             # 日期标签转为斜体
32     plt.ylabel('拥堵指数', fontsize=14)
33     plt.tick_params(axis='both',which='major')
34     plt.rcParams['font.sans-serif']=['Microsoft YaHei']#显示中文
35     plt.show()  # 输出图像
折线图

从图像可以看出,拥堵指数大致是增长的趋势,但指数的变化都在分毫之间,也有存在着下降的趋势,说明在夜深的时候,整体变化趋势不大,但是在时间段上还是有区别的。
5.继续分析index和time之间的关系,绘制散点图
源码:
 1 import csv
 2 import matplotlib.pyplot as plt
 3 from datetime import datetime
 4
 5 filename = '泉州实时拥堵指数变化内容.csv'
 6 with open(filename,'r') as f:
 7     reader = csv.reader(f)      # 生成阅读器,f对象传入
 8     header_row = next(reader)   # 查看文件第一行,reader是可迭代对象
 9
10     indexs = []
11     for row in reader:
12         indexs.append(row[1])
13     indexs = indexs[:30]
14     index = str(row[1])
15     indexs.append(index)
16
17
18 import matplotlib.pyplot as plt
19 # 设置圆点大小
20 size =  5
21 # 绘制散点图
22
23 fig = plt.figure(dpi=128,figsize=(10,6))
24 plt.scatter(dates,indexs, size, color="r")
25 plt.xlabel("时间")
26 fig.autofmt_xdate()             # 日期标签转为斜体
27 plt.ylabel("拥堵指数")
28 plt.title("实时拥堵指数散点图")
29 plt.show()
散点图
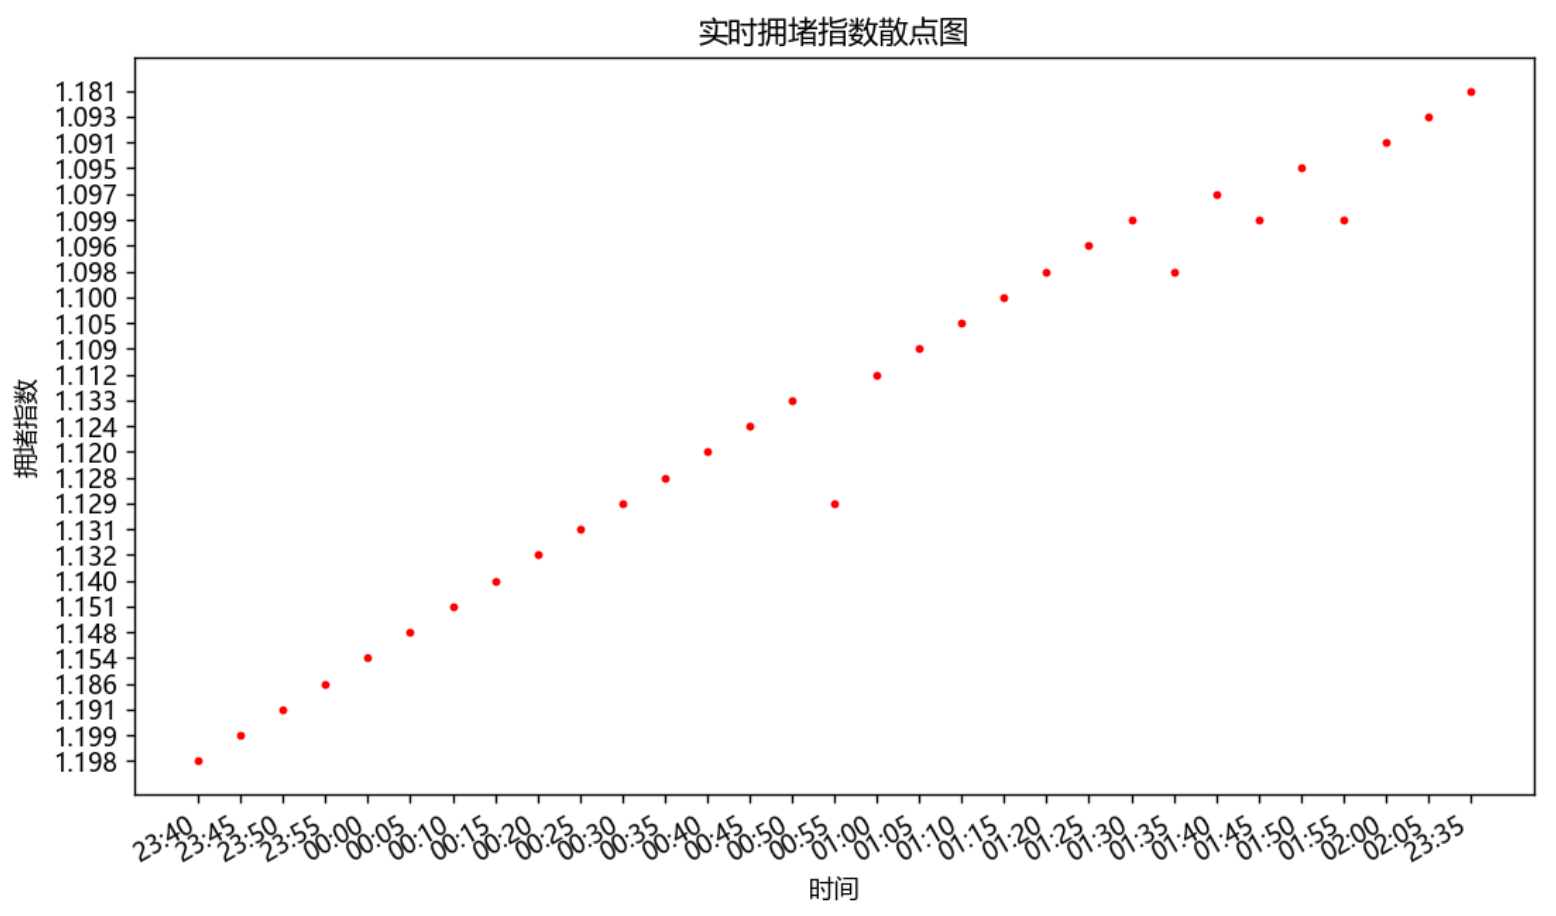
通过散点图和折线图可知,指数在1.095居多,且在2点上,指数比其他时间段的都来得小可以得知,在这段时间交通是顺畅的
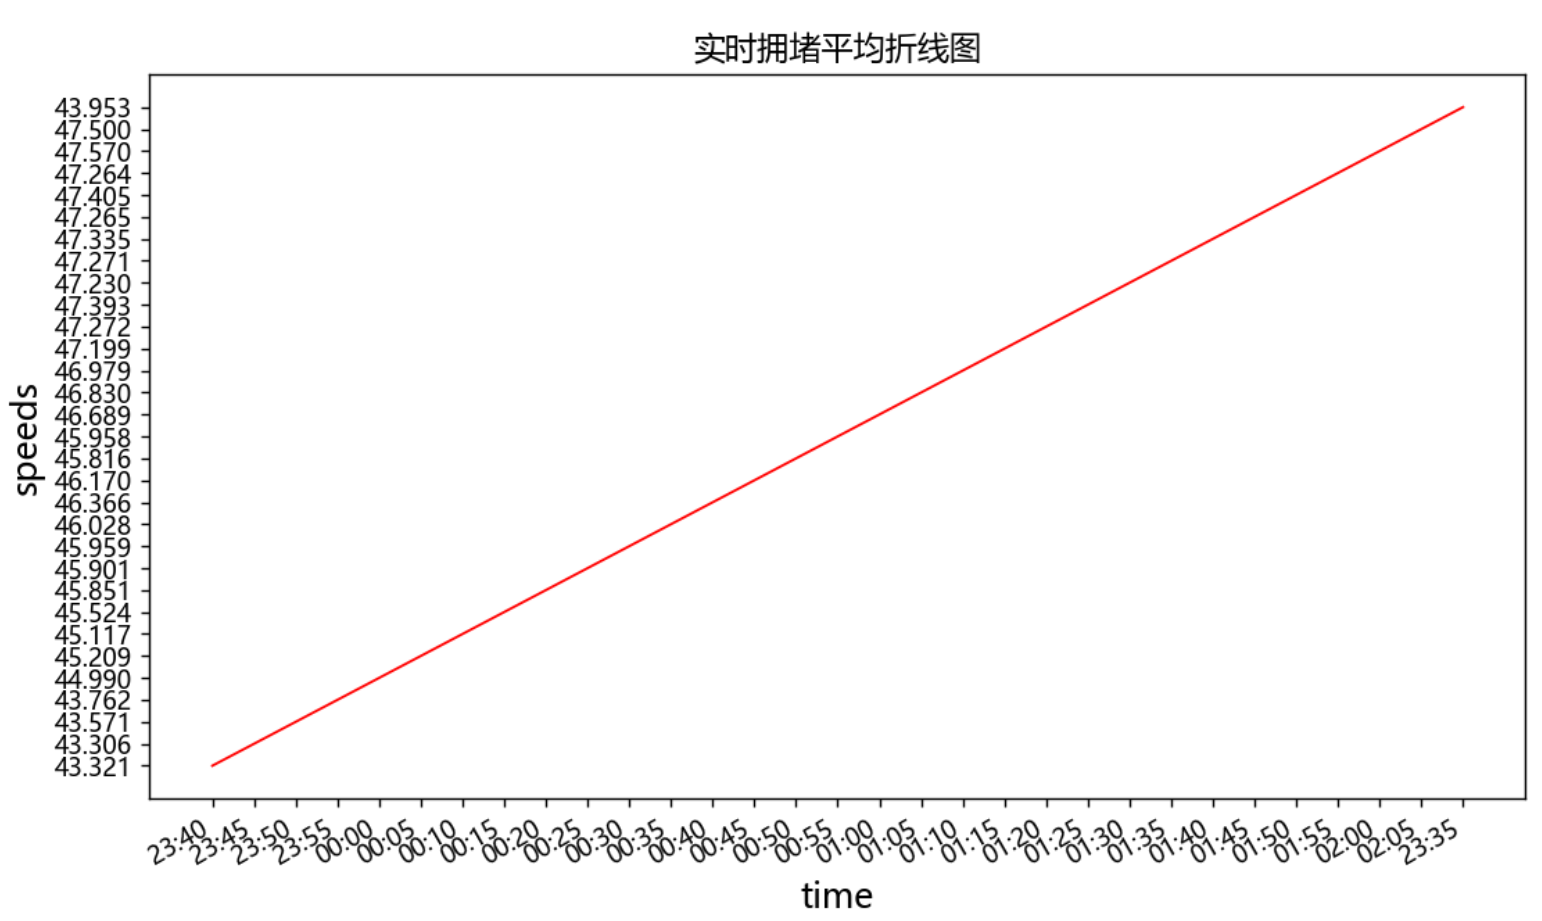
6.以同样的方法,提取出speed,绘制出speed和time之间的关系图像,执行分析。
源码:
 1 #导出speed数据
 2 import csv
 3 import matplotlib.pyplot as plt
 4 from datetime import datetime
 5
 6 filename = '泉州实时拥堵指数变化内容.csv'
 7 with open(filename,'r') as f:
 8     reader = csv.reader(f)      # 生成阅读器,f对象传入
 9     header_row = next(reader)   # 查看文件第一行,reader是可迭代对象
10
11     speed = []
12     for row in reader:
13         speed.append(row[2])
14     speeds=speed[:30]
15     speed=str(row[2])
16     speeds.append(speed)
17     print(speeds)
18
19 import matplotlib.pyplot as plt
20 # 设置圆点大小
21 size =  5
22 # 绘制散点图
23
24 fig = plt.figure(dpi=128,figsize=(10,6))
25 plt.scatter(dates,speeds, size, color="r")
26 plt.xlabel("时间")
27 fig.autofmt_xdate()             # 日期标签转为斜体
28 plt.ylabel("平均速度")
29 plt.title("实时拥堵平均速度散点图")
30 plt.show()
31
32 # 设置图片大小
33 fig = plt.figure(dpi=128,figsize=(10,6))
34 plt.plot(dates,speeds, c='red',linewidth=1)        # linewidth决定绘制线条的粗细
35 # 设置图片格式
36 plt.title('实时拥堵平均折线图', fontsize=13)  # 标题
37 plt.xlabel('时间', fontsize=14)
38 fig.autofmt_xdate()             # 日期标签转为斜体
39 plt.ylabel('平均速度', fontsize=14)
40 plt.tick_params(axis='both',which='major')
41 plt.rcParams['font.sans-serif']=['Microsoft YaHei']#显示中文
42 plt.show()  # 输出图像
折线图
散点图

根据这两个图像可知,在时间上,时间客观的决定了拥堵的程度,同时牵引着拥堵指数,拥堵指数影响着平均速度,在高峰期的时候更为突出。
7.绘制平均速度和拥堵指数的散点图与折线图,进一步的分析两者之间的关系
源码:
 1 import matplotlib.pyplot as plt
 2 # 设置圆点大小
 3 size =  5
 4 # 绘制散点图
 5
 6 fig = plt.figure(dpi=128,figsize=(10,6))
 7 plt.scatter(indexs,speeds, size, color="r")
 8 plt.xlabel("拥堵指数")
 9 fig.autofmt_xdate()             # 日期标签转为斜体
10 plt.ylabel("平均速度")
11 plt.title("实时拥堵平均速度与拥堵指数散点图")
12 plt.rcParams['font.sans-serif']=['Microsoft YaHei']#显示中文
13 plt.show()
14 # 设置图片大小
15 fig = plt.figure(dpi=128,figsize=(10,6))
16 plt.plot(dates,speeds, c='red',linewidth=1)        # linewidth决定绘制线条的粗细
17 # 设置图片格式
18 plt.title('实时拥堵平均与拥堵指数之间折线图', fontsize=13)  # 标题
19 plt.xlabel('拥堵指数', fontsize=14)
20 fig.autofmt_xdate()             # 日期标签转为斜体
21 plt.ylabel('平均速度', fontsize=14)
22 plt.tick_params(axis='both',which='major')
23 plt.rcParams['font.sans-serif']=['Microsoft YaHei']#显示中文
24 plt.show()  # 输出图像
散点图

折线图

如图所示平均速度与拥堵指数,相互影响,一方改变就会牵动着另一方的变化,再结合前面的数据分析,得出在不同的时间节点上,拥堵指数和平均速度都在变化,且也会受着不可控因素的影响
8.数据持久化
在数据提取直接采用,csv存储到默认位置,方便打开,并且方便数据更新,并且,方便我们的数据分析,也使得数据能够在任何场地、任何人的电脑都能够运行。
9、以上就是我的课程设计,完整代码如下
  1 #导入要使用的库
  2 import requests
  3 import re
  4 import json
  5
  6 #获取页面
  7 def get_page(url):
  8     try:
  9         response = requests.get(url)
 10         if response.content:  # 返回成功
 11             return response
 12     except requests.ConnectionError as e:
 13         print('url出错', e.args)
 14
 15 #输出get_page(url)的返回值和返回值类型。
 16 url = 'https://jiaotong.baidu.com/trafficindex/city/details?cityCode=134&callback=jsonp_1570959868686_520859'
 17 print(type(get_page(url)))
 18 print(get_page(url))
 19
 20 #将get_page(url)的返回值转为文本格式
 21 url = 'https://jiaotong.baidu.com/trafficindex/city/details?cityCode=134&callback=jsonp_1570959868686_520859'
 22 print(type(get_page(url)))
 23 print(get_page(url).text)
 24
 25 # 获取实时拥堵指数内容
 26 def get_detail(page):
 27     transformData = json.loads(re.findall(r'[(](.*?)[)]', page.text)[0])
 28     detail = transformData['data']['detail']
 29     print('实时拥堵指数数据:')
 30     for i in detail:
 31         print(str(i)+':'+str(detail[i]))
 32 print('获取实时拥堵指数内容')
 33 write_to_file('获取实时拥堵指数内容')
 34 get_detail(get_page(url_detail))
 35
 36
 37 # 获取实时拥堵指数内容
 38
 39 def get_detail(page):
 40     transformData = json.loads(re.findall(r'[(](.*?)[)]', page.text)[0])
 41     detail = transformData['data']['detail']
 42     print('实时拥堵指数数据:')
 43     for i in detail:
 44         print(str(i)+':'+str(detail[i]))
 45
 46 import requests
 47 import re
 48 import json
 49
 50 def get_page(url):
 51     try:
 52         response = requests.get(url)
 53         if response.content:  # 返回成功
 54             return response
 55     except requests.ConnectionError as e:
 56         print('url出错', e.args)
 57
 58 def write_to_file(content):
 59     with open('泉州市交通情况数据爬取.txt', 'a', encoding='utf-8') as f:
 60         f.write(json.dumps(content, ensure_ascii=False)+'\n')
 61         # f.close()
 62
 63 # 获取实时拥堵指数内容
 64 def get_detail(page):
 65     transformData = json.loads(re.findall(r'[(](.*?)[)]', page.text)[0])
 66     detail = transformData['data']['detail']
 67     for i in detail:
 68         write_to_file(str(i)+':'+str(detail[i]))
 69         print(str(i)+':'+str(detail[i]))
 70
 71 # 获取实时拥堵指数变化内容
 72 def get_curve(page):
 73     transformData = json.loads(re.findall(r'[(](.*?)[)]', page.text)[0])
 74     curve_detail = transformData['data']['list']
 75     k = 0
 76     for roadrank_list in curve_detail:
 77         print('---------------分割线---------------')
 78         print(k)
 79         write_to_file(str(k)+str(roadrank_list))
 80         k += 1
 81         print(roadrank_list)
 82
 83 # 获取实时道路拥堵指数内容
 84 def get_road(page):
 85     transformData = json.loads(re.findall(r'[(](.*?)[)]', page.text)[0])
 86     detail = transformData['data']['detail']
 87     for i in detail:
 88         write_to_file(str(i)+':'+str(detail[i]))
 89         print(str(i)+':'+str(detail[i]))
 90
 91 # 获取实时拥堵里程内容
 92 def get_congestmile(page):
 93     transformData = json.loads(re.findall(r'[(](.*?)[)]', page.text)[0])
 94     congest = transformData['data']['congest']
 95     for i in congest:
 96         write_to_file(str(i)+':'+str(congest[i]))
 97         print(str(i)+':'+str(congest[i]))
 98
 99
100 # 获取昨日早晚高峰内容
101 def get_peakCongest(page):
102     transformData = json.loads(re.findall(r'[(](.*?)[)]', page.text)[0])
103     peak_detail = transformData['data']['peak_detail']
104     for i in peak_detail:
105         write_to_file(str(i)+':'+str(peak_detail[i]))
106         print(str(i)+':'+str(peak_detail[i]))
107
108
109 # 获取全部道路拥堵情况
110 def get_roadrank(page):
111     transformData = json.loads(re.findall(r'[(](.*?)[)]', page.text)[0])
112     roadrank_detail = transformData['data']['list']
113     for roadrank_list in roadrank_detail:
114         write_to_file('---------------分割线---------------')
115         print('---------------分割线---------------')
116         for element in roadrank_list:
117             if str(element) != 'links' and str(element) != 'nameadd':
118                 write_to_file(str(element)+':'+str(roadrank_list[element]))
119                 print(str(element)+':'+str(roadrank_list[element]))
120
121 if __name__ == '__main__':
122
123     url_detail = 'https://jiaotong.baidu.com/trafficindex/city/details?cityCode=134&callback=jsonp_1570959868686_520859'
124
125     url_curve = 'https://jiaotong.baidu.com/trafficindex/city/curve?cityCode=134&type=minute&callback=jsonp_1571018819971_8078256'
126
127     url_road = 'https://jiaotong.baidu.com/trafficindex/city/road?cityCode=134&callback=jsonp_1571014746541_9598712'
128
129     url_congestmile = 'https://jiaotong.baidu.com/trafficindex/city/congestmile?cityCode=134&callback=jsonp_1571014746542_5952586'
130
131     url_peakCongest = 'https://jiaotong.baidu.com/trafficindex/city/peakCongest?cityCode=134&callback=jsonp_1571014746543_3489265'
132
133     url_roadrank = 'https://jiaotong.baidu.com/trafficindex/city/roadrank?cityCode=134&roadtype=0&callback=jsonp_1571016737139_1914397'
134
135     url_highroadrank = 'https://jiaotong.baidu.com/trafficindex/city/roadrank?cityCode=134&roadtype=1&callback=jsonp_1571018628002_9539211'
136
137     # 获取实时拥堵指数内容
138     print('获取实时拥堵指数内容')
139     write_to_file('获取实时拥堵指数内容')
140     get_detail(get_page(url_detail))
141
142     # 获取实时拥堵指数变化内容
143     print('获取实时拥堵指数变化内容')
144     write_to_file('获取实时拥堵指数变化内容')
145     get_curve(get_page(url_curve))
146
147     # 获取实时道路拥堵指数内容
148     print('获取实时道路拥堵指数内容')
149     write_to_file('获取实时道路拥堵指数内容')
150     get_road(get_page(url_road))
151
152     # 获取实时拥堵里程内容
153     print('获取实时拥堵里程内容')
154     write_to_file('获取实时拥堵里程内容')
155     get_congestmile(get_page(url_congestmile))
156
157     # 获取昨日早晚高峰内容
158     print('获取昨日早晚高峰内容')
159     write_to_file('获取昨日早晚高峰内容')
160     get_peakCongest(get_page(url_peakCongest))
161
162     # 获取全部道路拥堵情况
163     print('获取全部道路拥堵情况')
164     write_to_file('获取全部道路拥堵情况')
165     get_roadrank(get_page(url_roadrank))
166
167     # 获取高速/快速路拥堵情况
168     print('获取高速/快速路拥堵情况')
169     write_to_file('获取高速/快速路拥堵情况')
170     get_roadrank(get_page(url_highroadrank))
171
172 #将实时拥堵指数变化内容里的有用数据导出
173 from bs4 import BeautifulSoup
174 import urllib.request
175 import re
176
177 html_doc = "https://jiaotong.baidu.com/trafficindex/city/curve?cityCode=134&type=minute&callback=jsonp_1571018819971_8078256"
178 req = urllib.request.Request(html_doc)
179 webpage = urllib.request.urlopen(req)
180 html = webpage.read()
181 html=html.decode('utf-8')
182 transformData = json.loads(re.findall(r'[(](.*?)[)]',html)[0])
183 curve_detail = transformData['data']['list']
184 print(curve_detail)
185
186 #将实时拥堵指数变化内容的有用数据转化为csv文件
187 import pandas as pd
188
189 # 下面这行代码运行报错
190 # list.to_csv('e:/testcsv.csv',encoding='utf-8')
191 name=['index','speed','time']
192 test=pd.DataFrame(columns=name,data=curve_detail)#数据有三列,列名分别为one,two,three
193 print(test)
194 test.to_csv('泉州实时拥堵指数变化内容.csv',encoding='gbk')
195 #试运行导出前五行数据
196 df = pd.read_csv('泉州实时拥堵指数变化内容.csv',encoding='gbk')
197 df.head()
198
199 #导入csv模块
200 import csv
201
202 #指定文件名,然后使用 with open() as 打开
203 filename = '泉州实时拥堵指数变化内容.csv'
204 #导出头文件
205 with open(filename) as f:
206     #创建一个阅读器:将f传给csv.reader
207     reader = csv.reader(f)
208
209     #使用csv的next函数,将reader传给next,将返回文件的下一行
210     header_row = next(reader)
211
212     for index, column_header in enumerate(header_row):
213          print(index, column_header)
214      #读取拥堵指数
215      #创建最高拥堵指数的列表
216     indexs =[]
217     #遍历reader的余下的所有行(next读取了第一行,reader每次读取后将返回下一行)
218     for row in reader:
219         indexs.append(row[1])
220     #f分析前30个拥堵指数
221     indexs = indexs[:30]
222     print(indexs)
223     index = float(row[1])
224     indexs.append(index)
225
226 import csv
227 import matplotlib.pyplot as plt
228 from datetime import datetime
229
230 filename = '泉州实时拥堵指数变化内容.csv'
231 with open(filename,'r') as f:
232     reader = csv.reader(f)      # 生成阅读器,f对象传入
233     header_row = next(reader)   # 查看文件第一行,reader是可迭代对象
234
235     dates,indexs = [],[]
236     for row in reader:
237         #current_date = datetime.strptime(row[3])
238         dates.append(row[3])
239         #high = int(row[1])
240         indexs.append(row[1])
241     print(dates)
242     indexs = indexs[:30]
243     index = float(row[1])
244     indexs.append(index)
245     dates=dates[:30]
246     date=row[3]
247     dates.append(date)
248
249     # 设置图片大小
250     fig = plt.figure(dpi=128,figsize=(10,6))
251     plt.plot(dates,indexs, c='red',linewidth=1)        # linewidth决定绘制线条的粗细
252
253     # 设置图片格式
254     plt.title('实时拥堵指数折线图', fontsize=13)  # 标题
255     plt.xlabel('时间', fontsize=14)
256     fig.autofmt_xdate()             # 日期标签转为斜体
257     plt.ylabel('拥堵指数', fontsize=14)
258     plt.tick_params(axis='both',which='major')
259     plt.rcParams['font.sans-serif']=['Microsoft YaHei']#显示中文
260     plt.show()  # 输出图像
261
262 import csv
263 import matplotlib.pyplot as plt
264 from datetime import datetime
265
266 filename = '泉州实时拥堵指数变化内容.csv'
267 with open(filename,'r') as f:
268     reader = csv.reader(f)      # 生成阅读器,f对象传入
269     header_row = next(reader)   # 查看文件第一行,reader是可迭代对象
270
271     indexs = []
272     for row in reader:
273         indexs.append(row[1])
274     indexs = indexs[:30]
275     index = str(row[1])
276     indexs.append(index)
277
278
279 import matplotlib.pyplot as plt
280 # 设置圆点大小
281 size =  5
282 # 绘制散点图
283
284 fig = plt.figure(dpi=128,figsize=(10,6))
285 plt.scatter(dates,indexs, size, color="r")
286 plt.xlabel("时间")
287 fig.autofmt_xdate()             # 日期标签转为斜体
288 plt.ylabel("拥堵指数")
289 plt.title("实时拥堵指数散点图")
290 plt.show()
291
292 #导出speed数据
293 import csv
294 import matplotlib.pyplot as plt
295 from datetime import datetime
296
297 filename = '泉州实时拥堵指数变化内容.csv'
298 with open(filename,'r') as f:
299     reader = csv.reader(f)      # 生成阅读器,f对象传入
300     header_row = next(reader)   # 查看文件第一行,reader是可迭代对象
301
302     speed = []
303     for row in reader:
304         speed.append(row[2])
305     speeds=speed[:30]
306     speed=str(row[2])
307     speeds.append(speed)
308     print(speeds)
309
310 #实时拥堵平均速度散点图和折线图
311 import matplotlib.pyplot as plt
312 # 设置圆点大小
313 size =  5
314 # 绘制散点图
315
316 fig = plt.figure(dpi=128,figsize=(10,6))
317 plt.scatter(dates,speeds, size, color="r")
318 plt.xlabel("时间")
319 fig.autofmt_xdate()             # 日期标签转为斜体
320 plt.ylabel("平均速度")
321 plt.title("实时拥堵平均速度散点图")
322 plt.show()
323
324 # 设置图片大小
325 fig = plt.figure(dpi=128,figsize=(10,6))
326 plt.plot(dates,speeds, c='red',linewidth=1)        # linewidth决定绘制线条的粗细
327 # 设置图片格式
328 plt.title('实时拥堵平均折线图', fontsize=13)  # 标题
329 plt.xlabel('时间', fontsize=14)
330 fig.autofmt_xdate()             # 日期标签转为斜体
331 plt.ylabel('平均速度', fontsize=14)
332 plt.tick_params(axis='both',which='major')
333 plt.rcParams['font.sans-serif']=['Microsoft YaHei']#显示中文
334 plt.show()  # 输出图像
335
336
337 #绘制平均速度和拥堵指数的散点图和折线图
338 import matplotlib.pyplot as plt
339 # 设置圆点大小
340 size =  5
341 # 绘制散点图
342
343 fig = plt.figure(dpi=128,figsize=(10,6))
344 plt.scatter(indexs,speeds, size, color="r")
345 plt.xlabel("拥堵指数")
346 fig.autofmt_xdate()             # 日期标签转为斜体
347 plt.ylabel("平均速度")
348 plt.title("实时拥堵平均速度与拥堵指数散点图")
349 plt.rcParams['font.sans-serif']=['Microsoft YaHei']#显示中文
350 plt.show()
351 # 设置图片大小
352 fig = plt.figure(dpi=128,figsize=(10,6))
353 plt.plot(dates,speeds, c='red',linewidth=1)        # linewidth决定绘制线条的粗细
354 # 设置图片格式
355 plt.title('实时拥堵平均与拥堵指数之间折线图', fontsize=13)  # 标题
356 plt.xlabel('拥堵指数', fontsize=14)
357 fig.autofmt_xdate()             # 日期标签转为斜体
358 plt.ylabel('平均速度', fontsize=14)
359 plt.tick_params(axis='both',which='major')
360 plt.rcParams['font.sans-serif']=['Microsoft YaHei']#显示中文
361 plt.show()  # 输出图像
五、总结
1.预期与结果:
(1)根据数据网络爬虫,数据整合及转换,还有最后的数据分析来说,本次课程设计已经达到了我所预期的,能够将数据爬取出来,也能够将数据进行可视化和数据分析,让百度地图上不能够很直观的数据,能够直观的展现出来;同时分析了三种数据之间的关系,以图表的形式,是预期想做的,能够使他们之间的关系更加明了。
(2)这次的课程设计比较妙的地方在于,将数据进行了csv文件的生成,让数据可以随时可用,也可以随时可以更新,符合了我所想要达到的实验目的,让实时数据可以随时导出,随时利用。
2.不足之处:
(1)在前期的数据爬取上,仍存在着很多不懂的地方,在网络爬取数据方面需要进一步的加强;
(2)在后面的csv文件的导出上,还是不够熟练,花费时间过长
(3)在数据可视化分析上,有些语句仍不够熟练,不能很好的利用,进行数据可视化,导致在图像方面上,并没有达到预期的想法。


 浙公网安备 33010602011771号