
部署Ganglia集群
部署Ganglia集群
作者:尹正杰
版权声明:原创作品,谢绝转载!否则将追究法律责任。
一.实验环境说明
  首先介绍一下我的Hadoop测试集群,采用的CentOS 7.6,其角色分配如下:
    [nn]
    hadoop101.yinzhengjie.com

    [snn]
    hadoop105.yinzhengjie.com

    [dn]
    hadoop102.yinzhengjie.com
    hadoop103.yinzhengjie.com
    hadoop104.yinzhengjie.com

  综上所述,为了充分利用集群资源,于是我决定在hadoop105.yinzhengjie.com节点作为承载Ganglia服务器的节点。这意味着gmetad,gweb和rrdtool守护程序都将在这个服务器节点上运行。
二.安装Ganglia软件包
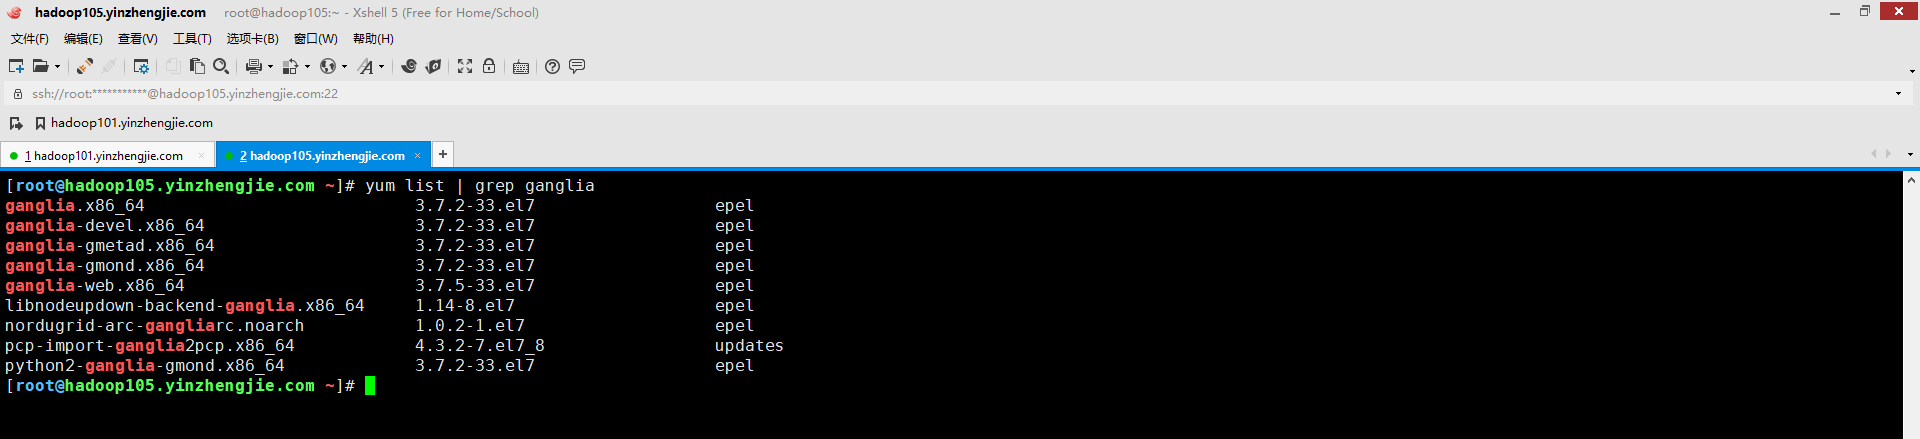
1>.在hadoop105.yinzhengjie.com节点上安装epel扩展源(因为CentOs默认源是没有Ganglia源的)
[root@hadoop105.yinzhengjie.com ~]# yum -y install epel-release # 如下图所示,如果安装扩展源成功后,我们就可以看到有关ganglia的软件源啦~
2>.在hadoop105.yinzhengjie.com节点安装gmetad和gmod软件包
[root@hadoop105.yinzhengjie.com ~]# yum -y install ganglia-gmetad.x86_64 ganglia-gmond.x86_64


温馨提示:
  通常ganglia-gmetad.x86_64软件包安装在服务端即可,而ganglia-gmond.x86_64软件包安装在客户端。
  但由于我的hadoop105.yinzhengjie.com有Hadoop相关进程需要监控,因此在本机我除了安装ganglia-gmetad.x86_64软件包外,还安装了ganglia-gmond.x86_64。
3>.在其他hadoop集群节点安装gmod软件包
[root@hadoop101.yinzhengjie.com ~]# ansible all -m shell -a 'yum -y install epel-release'  # 让所有节点安装扩展源,否则无法安装Ganglia软件包。
[root@hadoop101.yinzhengjie.com ~]#
[root@hadoop101.yinzhengjie.com ~]# ansible all -m shell -a 'yum -y install ganglia-gmond.x86_64'  # 让hadoop集群的素有节点安装gmod进程。
[root@hadoop101.yinzhengjie.com ~]#
三.配置gmetad管理端
1>.备份配置文件(/etc/ganglia/gmetad.conf)
[root@hadoop105.yinzhengjie.com ~]# wc -l /etc/ganglia/gmetad.conf  # 很明显,默认的配置文件信息量还是蛮大的,有240多行文字描述,不过大多数都是注释信息
240 /etc/ganglia/gmetad.conf
[root@hadoop105.yinzhengjie.com ~]#
[root@hadoop105.yinzhengjie.com ~]# egrep -v "^#|^$" /etc/ganglia/gmetad.conf  # 默认启用的就以下几个参数
data_source "my cluster" localhost
setuid_username ganglia
case_sensitive_hostnames 0
[root@hadoop105.yinzhengjie.com ~]#
[root@hadoop105.yinzhengjie.com ~]# cp /etc/ganglia/gmetad.conf /etc/ganglia/gmetad.conf-`date +%F`  # 在做接下的操作之前,一定要执行该步骤,先把原生的配置文件备份一份,而后再去修改gmetad配置文件哟~
[root@hadoop105.yinzhengjie.com ~]#
2>.编辑"/etc/ganglia/gmetad.conf"配置文件
[root@hadoop105.yinzhengjie.com ~]# vim /etc/ganglia/gmetad.conf
[root@hadoop105.yinzhengjie.com ~]#
[root@hadoop105.yinzhengjie.com ~]# egrep -v "^#|^$" /etc/ganglia/gmetad.conf
data_source "yinzhengjie-hadoop" hadoop105.yinzhengjie.com:8649  hadoop102.yinzhengjie.com:8649 hadoop103.yinzhengjie.com:8649
gridname "Yinzhengjie's Hadoop Cluster Monitoring"
setuid_username ganglia
xml_port 8651
interactive_port 8652
rrd_rootdir "/yinzhengjie/data/ganglia/rrds"
case_sensitive_hostnames 0
[root@hadoop105.yinzhengjie.com ~]#

上述相关参数说明:
  data_source:
    语法格式如下:
      data_source "my cluster" [polling interval] address1:port addreses2:port ...
    关键字"data_source"后面必须紧跟标识源的唯一字符串,然后是可选的轮询间隔(以秒为单位)。平均将在此间隔轮询源。如果省略轮询间隔,则假定为15秒。再之后就是为数据源提供服务的计算机的列表。
    需要注意的是:
      (1)指定标识源可以理解为集群的名称,gmond端必须和这里配置的一致,特别是在多播模式中,它们依赖于此进行识别。
      (2)为数据源提供服务的计算机的列表(使用空格隔开),格式为"ip:port"或者"hostname:prot",如果未指定端口,则假定为8649(默认gmond端口)。默认值:没有默认值

  gridname:
    指定web端网格的名称。上面的所有数据源都将被包装在具有此名称的网格标记中。默认值为:"unspecified"。
    这里的网格实际上就是data_source指定的集群。

  setuid_username:
    若不指定则启动gmetad进程的默认用户nobody,ganglia用户是我们在安装软件包时自动创建出来的。

  xml_port:
    指定XML收集汇总的交互端口,可以telnet该端口来获取XML格式的数据。默认端口号是8651,无需配置,当然,你也可以自定义端口号。

  interactive_port:
    指定web端获取数据的端口,该端口在配置gweb时需要指定,若不指定默认端口号是8652,无需配置,当然,你也可以自定义端口号。

  rrd_rootdir:
    指定RRD数据库的存储路径。gmetad在收集到监控数据后,会将其更新到RRD数据库中。需要注意的是,该目录路径对于运行Ganglia用户要有写权限哟~

  case_sensitive_hostnames
    禁用区分大小写功能(当ganglia版本大于3.2默认值为0)

温馨提示:
  建议仔细阅读配置文件,因为原生的配置文件有240行,里面含有对各个参数丰富的注释信息,基本上每个参数的作用,默认值均有相关解释哟~
3>.创建rrd数据库的存储路径(若不创建启动gmetad服务时可能会抛出错误哟)
[root@hadoop105.yinzhengjie.com ~]# mkdir -pv /yinzhengjie/data/ganglia/rrds
mkdir: created directory ‘/yinzhengjie/data/ganglia’
mkdir: created directory ‘/yinzhengjie/data/ganglia/rrds’
[root@hadoop105.yinzhengjie.com ~]#
[root@hadoop105.yinzhengjie.com ~]# chown ganglia:ganglia -R /yinzhengjie/data/ganglia/  # 创建目录成功后别忘记将该目录路径授权给启动ganglia服务的守护进程用户,我定义的文件是让ganglia用户来启动。
四.配置gmond客户端
1>.备份配置文件(/etc/ganglia/gmond.conf)
[root@hadoop101.yinzhengjie.com ~]# wc -l /etc/ganglia/gmond.conf  # 很明显,客户端的默认配置文件内容也不少哟~
379 /etc/ganglia/gmond.conf
[root@hadoop101.yinzhengjie.com ~]#
[root@hadoop101.yinzhengjie.com ~]# cp  /etc/ganglia/gmond.conf /etc/ganglia/gmond.conf-`date +%F`  # 为了保险起见,还是建议把配置文件备份一份,这样便于前后对比你所改的内容。
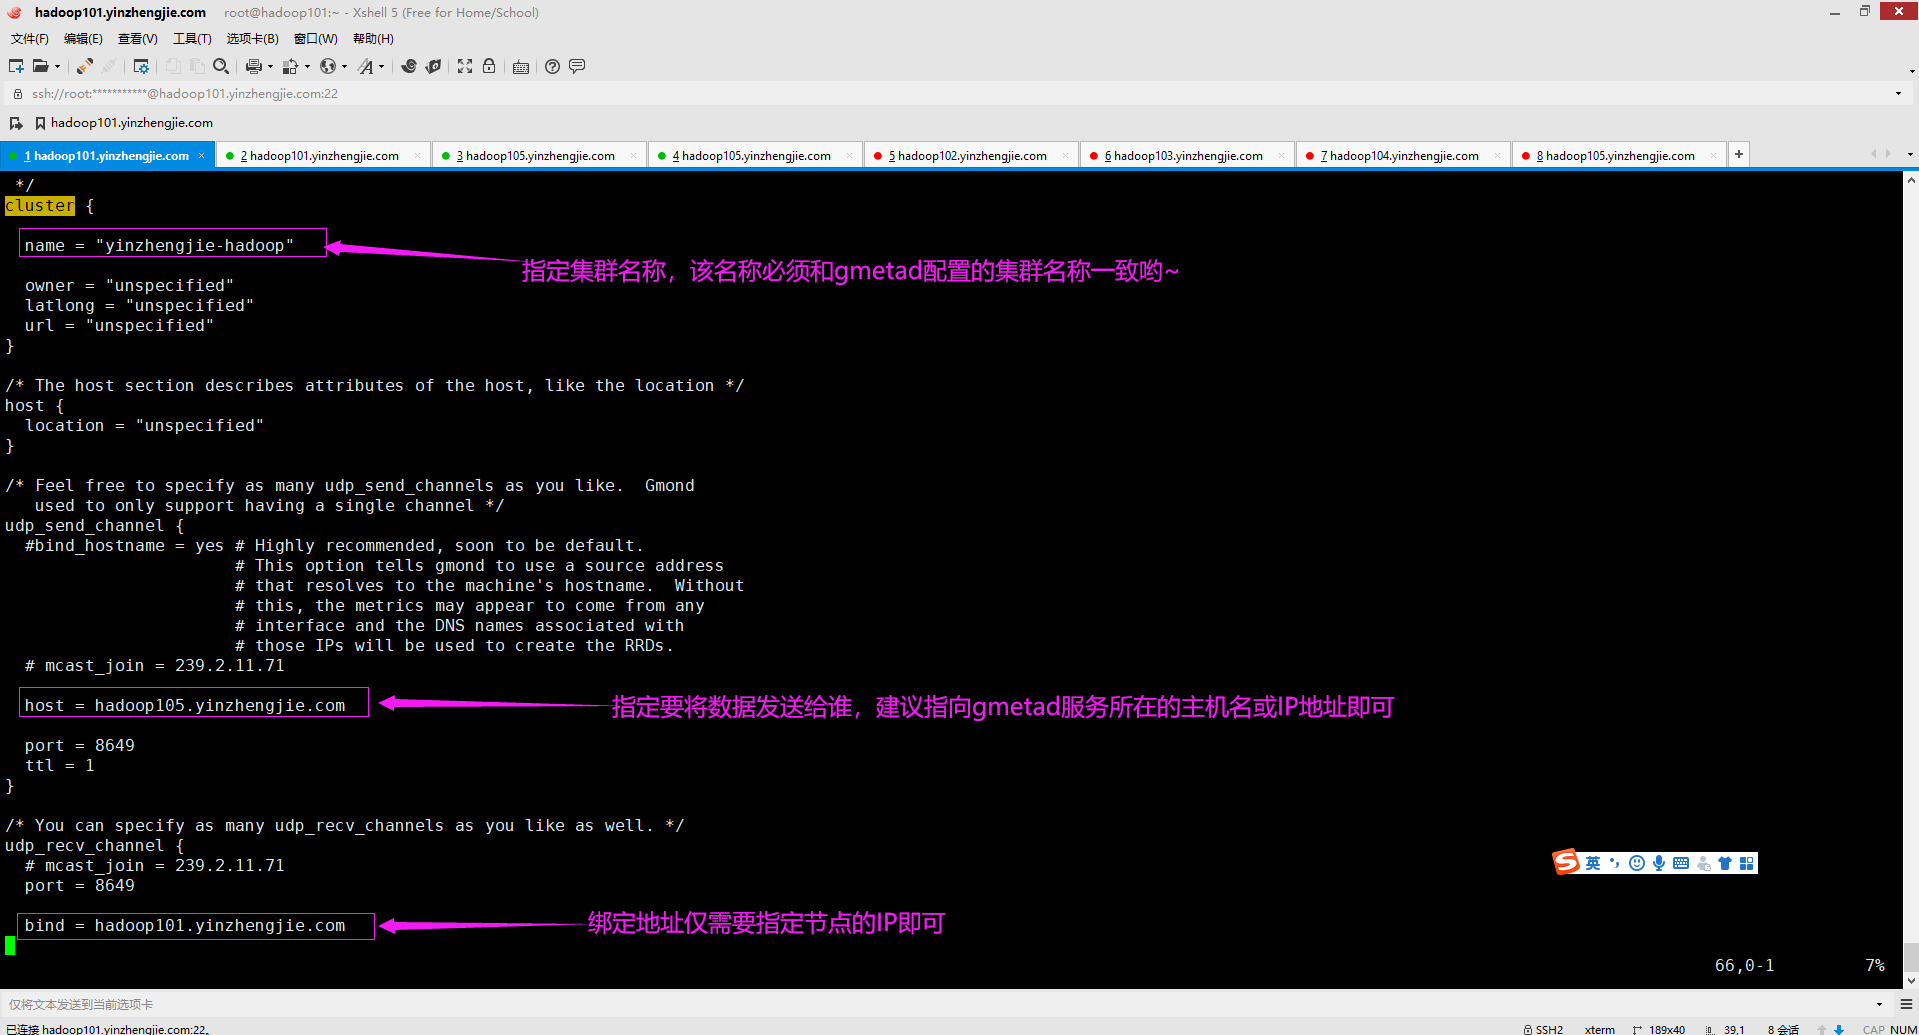
2>.编辑"/etc/ganglia/gmond.conf"配置文件


[root@hadoop101.yinzhengjie.com ~]# vim /etc/ganglia/gmond.conf
[root@hadoop101.yinzhengjie.com ~]#
[root@hadoop101.yinzhengjie.com ~]# cat /etc/ganglia/gmond.conf
/* This configuration is as close to 2.5.x default behavior as possible
   The values closely match ./gmond/metric.h definitions in 2.5.x */
globals {
  daemonize = yes
  setuid = yes
  user = ganglia
  debug_level = 0
  max_udp_msg_len = 1472
  mute = no
  deaf = no
  allow_extra_data = yes
  host_dmax = 86400 /*secs. Expires (removes from web interface) hosts in 1 day */
  host_tmax = 20 /*secs */
  cleanup_threshold = 300 /*secs */
  gexec = no
  # By default gmond will use reverse DNS resolution when displaying your hostname
  # Uncommeting following value will override that value.
  # override_hostname = "mywebserver.domain.com"
  # If you are not using multicast this value should be set to something other than 0.
  # Otherwise if you restart aggregator gmond you will get empty graphs. 60 seconds is reasonable
  send_metadata_interval = 0 /*secs */

}

/*
 * The cluster attributes specified will be used as part of the <CLUSTER>
 * tag that will wrap all hosts collected by this instance.
 */
cluster {

  name = "yinzhengjie-hadoop"

  owner = "unspecified"
  latlong = "unspecified"
  url = "unspecified"
}

/* The host section describes attributes of the host, like the location */
host {
  location = "unspecified"
}

/* Feel free to specify as many udp_send_channels as you like.  Gmond
   used to only support having a single channel */
udp_send_channel {
  #bind_hostname = yes # Highly recommended, soon to be default.
                       # This option tells gmond to use a source address
                       # that resolves to the machine's hostname.  Without
                       # this, the metrics may appear to come from any
                       # interface and the DNS names associated with
                       # those IPs will be used to create the RRDs.
  # mcast_join = 239.2.11.71

  host = hadoop105.yinzhengjie.com

  port = 8649
  ttl = 1
}

/* You can specify as many udp_recv_channels as you like as well. */
udp_recv_channel {
  # mcast_join = 239.2.11.71
  port = 8649

  bind = hadoop101.yinzhengjie.com

  retry_bind = true
  # Size of the UDP buffer. If you are handling lots of metrics you really
  # should bump it up to e.g. 10MB or even higher.
  # buffer = 10485760
}

/* You can specify as many tcp_accept_channels as you like to share
   an xml description of the state of the cluster */
tcp_accept_channel {
  port = 8649
  # If you want to gzip XML output
  gzip_output = no
}

/* Channel to receive sFlow datagrams */
#udp_recv_channel {
#  port = 6343
#}

/* Optional sFlow settings */
#sflow {
# udp_port = 6343
# accept_vm_metrics = yes
# accept_jvm_metrics = yes
# multiple_jvm_instances = no
# accept_http_metrics = yes
# multiple_http_instances = no
# accept_memcache_metrics = yes
# multiple_memcache_instances = no
#}

/* Each metrics module that is referenced by gmond must be specified and
   loaded. If the module has been statically linked with gmond, it does
   not require a load path. However all dynamically loadable modules must
   include a load path. */
modules {
  module {
    name = "core_metrics"
  }
  module {
    name = "cpu_module"
    path = "modcpu.so"
  }
  module {
    name = "disk_module"
    path = "moddisk.so"
  }
  module {
    name = "load_module"
    path = "modload.so"
  }
  module {
    name = "mem_module"
    path = "modmem.so"
  }
  module {
    name = "net_module"
    path = "modnet.so"
  }
  module {
    name = "proc_module"
    path = "modproc.so"
  }
  module {
    name = "sys_module"
    path = "modsys.so"
  }
}

/* The old internal 2.5.x metric array has been replaced by the following
   collection_group directives.  What follows is the default behavior for
   collecting and sending metrics that is as close to 2.5.x behavior as
   possible. */

/* This collection group will cause a heartbeat (or beacon) to be sent every
   20 seconds.  In the heartbeat is the GMOND_STARTED data which expresses
   the age of the running gmond. */
collection_group {
  collect_once = yes
  time_threshold = 20
  metric {
    name = "heartbeat"
  }
}

/* This collection group will send general info about this host*/
collection_group {
  collect_every = 60
  time_threshold = 60
  metric {
    name = "cpu_num"
    title = "CPU Count"
  }
  metric {
    name = "cpu_speed"
    title = "CPU Speed"
  }
  metric {
    name = "mem_total"
    title = "Memory Total"
  }
  metric {
    name = "swap_total"
    title = "Swap Space Total"
  }
  metric {
    name = "boottime"
    title = "Last Boot Time"
  }
  metric {
    name = "machine_type"
    title = "Machine Type"
  }
  metric {
    name = "os_name"
    title = "Operating System"
  }
  metric {
    name = "os_release"
    title = "Operating System Release"
  }
  metric {
    name = "location"
    title = "Location"
  }
}

/* This collection group will send the status of gexecd for this host
   every 300 secs.*/
/* Unlike 2.5.x the default behavior is to report gexecd OFF. */
collection_group {
  collect_once = yes
  time_threshold = 300
  metric {
    name = "gexec"
    title = "Gexec Status"
  }
}

/* This collection group will collect the CPU status info every 20 secs.
   The time threshold is set to 90 seconds.  In honesty, this
   time_threshold could be set significantly higher to reduce
   unneccessary  network chatter. */
collection_group {
  collect_every = 20
  time_threshold = 90
  /* CPU status */
  metric {
    name = "cpu_user"
    value_threshold = "1.0"
    title = "CPU User"
  }
  metric {
    name = "cpu_system"
    value_threshold = "1.0"
    title = "CPU System"
  }
  metric {
    name = "cpu_idle"
    value_threshold = "5.0"
    title = "CPU Idle"
  }
  metric {
    name = "cpu_nice"
    value_threshold = "1.0"
    title = "CPU Nice"
  }
  metric {
    name = "cpu_aidle"
    value_threshold = "5.0"
    title = "CPU aidle"
  }
  metric {
    name = "cpu_wio"
    value_threshold = "1.0"
    title = "CPU wio"
  }
  metric {
    name = "cpu_steal"
    value_threshold = "1.0"
    title = "CPU steal"
  }
  /* The next two metrics are optional if you want more detail...
     ... since they are accounted for in cpu_system.
  metric {
    name = "cpu_intr"
    value_threshold = "1.0"
    title = "CPU intr"
  }
  metric {
    name = "cpu_sintr"
    value_threshold = "1.0"
    title = "CPU sintr"
  }
  */
}

collection_group {
  collect_every = 20
  time_threshold = 90
  /* Load Averages */
  metric {
    name = "load_one"
    value_threshold = "1.0"
    title = "One Minute Load Average"
  }
  metric {
    name = "load_five"
    value_threshold = "1.0"
    title = "Five Minute Load Average"
  }
  metric {
    name = "load_fifteen"
    value_threshold = "1.0"
    title = "Fifteen Minute Load Average"
  }
}

/* This group collects the number of running and total processes */
collection_group {
  collect_every = 80
  time_threshold = 950
  metric {
    name = "proc_run"
    value_threshold = "1.0"
    title = "Total Running Processes"
  }
  metric {
    name = "proc_total"
    value_threshold = "1.0"
    title = "Total Processes"
  }
}

/* This collection group grabs the volatile memory metrics every 40 secs and
   sends them at least every 180 secs.  This time_threshold can be increased
   significantly to reduce unneeded network traffic. */
collection_group {
  collect_every = 40
  time_threshold = 180
  metric {
    name = "mem_free"
    value_threshold = "1024.0"
    title = "Free Memory"
  }
  metric {
    name = "mem_shared"
    value_threshold = "1024.0"
    title = "Shared Memory"
  }
  metric {
    name = "mem_buffers"
    value_threshold = "1024.0"
    title = "Memory Buffers"
  }
  metric {
    name = "mem_cached"
    value_threshold = "1024.0"
    title = "Cached Memory"
  }
  metric {
    name = "swap_free"
    value_threshold = "1024.0"
    title = "Free Swap Space"
  }
}

collection_group {
  collect_every = 40
  time_threshold = 300
  metric {
    name = "bytes_out"
    value_threshold = 4096
    title = "Bytes Sent"
  }
  metric {
    name = "bytes_in"
    value_threshold = 4096
    title = "Bytes Received"
  }
  metric {
    name = "pkts_in"
    value_threshold = 256
    title = "Packets Received"
  }
  metric {
    name = "pkts_out"
    value_threshold = 256
    title = "Packets Sent"
  }
}

/* Different than 2.5.x default since the old config made no sense */
collection_group {
  collect_every = 1800
  time_threshold = 3600
  metric {
    name = "disk_total"
    value_threshold = 1.0
    title = "Total Disk Space"
  }
}

collection_group {
  collect_every = 40
  time_threshold = 180
  metric {
    name = "disk_free"
    value_threshold = 1.0
    title = "Disk Space Available"
  }
  metric {
    name = "part_max_used"
    value_threshold = 1.0
    title = "Maximum Disk Space Used"
  }
}

include ("/etc/ganglia/conf.d/*.conf")

[root@hadoop101.yinzhengjie.com ~]#
[root@hadoop101.yinzhengjie.com ~]#
  各字段解释如下:
  globals字段:
    daemonize:
      是否后台运行,默认值为yes。
     setuid:
      是否设置运行用户的UID,在windows操作系统下建议设置为no。
    user:
      设置运行ganglia服务的用户名称,若不设置默认为nobody,官方已经显式帮我们设置为ganglia用户,该用户必须在当前操作系统中存在,而在安装gmod服务时,会自动帮咱们创建出该用户哟。
    debug_level:
      设置调试级别,默认值为0,表示不输出任何日志。
    max_udp_msg_len:
      最大UDP消息长度,默认值为1472。
    mute:
      是否发送监控数据到其他节点,设置为yes则表示本节点不再发送自己的监控数据到其他节点,默认值为no。
    deaf:
      表示是否接受其他节点发送过来的监控数据,设置为yes则表示本节点不再接受其他节点发送来的监控数据,默认值为no。
    allow_extra_data:
      是否接受额外的数据信息,默认值为yes,当设置为no时可以有效的节省带宽,但也意味着不再接受额外的数据。
    host_dmax:
      默认值是86400秒,即主机在1天内过期(从web界面删除)。若设置为0,则永不删除主机信息。
    host_tmax:
      指定TMAX的时间长度,默认值是20秒,TMAX的属性我也不是很清楚,但我发现在"/etc/ganglia/gmetad.conf"配置文件中关于"data_source"关键字的注释信息中有提到了它。
    cleanup_threshold:
      设置gmod清理过期数据的时间,默认300秒。
    gexec:
      当设置为yes时,运行执行gexec Job,默认值为no。
    send_metadata_interval:
      默认值为0秒,如果不使用多播,则应将此值设置为0以外的值。否则,如果重新启动aggregator gmond,将得到空的图。60秒是合理的。
      换句话说,在单播环境中,如果将该值设置为0,当某个节点的gmod重启后,gmod的获取节点(即gmetad)将不再接受该节点的数据,如果设置大于0,可以保证gmod节点关闭或重启后,在设定的阈值时间内gmetad节点可以重新获取gmod发送的数据。


  cluster字段:
    name:
      定义集群的名称,该名称必须和"/etc/ganglia/gmetad.conf"配置文件中的"data_source"关键字指定的唯一标识符同名,默认值为"unspecified"
    owner :
      默认值为"unspecified",无需修改,
    latlong:
      默认值为"unspecified",无需修改。
    url:
      默认值为"unspecified",无需修改。


  host 字段:
    location:
      默认值为 "unspecified",无需修改。

  udp_send_channel字段:
    mcast_join :
      默认值是一个D类地址,即239.2.11.71。在网络环境比较复杂的情况下建议使用单播模式,即使用host来定义。
    host:
      指定单播地址。该地址指定的是gmetad服务器的地址。
    port:
      指定gmod的UDP监听端口,默认值为8649
    ttl:
        指定UDP发送通道的ttl,默认值为1,无需修改。

  udp_recv_channel字段
    mcast_join:
      默认值是一个D类地址,即239.2.11.71,如果udp_send_channle字段使用的是单播地址(即host字段),则建议注释该字段。
    port:
      指定本机端口,默认值为8649
    bind:
      指定绑定本机的地址,hadoop101.yinzhengjie.com。
    retry_bind:
      尝试重试绑定,默认值为true,无需修改。
    buffer:
      指定UDP的buffer大小,默认是10485760字节(即10MB),无需修改。

  tcp_accept_channel 字段
    port :
      指定TCP的监听端口,默认值为 8649
    gzip_output :
      是否启用gzip压缩,默认值为no。
3>.将"/etc/ganglia/gmond.conf"配置文件分发到其它集群节点
[root@hadoop101.yinzhengjie.com ~]# ansible all -m copy -a "src=/etc/ganglia/gmond.conf dest=/etc/ganglia/gmond.conf"

温馨提示:
  需要注意的是,将hadoop101.yinzhengjie.com的配置拷贝到集群其他节点,如果我们在bind写死主机名的话需要一个一个手动登录到所有节点逐一去修改哟~因此为了省事情建议写成"0.0.0.0"。
五.配置gweb端
1>.在hadoop105.yinzhengjie.com节点上安装gweb相关组件
[root@hadoop105.yinzhengjie.com ~]# yum -y install nginx php-fpm ganglia-web

温馨提示:
nginx:
  指的就是咱们使用的web服务器,只不过它仅能处理静态数据。
php-fpm:
  它可以处理PHP相关的程序,因此必须安装该包。
ganglia-web:
主要是安装ganglia所需要的web文件,安装该包成功后,你会发现多出来了一个"/usr/share/ganglia"目录,我们无需关心该目录,不需要做任何操作,到时候在nginx的配置文件指定root目录为它即可。
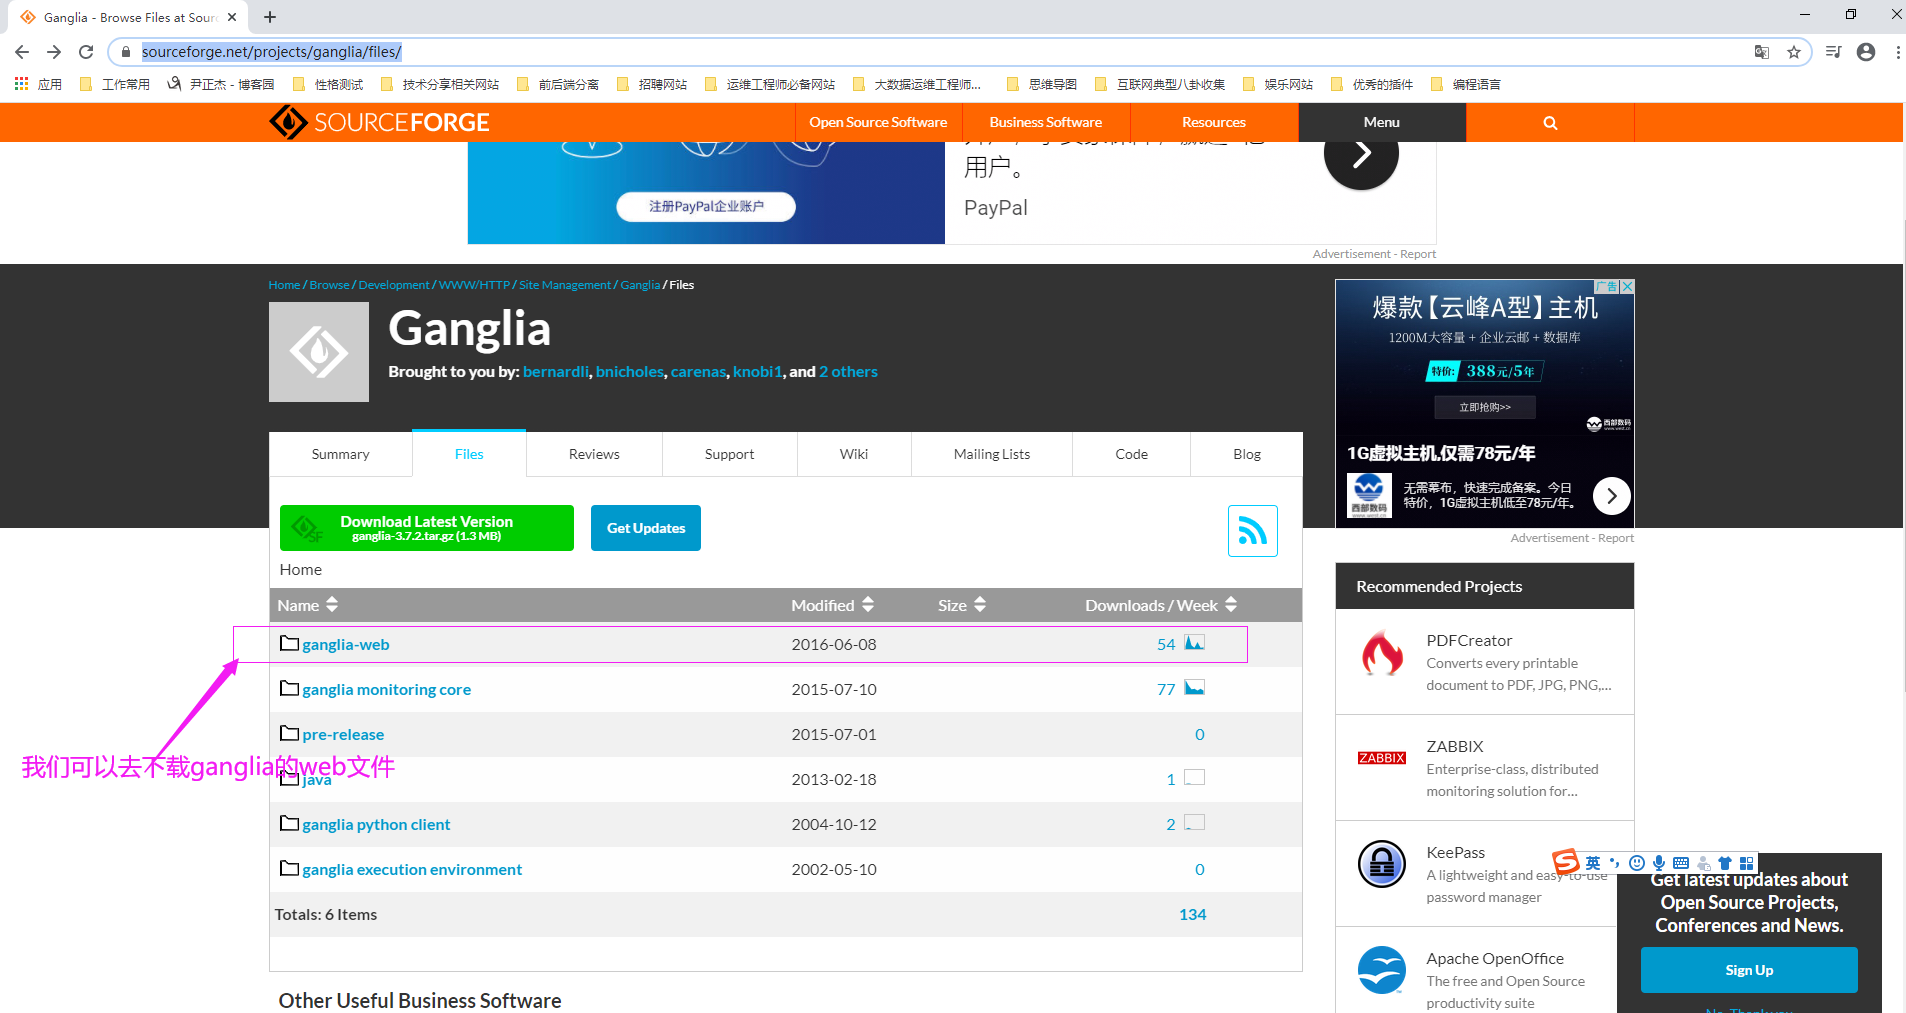
当然你也可以安装该包。如下图所示,可以去官网手动下载(连接地址:https://sourceforge.net/projects/ganglia/files/)ganglia-web文件,它是一个tar包。下载后解压并配置相应权限即可。
博主建议还是基于yum方式安装即可,因为无需做更多配置直接就一步到位啦~
2>.配置nginx的配置文件
[root@hadoop105.yinzhengjie.com ~]# vim /etc/nginx/nginx.conf  # 编辑主配置文件,主要修改日志格式为JSON格式,而后确认子配置文件在哪个路径下配置(即关注"include"关键字)。
[root@hadoop105.yinzhengjie.com ~]#
[root@hadoop105.yinzhengjie.com ~]# egrep -v "^#|^$" /etc/nginx/nginx.conf
user nginx;
worker_processes auto;
error_log /var/log/nginx/error.log;
pid /run/nginx.pid;
include /usr/share/nginx/modules/*.conf;
events {
    worker_connections 1024;
}
http {
    log_format my_access_json '{"@timestamp":"$time_iso8601",' '"host":"$server_addr",' '"clientip":"$remote_addr",' '"size":$body_bytes_sent,' '"responsetime":$request_time,' '"upstreamtim
e":"$upstream_response_time",' '"upstreamhost":"$upstream_addr",' '"http_host":"$host",' '"uri":"$uri",' '"domain":"$host",' '"xff":"$http_x_forwarded_for",' '"referer":"$http_referer",' '"tcp_xff":"$proxy_protocol_addr",' '"http_user_agent":"$http_user_agent",' '"status":"$status"}';
   access_log  /var/log/nginx/access.log  my_access_json;
    sendfile            on;
    tcp_nopush          on;
    tcp_nodelay         on;
    keepalive_timeout   65;
    types_hash_max_size 2048;
    include             /etc/nginx/mime.types;
    default_type        application/octet-stream;
    # Load modular configuration files from the /etc/nginx/conf.d directory.
    # See http://nginx.org/en/docs/ngx_core_module.html#include
    # for more information.
    include /etc/nginx/conf.d/*.conf;
}
[root@hadoop105.yinzhengjie.com ~]#
[root@hadoop105.yinzhengjie.com ~]# vim /etc/nginx/conf.d/ganglia.conf  # 配置ganglia的root目录
[root@hadoop105.yinzhengjie.com ~]#
[root@hadoop105.yinzhengjie.com ~]# cat /etc/nginx/conf.d/ganglia.conf
server {
    listen       80 default_server;
    server_name  _;
    # 注意:"/usr/share/ganglia"无需手动创建,它在安装"ganglia-web"包时自动生成的哟~
    root         /usr/share/ganglia;
    index    index.php;
    include /etc/nginx/default.d/*.conf;

    location / {
    }

    location ~ \.php$ {
    fastcgi_pass   127.0.0.1:9000;
    fastcgi_index  index.php;
    fastcgi_param SCRIPT_FILENAME $document_root$fastcgi_script_name;
    include        fastcgi_params;
    }

    error_page 404 /404.html;
        location = /40x.html {
    }

    error_page 500 502 503 504 /50x.html;
        location = /50x.html {
    }
}
[root@hadoop105.yinzhengjie.com ~]#
六.启动服务
1>.启动nginx服务
[root@hadoop105.yinzhengjie.com ~]# systemctl start php-fpm
[root@hadoop105.yinzhengjie.com ~]#
[root@hadoop105.yinzhengjie.com ~]# systemctl status php-fpm
[root@hadoop105.yinzhengjie.com ~]#
[root@hadoop105.yinzhengjie.com ~]# systemctl enable php-fpm
[root@hadoop105.yinzhengjie.com ~]#
[root@hadoop105.yinzhengjie.com ~]# systemctl start nginx
[root@hadoop105.yinzhengjie.com ~]#
[root@hadoop105.yinzhengjie.com ~]# systemctl status nginx
[root@hadoop105.yinzhengjie.com ~]#
[root@hadoop105.yinzhengjie.com ~]# systemctl enable nginx
[root@hadoop105.yinzhengjie.com ~]#
2>.启动gmetad
[root@hadoop105.yinzhengjie.com ~]# systemctl restart gmetad
[root@hadoop105.yinzhengjie.com ~]#
[root@hadoop105.yinzhengjie.com ~]# systemctl status gmetad
[root@hadoop105.yinzhengjie.com ~]#
[root@hadoop105.yinzhengjie.com ~]# systemctl enable gmetad
[root@hadoop105.yinzhengjie.com ~]#
3>.启动gmond
[root@hadoop105.yinzhengjie.com ~]# systemctl start gmond
[root@hadoop105.yinzhengjie.com ~]#
[root@hadoop105.yinzhengjie.com ~]# systemctl status gmond
[root@hadoop105.yinzhengjie.com ~]#
[root@hadoop105.yinzhengjie.com ~]# systemctl enable gmond


[root@hadoop101.yinzhengjie.com ~]# ansible all -m shell -a 'systemctl start gmond'  # 其他节点也需要启动gmond哟~
[root@hadoop101.yinzhengjie.com ~]#
[root@hadoop101.yinzhengjie.com ~]# ansible all -m shell -a 'systemctl enable gmond'
七.搭建集群可能出现问题
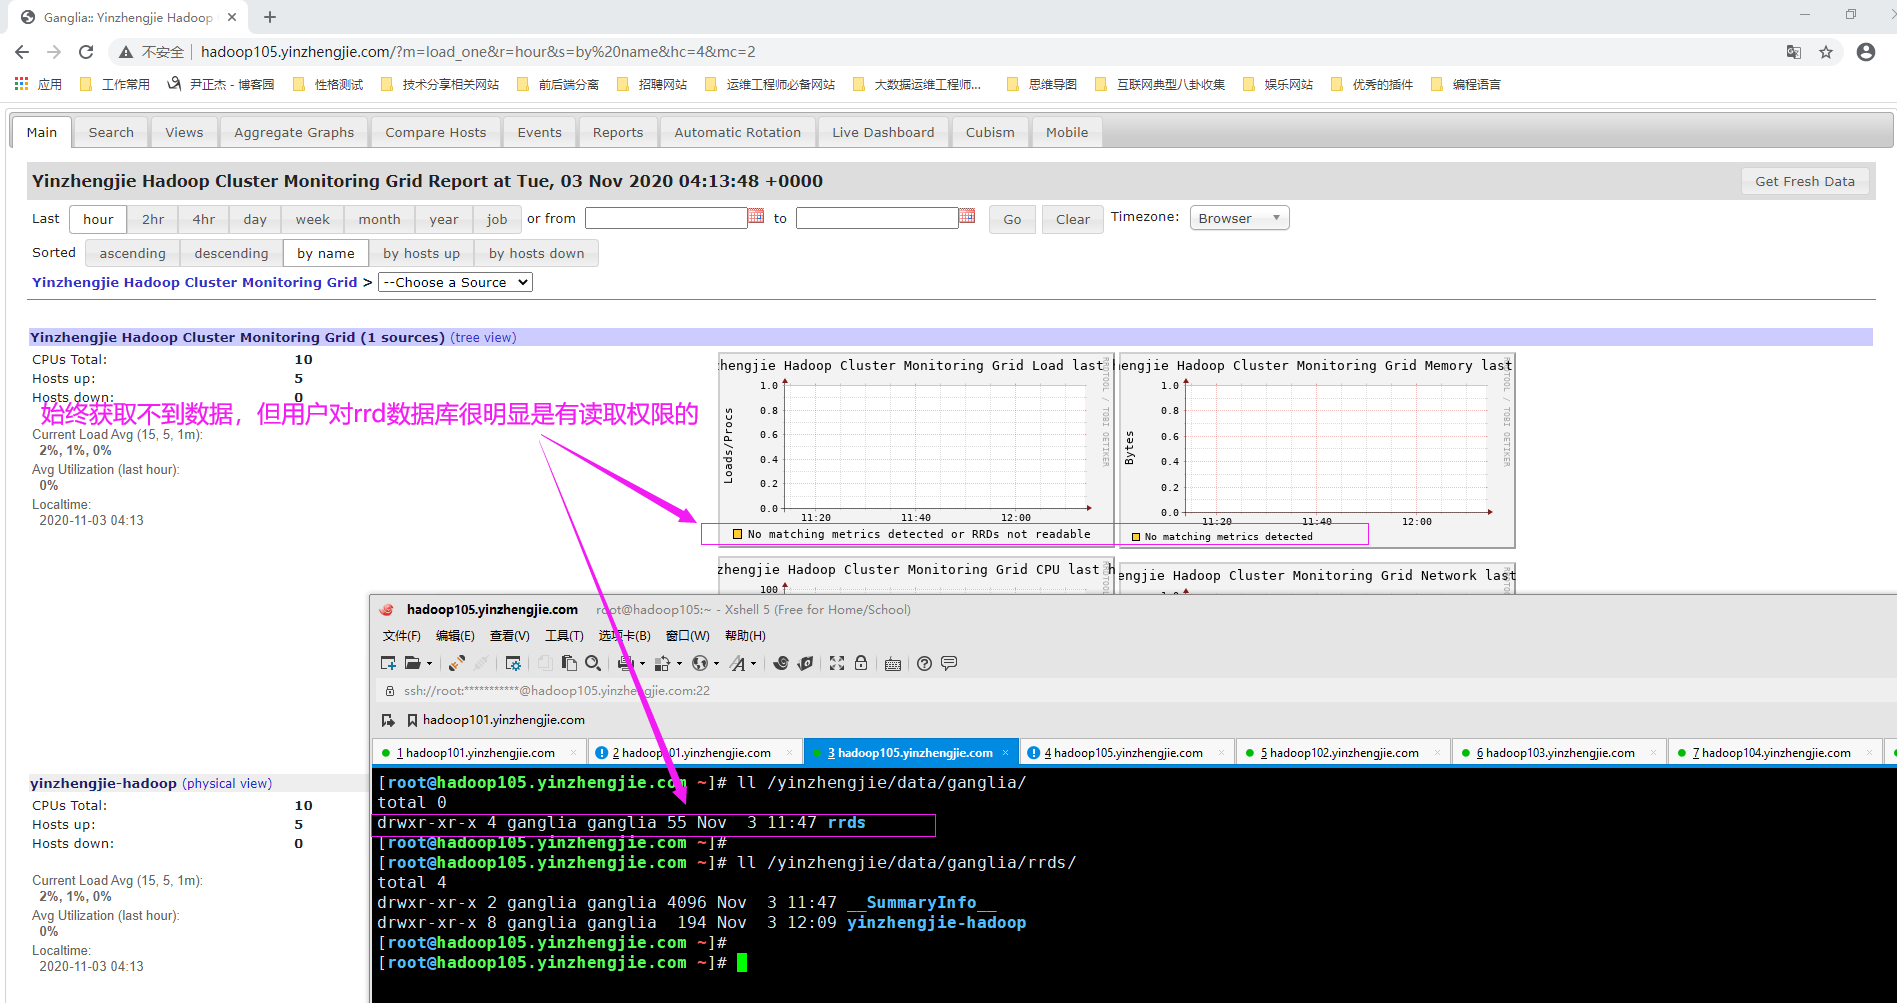
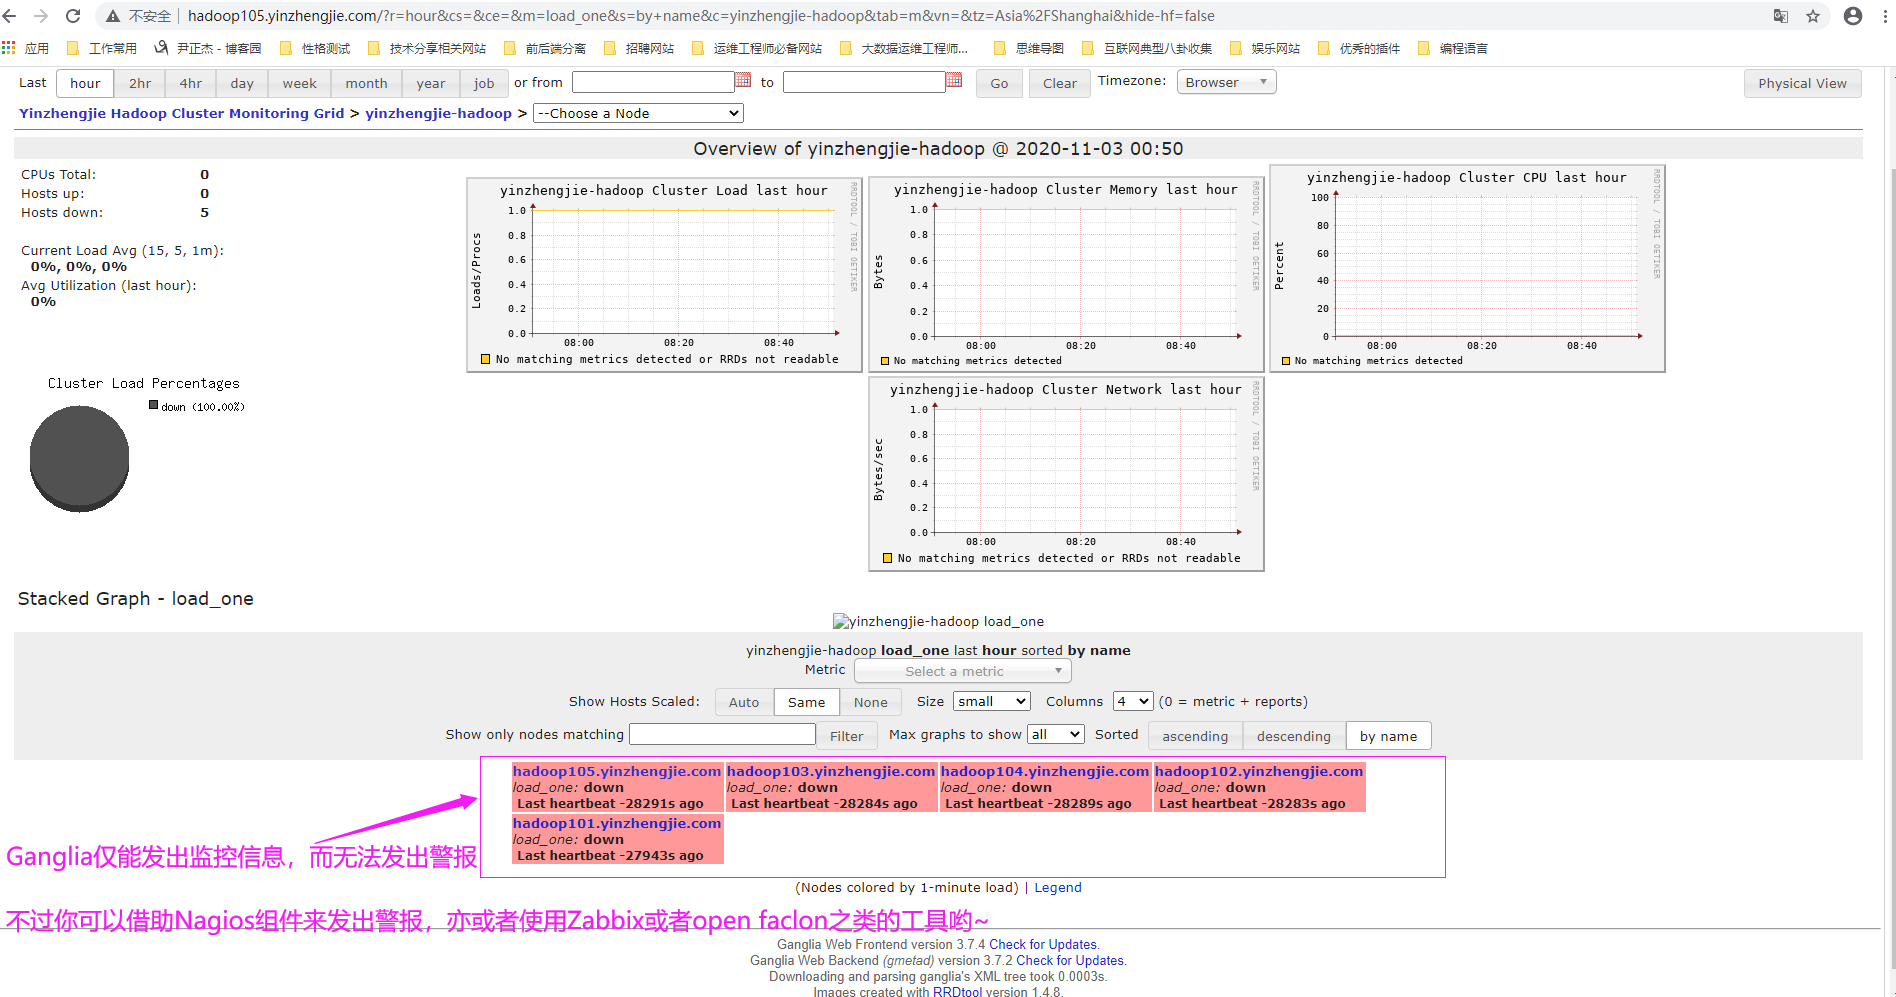
  如下图所示,gmetad已经接受来自gmod节点的数据,但始终无法在web界面展示,但相比大家也看到了,关于CPU的信息的确在web界面是获取到了,但其他的信息就没有显示了,这一点让我很困惑!

  我这篇笔记是是根据"https://www.cnblogs.com/yinzhengjie/p/9798739.html"笔记而来,只不过把搭建过程更详细化了。

  希望你没有遇到和我一样的困惑,先留个截图在这里吧,若以后解决了在把解决方案写下。(我初步怀疑可能是某些依赖包未安装导致web页面无法显示采集来的数据信息)。
  Ganglia的仅能起到监控作用,无法发出警报功能,若想要发出警报信息可以借助Nagios发出警报信息哟~

  Nagios是一个开源监控系统,可以帮助我们检验系统的运行状况,是一个非常好的警报和监视工具。可以使用Nagios来监测家禽资源和应用程序的状态以及CPU,磁盘和内存等系统资源。

  虽然Ganglia主要用来收集和跟踪指标,但Nagios可以依靠其内置的通知系统发警报。

  Nagios支持以下功能:
    (1)获取关于集群基础设施的最新信息;
    (2)生成故障报警;
    (3)检测潜在问题;
    (4)监控资源可用性;

  博主推荐使用监控,警报功能一体的开源监控系统,比如国外的zabbix服务,如果您的集群在10000台以内的话,分布式zabbix监控系统应该是hold住的。如果集群规模较大可以考虑使用Open Falcon。
当你的才华还撑不起你的野心的时候,你就应该静下心来学习。当你的能力还驾驭不了你的目标的时候,你就应该沉下心来历练。问问自己,想要怎样的人生。 欢迎加入基础架构自动化运维:598432640,大数据SRE进阶之路:959042252,DevOps进阶之路:526991186

 浙公网安备 33010602011771号