Python绘制电偶极子周围的电场线和等势面
代码
代码来自《Sagemath与物理学》
思路是:先描述电势,对电势求负梯度。最后绘图。
from matplotlib.tri import Triangulation,UniformTriRefiner,CubicTriInterpolator
import matplotlib.pyplot as plt
import matplotlib.cm as cm
import numpy as np
import math
def dipole_potential(x,y):
# 定义电偶极子的势能
r_sq=x**2+y**2
theta=np.arctan2(y,x)
z=np.cos(theta)/r_sq
return (np.max(z)-z)/(np.max(z)-np.min(z))
n_angles=30
n_radii=10
min_radius=0.2
radii=np.linspace(min_radius,0.95,n_radii)
angles = np.linspace(0,2*math.pi,n_angles,endpoint=False)
angles = np.repeat(angles[..., np.newaxis],n_radii,axis=1)
angles[:,1::2] += math.pi/n_angles
x=(radii * np.cos(angles)).flatten()
y=(radii * np.sin(angles)).flatten()
V=dipole_potential(x,y)
# Create the Triangulation; no triangles specified so
# Delanunay triangulation created.
triang=Triangulation(x, y)
# Mask off unwanted triangles.
xmid=x[triang.triangles].mean(axis=1)
ymid=y[triang.triangles].mean(axis=1)
mask=np.where(xmid*xmid+ymid*ymid<min_radius*min_radius, 1, 0)
triang.set_mask(mask)
#----------------------
# Refine data-interpolates the electrical potential V
#----------------------
refiner = UniformTriRefiner(triang)
tri_refi, z_test_refi=refiner.refine_field(V, subdiv=3)
#----------------------
# Computes the electrical field (Ex,Ey) as gradient of electrical potential
#----------------------
tci=CubicTriInterpolator(triang, -V)
# Gradient requested here at the mesh nodes but could be anywhere else:
(Ex, Ey)=tci.gradient(triang.x, triang.y) #电场强度是电势的梯度负值
E_norm = np.sqrt(Ex**2,Ey**2)
#----------------------
# Plot the triangulation, the potential iso-contours and the vector field
#----------------------
plt.figure()
plt.gca().set_aspect('equal')
plt.triplot(triang)
levels = np.arange(start=0.0, stop=1.0, step=0.01)
cmap= cm.get_cmap(name='hot', lut=None)
plt.tricontour(tri_refi, z_test_refi, levels=levels, cmap=cmap, linewidths=[2.0, 1.0, 1.0, 1.0])
# Plots direction of the electrical vector field
plt.quiver(triang.x,triang.y,Ex/E_norm,Ey/E_norm,
units='xy',scale=10.0, zorder=3, color='blue',
width=0.007, headwidth=3.0, headlength=4.0)
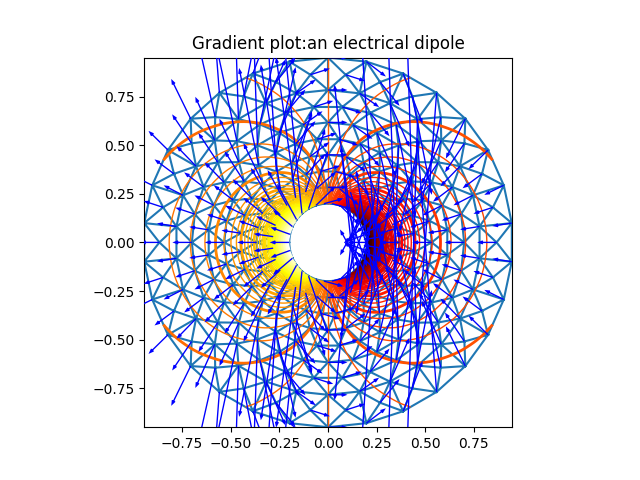
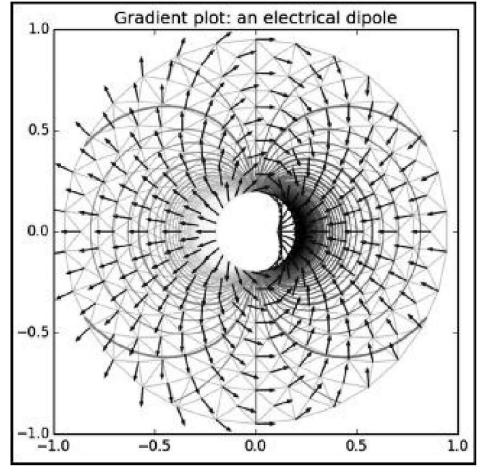
plt.title('Gradient plot:an electrical dipole')
plt.show()
结果展示
书上的结果
实际的效果