1、实践案例分析
1.1、项目经典效果图

1.2、需求简介
在我们的项目中,日志信息会输出到定制的目录里面了,那么接下来,我们就以nignx的日志数据为对象,使用filebeat来获取这些日志,将其输入到logstash中,logstash接收到数据后,定制显示格式,将
其输入到elasticsearch中,kibana从elasticsearch中获取数据,并展示到当前界面
1.3、流程分析
1、确定nginx的日志文件
2、filebeat 读取本机的nginx日志,并传输到 logstash
3、logstash 接收到数据后,定制输出格式,将数据转交给 elasticsearch
4、kibana 根据定制的索引名称,从 elasticsearch 中获取数据。
1.4、关键点分析
准备工作:
 nginx件路径在/var/log/nginx/access.log,我们来获取.log格式文件数据filebeat数据收集
 基于默认的 input方式确定数据文件,output方式选择logstash
 注意: input 内部的 enabled 必须开启

logstash传输
 基于 input属性获取filebeat的内容,基于output属性将数据发送给es

kibana展示
 基于索引名称到elasticsearch获取数据,然后在discover中确认数据
1.5、实践步骤
1、环境还原
 清空filebeat程序
 关闭kibana程序
 清空elasticsearch索引

2、定制filebeat
 编写配置文件
 启动filebeat

3、定制logstash
 定制logstash文件
 启动logstash

4、定制kibana
 配置查询索引
 验证效果
2、环境准备
2.1、清除ES所有的index
for index in $(curl -s http://192.168.10.25:9200/_cat/indices | awk '{print $3}')
do
curl -XDELETE 192.168.10.25:9200/${index}
done
2.2、filebeat主机安装nginx
2.3、关闭所有服务
systemctl stop kibana
systemctl stop logstash
systemctl stop filebeat
3、综合配置
3.1、logstash配置
3.1.1、配置
cat << 'CAT_END' >/etc/logstash/conf.d/logstash.conf
input {
 beats {
  port => 5044
 }
}
output{
 elasticsearch {
  hosts => ["192.168.10.25:9200"]
  index => "nginx-%{+YYYY.MM.dd}"
 }
}
CAT_END
3.1.2、启动服务
3.2、filebeat配置
3.2.1、配置
root@filebeat:~# grep -iEv '^$|#' /etc/filebeat/filebeat.yml
filebeat.inputs:
- type: log
  id: nginx_id_20230606
  enabled: true
  paths:
    - /var/log/nginx/*.log
filebeat.config.modules:
  path: ${path.config}/modules.d/*.yml
  reload.enabled: false
setup.template.settings:
  index.number_of_shards: 5
setup.kibana:
output.logstash:
  hosts: ["192.168.10.28:5044"]
processors:
  - add_host_metadata:
      when.not.contains.tags: forwarded
  - add_cloud_metadata: ~
  - add_docker_metadata: ~
  - add_kubernetes_metadata: ~
3.2.2、启动服务
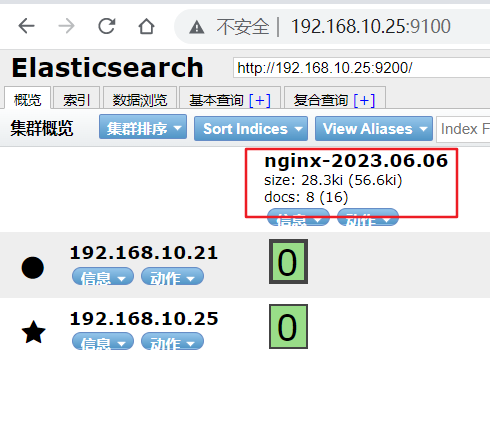
3.2.3、检查ES索引
root@filebeat:~# curl 192.168.10.25:9200/_cat/indices
green open nginx-2023.06.06 aPvm1ST-TVGjuGAXinjU-A 1 1  8 0 56.5kb 28.2kb
3.2.4、浏览器查看ES状态
3.3、kibana配置
3.3.1、kibana启动
3.3.2、使用浏览器访问kibana
http://192.168.10.29:5601/
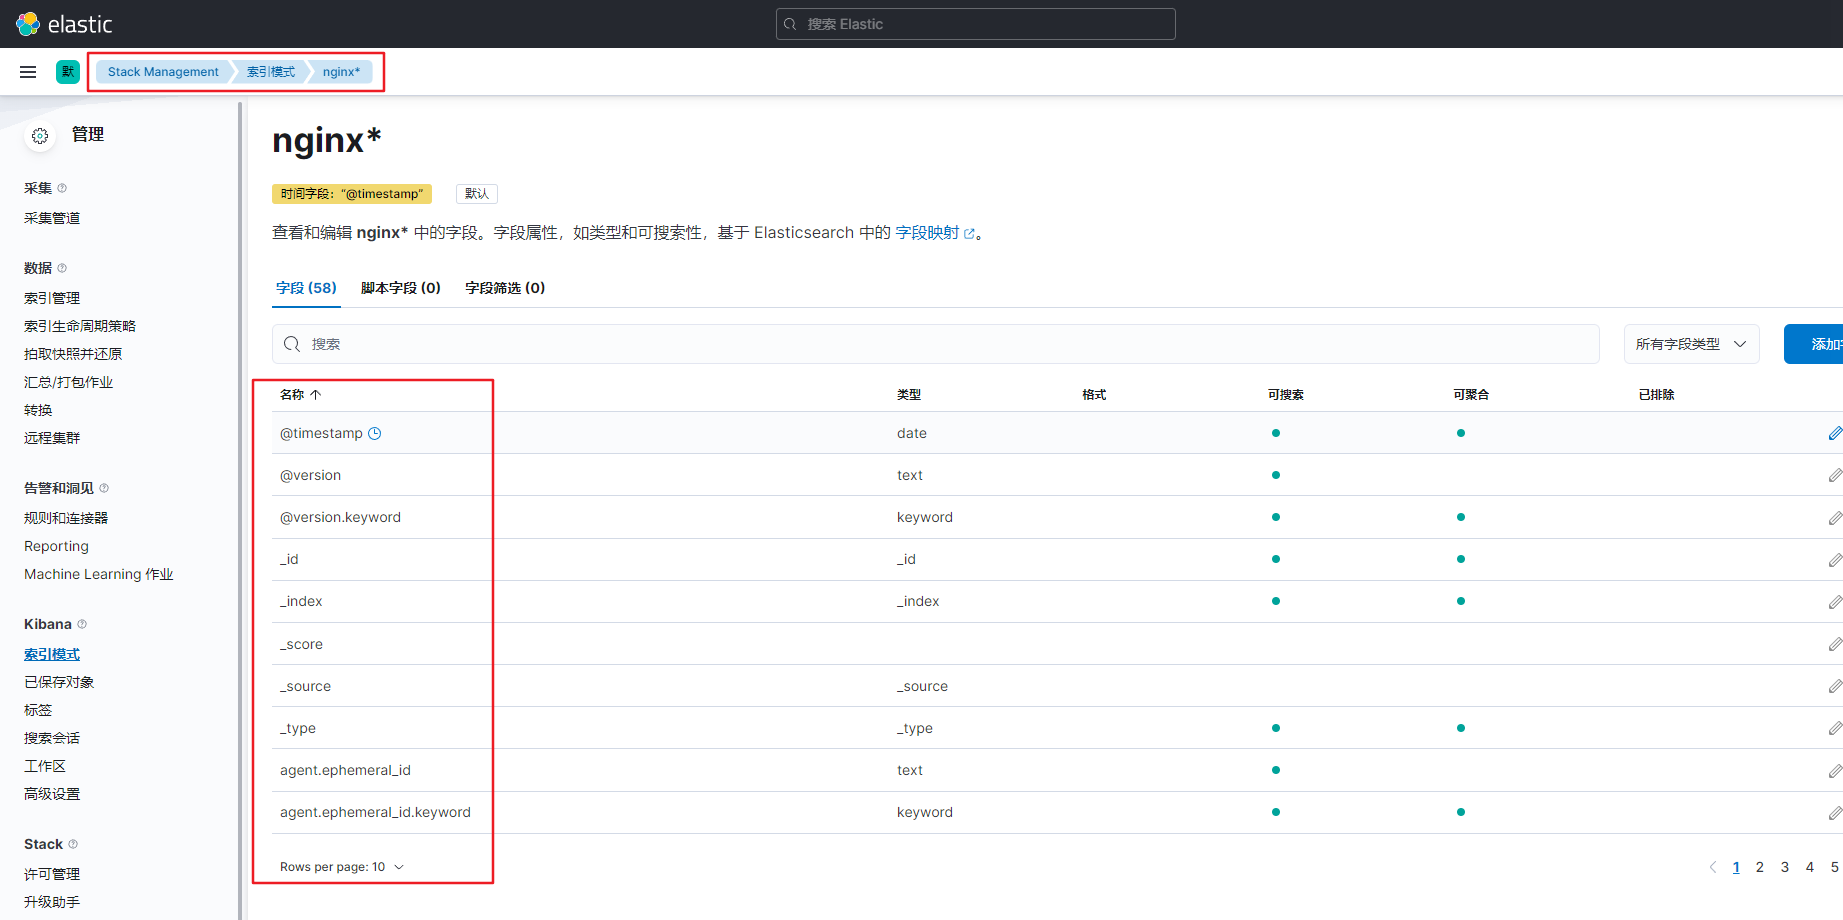
3.3.3、Kibana创建匹配索引

3.3.4、查看索引信息
我们收集到的数据中,包含58个字段,当我们点击某些属性的时候,还会显示简单的排序,到此为止,我们的kibana从elasticsearch中获取数据就配置完毕了
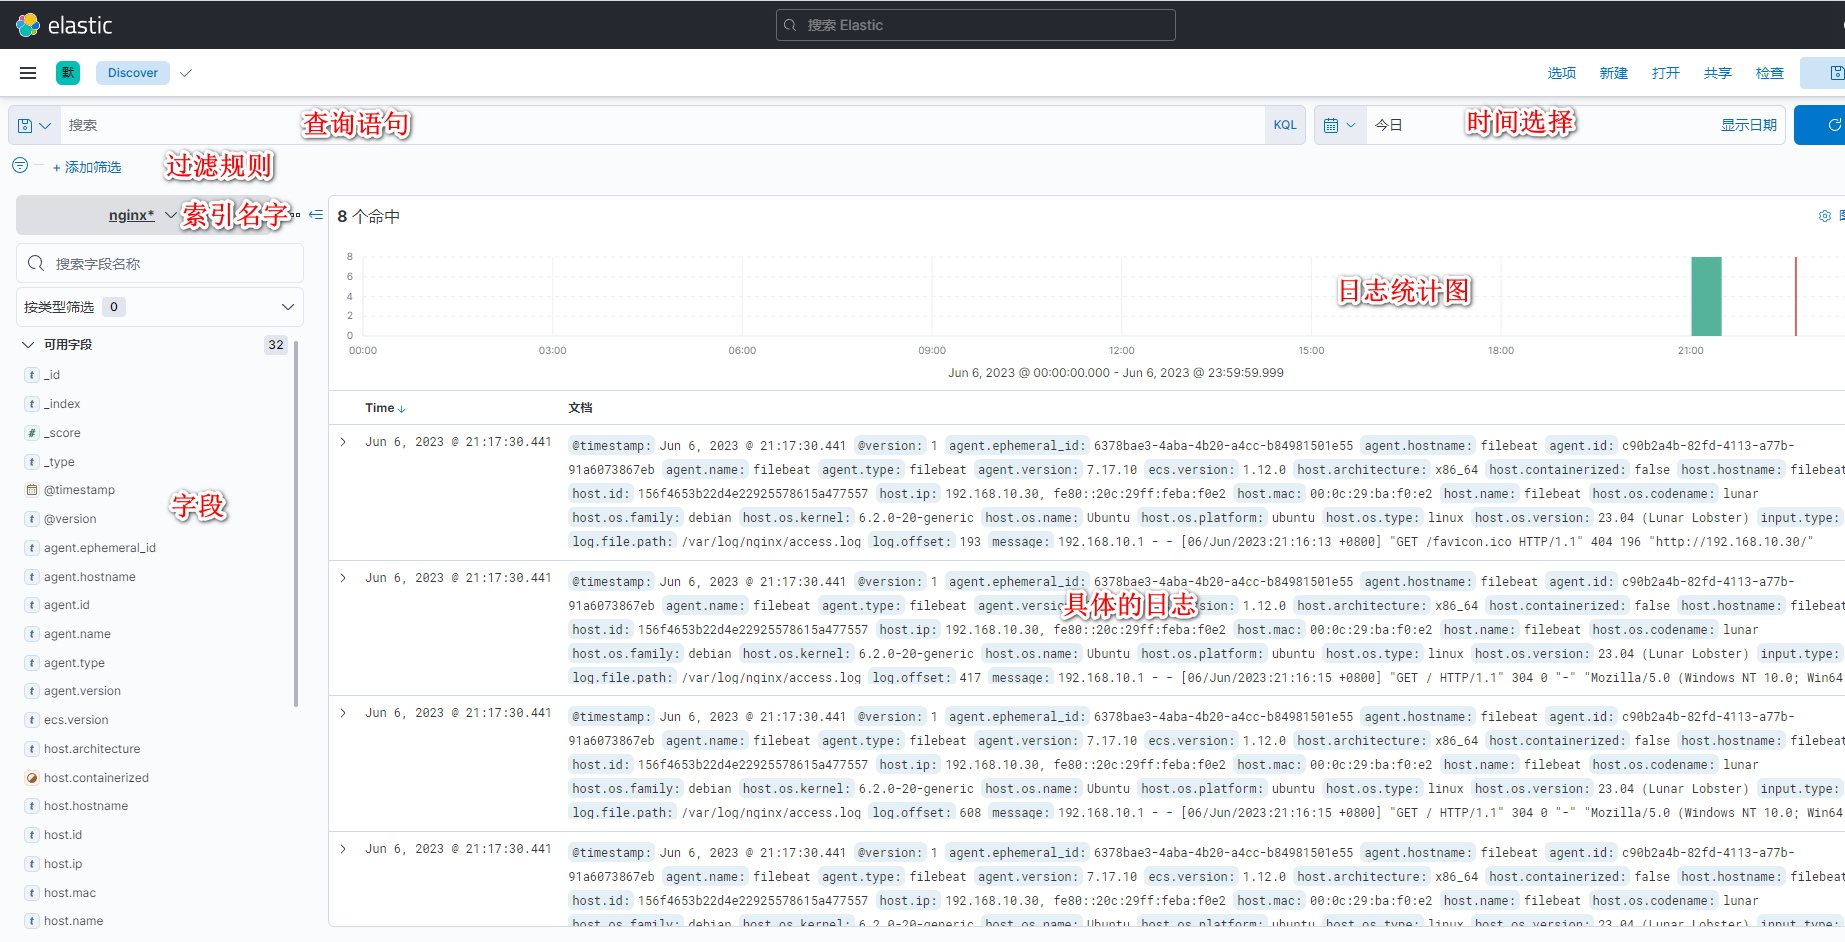
3.3.5、日志查询
点击左边栏的第一个"Discover"按钮,点击"Add filter"的下拉框,选择nginx-*索引名,在"Refresh"右侧选择日志的时间范围,就可以实时的查看到说有数据的获取效果
3.3.6、查询界面介绍
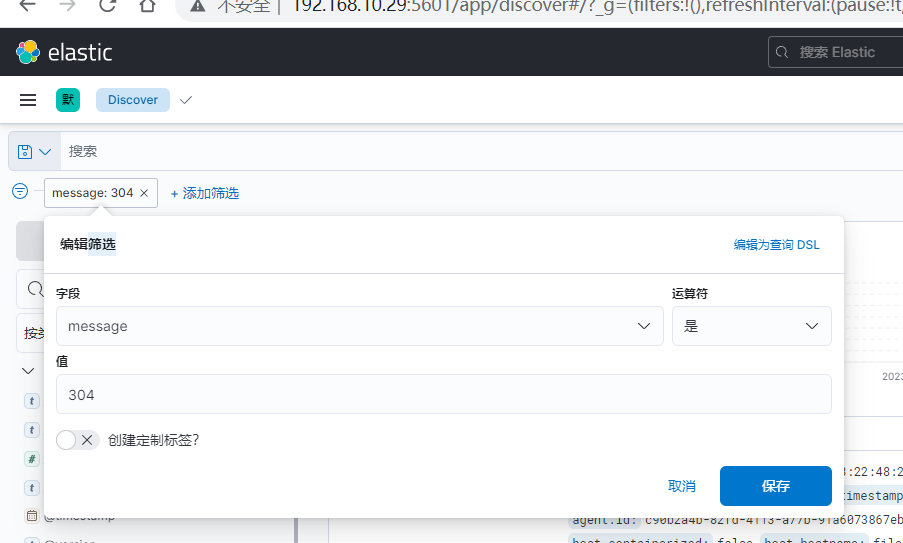
3.6.7、查询筛选过滤
Filters 部分的规则,其实就是日志中的键名是否包含某些关键信息,等同于 KQL的示例 message is 304

KQL语句:message is 304

 浙公网安备 33010602011771号